

Monthly
Flexible monthly access
₹999
+ GST
 1 Month access


Engineered for serious traders.
GTF Indicator 2.0 is crafted for traders who demand excellence — built for the trader who plays ahead, not behind. No noise. No clutter. Only pure opportunity.
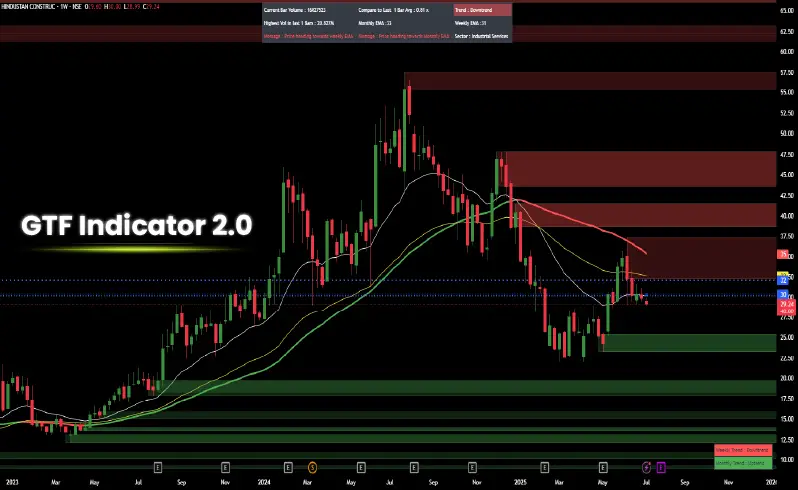
Technical + Fundamental + Multiple Time Frame. The most powerful evolution of our premium demand & supply system — a complete trading framework that combines precise zone detection with fundamental data, HTF zone projection, and smart market structure overlays.
GTF Indicator — Understand Price. Identify Zones. Plan Your Trade. An Advanced Demand & Supply Analysis Tool for Smarter Trading Decisions.
GTF Indicator is an advanced Demand & Supply analysis tool designed to help traders identify key price zones, analyse price behaviour, and plan their trades with greater clarity. It automatically identifies and plots relevant zones on your chart, reducing manual effort and making technical analysis more structured and efficient. GTF Indicator 2.0 offers customizable sensitivity settings, advanced EMA integration, and dynamic zone identification, helping traders analyse price action with greater precision and flexibility.
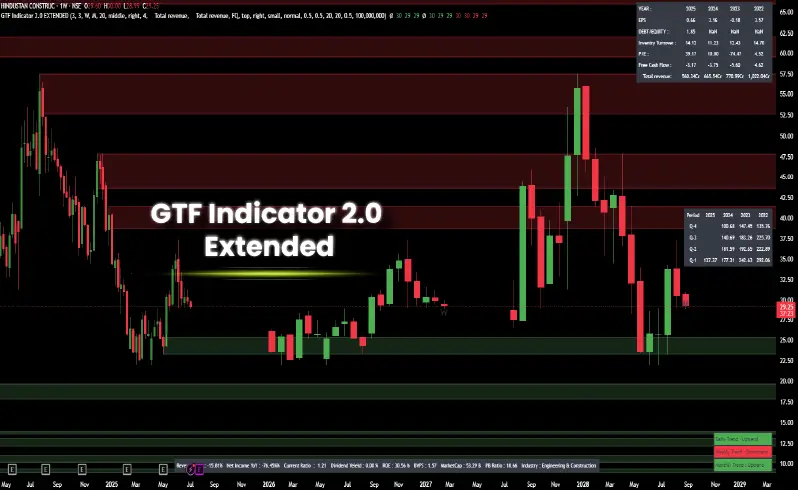
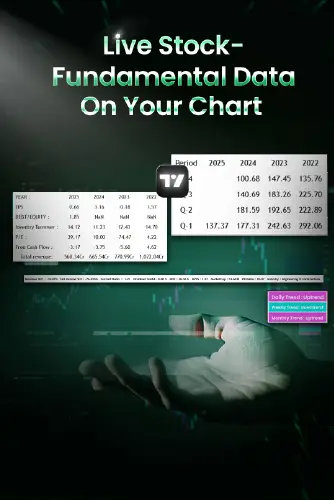
GTF Indicator 2.0 Extended takes analysis further with higher-timeframe zone projections, multi-timeframe candle data, and key fundamental insights such as P/E ratio, earnings, and market capitalization — all accessible directly on your chart. Each version is designed to bring greater clarity, control, and structure to your trading analysis.


Let’s have a look at the features of GTF Indicator 2.0:

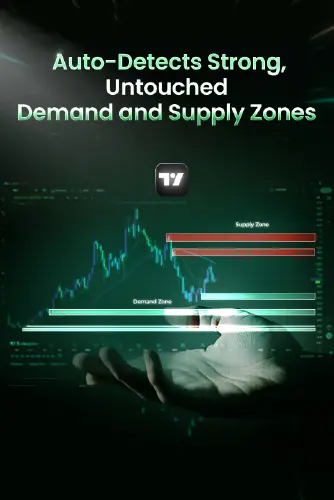
Automatically detects Demand & Supply zones with high accuracy
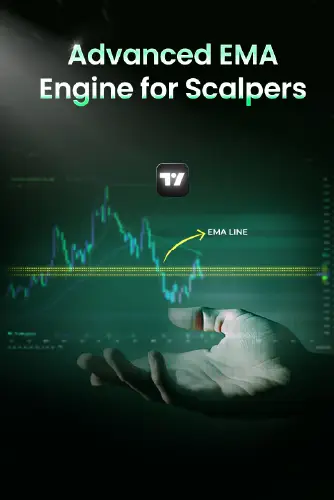
Multiple timeframe EMAs visible on a single chart — great for scalping and trend clarity
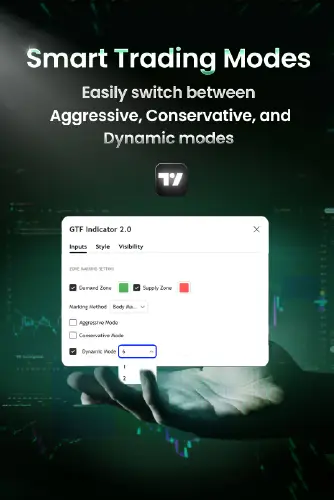
Choose zones based on your style — Conservative, Aggressive, or Dynamic
In Dynamic mode, you can adjust the intensity of aggressiveness as per your preference
Clean and clutter-free display with clearly marked fresh institutional zones
Rule-based plotting helps eliminate emotional bias and supports precise planning
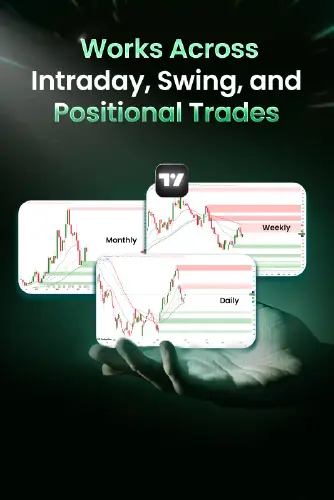
Supports all trading styles — scalping, intraday, swing, and positional
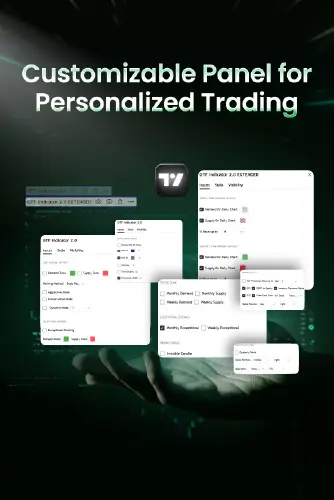
Fully customizable — from zone placement and sensitivity to style and colors
Designed for traders who want speed, structure, and institutional-like clarity

Let's have a look at the advanced features of GTF Indicator 2.0 – Extended:
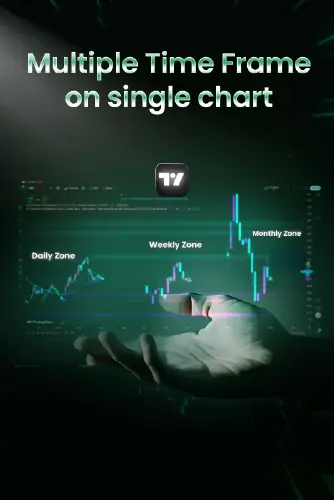
View Monthly/Weekly zones directly on daily charts for top-down clarity
Access multiple timeframe candles in one single chart view
Real-time fundamental data like P/E ratio, earnings & market cap displayed on chart
Automatically detects demand & supply zones with even higher precision
Invisible candles feature for better price structure recognition
Combines technical, fundamental, and market structure — all in one system
Perfect for traders who rely on multi-layered confluence
Offers an institutional-level edge for professional decision-making
Everything is fully customizable — from zone placement to colors and style
You’re just a step away from getting the finest technical trading indicator
Flexible monthly access
1 Month access
Save ₹995 compared with monthly
6 Months access
Beyond Zones. Beyond Timeframes. Beyond Indicators. If GTF Indicator 2.0 is your edge, Extended is your execution advantage.



After opening an account on Dhan, an individual have to trade with Dhan to avail the benefit of automatic Demand and Supply Indicator (t&c)

How GTF Indicator is helping traders to simplify their trading. Here are some reviews about the GTF INDICATOR.
I love the automatic demand and supply indicator by GTF because it has helped me a lot, to improve my trading. It also detects trends according to SMA50 and has massively improved my trading results. Thank you Get Together Finance ...

Thank you Arun sir and Sooraj sir for coming up with this automatic demand and supply indicator, as a part-time trader it was very difficult for me to give much time, but seriously this indicator has made it so easy ...

This indicator is simply amazing and I can say from my personal experience because I have used so many indicators before too but no other indicator works like this, it has seriously made all things so easy and simple. And ...

Sir, there were so many indicators in the market, since when I started using your indicator, I have stopped using any other indicator, because sir, it is the best indicator. Thank you so much for proving it free of cost, ...

My experience with this indicator is superb till now, and because of this, I have saved a lot of time. It detects all the previous zones which have formed so far. The best thing is that it works in every ...

This indicator has improved my trading skills, I have never used any indicator before this, but after using this I got amazed that how easily I can identify all the demand and supply zones automatically through this indicator. This indicator ...

I can't describe this indicator in words, because the major problem I have ever faced in my trading was to find the perfect zone with a proper base candle, but after using this now I can easily find the zone ...



To add the GTF Automatic Demand & Supply Indicator to your chart: go to TradingView.com and log in to your account. Open any chart, then click the Indicators icon at the top of the chart. In the window that appears, select "Invite-only scripts" and choose "Demand & Supply by GTF" from the list. The indicator will load directly onto your chart.
Yes, the GTF Automatic Demand & Supply Indicator works on all timeframes - including 5-minute, 15-minute, 75-minute, 125-minute, and higher timeframes like daily and weekly. It automatically adjusts zone detection to match whichever timeframe you're viewing.
Yes, the GTF automatic demand and supply indicatorworks on all timeframes, including 5-minute, 15-minute, 75-minute and 125-minute, and higher timeframes like daily and weekly. You can use the timeframe that suits your trading style.
Yes, you can install this indicator on any device whether it’s android or IOS. To get the benefit of this indicator download the Trading View application on your phone, then log in to your account and start using the indicator.
Yes, we do provide support You can contact us on @gtfdematsupport on telegram for support.
The GTF Automatic Demand & Supply Indicator can be used across all markets and on all timeframes - including equities, indices, and any instrument available on TradingView.
After opening an account in Dhan through our referral link, if an individual start trading through dhan, then they just need to contact @gtfdematsupport on telegram to get the benefit of our Automatic Demand & Supply Indicator. And the GTF students can directly contact our student support team to get access.
Yes, you can use this indicator in intraday trading/swing trading which will help you to find the best trade with all demand and supply concepts.
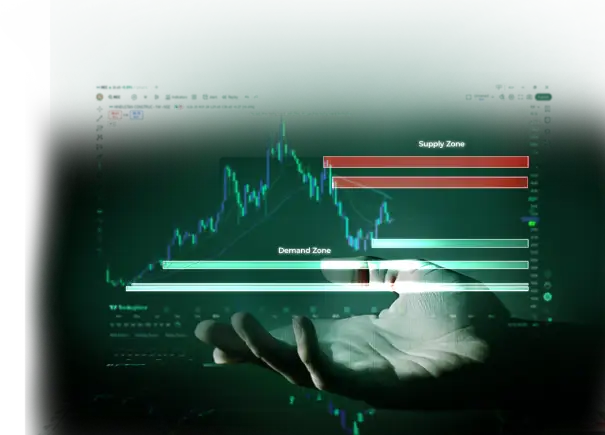
A demand zone is a price area where buyers were strong enough to push the price up. A supply zone is an area where sellers were strong enough to push it down. Traders watch these zones closely because price often reacts when it comes back to them. The GTF automatic demand and supply indicatormarks these zones on your TradingView chart for you, using fixed rules and base candles, so you don't have to draw them by hand. It also finds the older zones that have already formed on the chart.
RSI and MACD show how fast the price is moving, but they don't mark the price areas where buying or selling pressure showed up. Manually drawn support and resistance depends on each trader's own judgment, so two people can draw different lines on the same chart. The GTF automatic demand and supply indicator marks zones automatically, using the same rules on every chart and timeframe. That keeps the zones consistent and removes most of the guesswork.
Yes. The GTF automatic demand and supply indicator works on all timeframes, so you can use it for scalping, intraday, swing or positional trading by picking the timeframe that fits your style.
No, you don't need a premium account just to add the GTF automatic demand and indicator. You can add it from the "Invite-only scripts" section in TradingView's Indicators menu. The free plan has limits, though. It allows only a few indicators on one chart, and custom timeframes like 75-minute or 125-minute need a paid plan. If you use standard timeframes like 5-minute, 15-minute or daily, the free plan should be enough.
The original GTF automatic demand and supply indicator marks demand and supply zones automatically. It also has EMA20, EMA50 and DMA200, SMA50 trend detection, volume information, and previously formed zones. GTF Indicator 2.0 gives more precise zones and adds a smart dashboard with the current price trend, daily, weekly and monthly EMA20, sector information and volume. It also has three modes: Aggressive shows more zones, Conservative shows fewer and more selective zones, and Dynamic adjusts to market conditions. GTF Indicator 2.0 Extended shows weekly and monthly zones on lower timeframe charts. It adds multi-timeframe candles, the Invisible Candle function, and fundamental data like P/E ratio, earnings and market cap.
You get the GTF automatic demand and supply indicator free for lifetime when you enrol in GTF's Trading in the Zone – Advanced or GTF Options Live course. If you're not a GTF student, you can open a Dhan account using GTF's referral code. In this case, access depends on your trading activity. You can also buy the indicator separately for ₹5,000 + GST, which gives you 1 year of access.