Accumulation/Distribution Indicator (A/D): What it Tell You
- Updated on : May 18, 2026
- 2449 Views
- by Manaswi Agarwal

 Instagram
Technical analysis involves the usage of a variety of technical indicators that assist you towards making investment decisions. Accumulation/Distribution is one indicator which provides deep insights about the strength of trend that helps traders to make informed decisions and survive the intricacies of the stock market.
What is the Accumulation/Distribution (A/D) Indicator?

The Accumulation/Distribution indicator assesses whether the stock is being accumulated or distributed which provides insights about the strength of the trend.
Accumulation/Distribution is a line used to gauge the demand and supply in the asset. A/D indicator examines buying and selling pressure where accumulation suggests a bullish trend and distribution suggests a bearish trend in the security. The pattern figures out the trend of a stock and identifies the relationship between the price and volume.
To calculate A/D line:
A/D = Previous A/D + MFV,
Where MFV = Money Flow Volume:
MFV = MFM * Volume
Where, MFM = Money Flow Multiplier
MFM = ((CP – Low) – (High – CP)) / (High – Low)
The value of Money Flow Multiplier or MFP represents buying or selling pressure in a stock. A positive MFP signifies a strong buying pressure or buyer’s dominance in the market as compared to sellers.
Formula and Calculation of the A/D Indicator

The formula and calculation of the accumulation/distribution indicator include the following steps:
- Calculate the Money Flow Multiplier (MFM):
MFM= (Close-Low)-(High-Low) / (High-Low)
The multipliers indicate where the closing price falls within the day’s price change. It provides a value between -1 and +1.
- Calculate the Money Flow Volume (MFV):
MFV=MFM* Volume
This shows the volume adjusted by the closing position in the price range.
- Calculate the Accumulation/Distribution Line (ADL) as a cumulative total:
ADL (current)=ADL(previous)+MFV
This adds on the present money flow volume of the period to the previous ADL value, which presents the total flow of money over time.
Who Developed the A/D Indicator and Why?

The Accumulation/Distribution indicator was created by Mark Chaikin in the 1970s. Mark developed this volume-based technical analysis tool to assess whether an asset is being accumulated (bought) or distributed (sold). The main reason behind the A/D indicator is to present whether money is flowing into or out of the stock.
For this, traders have to keep in mind both the trading volume and price. This assists them in rapidly viewing if more individuals are selling or buying a stock. Also, whether the present price trend will continue or is likely to change.
“The A/D indicator assists traders in estimating volume flow direction and price reversal by presenting when the trend is weakened and supported by volume”– Get Together Finance.
How does Accumulation/Distribution (A/D) Indicator work?

Accumulation/Distribution (A/D) Indicator actually works to help traders predict the direction of volume flow. The indicator is mainly used to anticipate future price reversal in the security. When the price increases but the A/D indicator falls, it represents accumulation which means buying volume cannot support the price upswing that indicates a forthcoming decrease in the stock’s prices. A/D is a volume based indicator which becomes low when the stock price is low and it rises as the stock price increases.
When the stock prices as well the Accumulation/Distribution (A/D) are forming higher peaks, an uptrend is likely to continue in the security and when it fails to do so, it is known as a negative divergence while a downtrend continues when the price continuously forms lower troughs defining a positive divergence in the security.
When accumulation takes place during a trading range with a rise in the indicator, it warns of a breakout in upward direction.
On the other hand, when the A/D indicator falls, it signifies distribution which warns a breakout in downwards direction.
How to use Accumulation/Distribution (A/D) Indicator in Trading?

Traders can make efficient use of Accumulation/Distribution (A/D) Indicator as it is one valuable tool to define the trend in a security. To trade correctly with A/D technical indicator, these ways can be followed:
Enter a long position if the price is rising and the A/D line is also rising, it shows strong buying pressure supporting the trend.
However, if the price rises but the A/D line falls, it may signal a weakening trend and a potential reversal.
Instead, make effective use of demand and supply theory with collaboration of A/D indicator in trading. Mark the demand zones on the higher as well as lower time frames to make informed decisions. Enter the trade when A/D rises from the demand zone as it increases the reliability and the possibilities of the prices to move upwards.
Try to avoid the trade if there are no potential demand zones as it might be a short term movement and the trade can prove to be wrong based solely on the indicator.
A/D Indicator is a valuable means to assess the volume force behind the pricing move and identify the trend behavior. It can easily determine the buying or selling pressure in the security which helps traders to make informed decisions by giving them insights about potential stock price changes. Trading positions are managed as per potential price movements by confirming the strength and sustainability of the trend.
Accumulation/Distribution vs. On-Balance Volume (OBV)

| Aspect | Accumulation/Distribution Indicator | On-Balance Volume |
| Created by | Mark Chaikin | Joe Granville |
| Calculation Method | Utilize the position of the close price in relation to the high-low range and multiplies by volume. | Adds volume on up days and subtract volume on down days. |
| Formula Difficulty | More difficult as it considers price position in the trading range. | Simple, only consider whether the price is close, lower or higher than previous close. |
| Focus | Calculate selling and buying pressure on the basis of price range and volume. | Measure volume flow on the basis of price direction. |
| Interpretation | Positive value signal accumulation (buying) and negative values signal distribution (selling). | Increasing OBV signifies buying pressure and decreasing OBV signifies selling pressure. |
| Visualization | It merges as a line that sums up the amount of money flowing in and out over time. | It is presented as a line that sums up the total traded in the long run. |
| Sensitivity | More sensitive to volume interaction and price. | Less sensitive; consider volume changes in regards to price movement. |
“The A/D lines mark price-volume divergence, which helps traders in confirming trend momentum and continuation”- Corporate Finance Institute.
Bullish and Bearish Signals Using the A/D Indicator

Bullish and bearish signals using the accumulation/ distribution indicator, which majorly depend on determining divergence between the accumulation/distribution line and price movement.
Bullish Signal
- A bullish indication happens when the price of stocks decreases, but the A/D line goes upward. This divergence shows higher buying pressure in spite of a price decline, which indicates less seller strength.
- Another bullish signal is when both the accumulation/distribution line and price are increasing together.
- If the price is even but the accumulation/distribution line is going upward, which means buyers are purchasing stocks. Also, it estimates a breakout to upside.
- In correction, positive divergence is seen when the price goes lower but the accumulation/distribution line holds steady or increases, which indicates a reversal formation.
Bearish Signal
- A bullish signal occurs when the price of stocks increases but the A/D line goes downward. This indicates that sellers become active which potentially leads to reverse in trend and price declines.
- When both the accumulation/distribution line and price decreases, the seller becomes active, which shows a downtrend.
- If the price remains the same, the A/D line goes down, and sellers become active.
- In correction phases, a bearish divergence takes place when the price goes up, but the accumulation/distribution line fails to confirm this by flattening or declining.
Pro Tip-Use the accumulation/distribution indicator to mark divergence between volume and price, as these are early warnings of trend reversal.
Combining with Other Technical Indicators

Joining the accumulation/distribution with other technical indicators assists traders in making better decisions. Also:
- It confirms the signal.
- Lower false alarms.
- Gives a clear view of market trends.
When Not to Use the A/D Indicator?

The accumulation/distribution indicator should not be used in the following aspects:
- In a fast-moving or highly volatile market where prices change rapidly. Also, the A/D indicator gives late signals or a lag.
- It can give false indications during the low-volume market. In this, slight changes in volume appear but don’t show true selling or buying pressure.
- It does not work well for assets with less liquidity or price gaps.
- Using it alone without combining any other indicators can be risky.
Use of A/D Indicator in Intraday vs Swing Trading
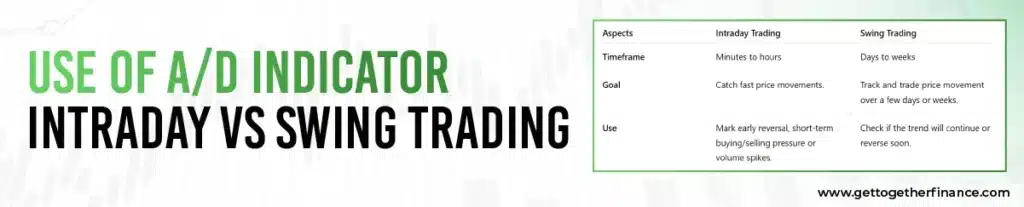
| Aspects | Intraday Trading | Swing Trading |
| Timeframe | Minutes to hours | Days to weeks |
| Goal | Catch fast price movements. | Track and trade price movement over a few days or weeks. |
| Use | Mark early reversal, short term buying/selling pressure or volume spikes. | Check if the trend will continue or reverse soon. |
| Ideal For | Traders who close or open positions on the same day. | Traders holding positions for numerous days or weeks. |
| Signal Sensitivity | Requires to identify fast volume changes. | Focuses on ongoing buying and selling activity over a longer time. |
| Trend Confirmation | A/D indicator assists in confirming breakout and short term reversal. | A/D indicator helps in confirming whether the price will continue to go or reverse. |
| Interpretation Nuances | More sensitive to intraday volatility and market noise. | Less noise, clear signals indicate bigger trend forces. |
Common Mistakes When Using the A/D Indicator

Common mistakes when using the accumulation/distribution indicator comprise:
- Depend only on the A/D indicator without verifying signals with other technical tools.
- Not considering the market context, like earring announcements, can affect the price.
- Complex analysis by using numerous indicators leads to confusion.
- Ignoring price gaps.
- Utilizing it alone for managing risk results in bad trade timing.
Limitations of Accumulation/Distribution Indicator

Apart from this, there are many drawbacks to accumulation/distribution indicators in technical analysis. A/D indicator does not consider gaps in the prices on the charts, the unnoticed series of price gaps does not represent actual changes between different time periods.
The connection between the stock price and the indicator might break as A/D line ties with the price movements for a period. A/D indicator cannot be used as a standalone as it requires other technical indicators to compliment the trading activities.
Covering that, a trader cannot manage risks with the use of A/D Indicator which makes it tough to take correct decisions at the right time.


