Demand and Supply Dynamics – Connecting the Dots
- Updated on : May 23, 2026
- 5229 Views
- by Arun Singh Tanwar

 Facebook
 Instagram
 Youtube
Introduction
Ever felt like your head is about to explode from information overload? We’ve been there too! After reading all the fundamentals of demand and supply dynamics, we brought you a new blog. But this time we are not talking fish, we’re talking real and ready to spill some beans. Imagine demand and supply dynamics as the GPS of the stock market, guiding us through its ups and downs. But hold on, it’s not all smooth sailing; there are many factors that can make it a rollercoaster journey. Let’s dive into the technical analysis of demand and supply dynamics, shall we?
What is Demand and Supply Dynamics in the Stock Market
Imagine the stock market as a massive game of trading cards. Demand is when everyone’s eying for a specific card, making its value shoot up. Supply is when lots of people start selling that card, causing its value to drop. The price of these cards bounces around as people trade and deal, all depending on how much people want to buy or sell. It’s like a never-ending card swap where the excitement keeps the prices moving!
Fun Fact: Back in 1634, the Dutch went crazy over tulips, and the demand got so high that tulip bulbs were selling for crazy prices, even more than houses! It’s known as the “Tulip Mania.” Imagine trading your house for a bunch of flowers!
Fundamentals of Candle Formation
Picture stock charts as candles – they’re like little stories of price moves. As you can see in the charts, every candle has a body and tail. It just looks like a candle – until we tell you that there’s more to it!
Each candle color tells a different story. These elements help us understand how prices moved in a given time. Although, the color makes price moves easy to catch!
- Green Candle: Now, for green, it’s “price went up.” Bottom to top, it’s a gain.
- Red Candle: When you spot red, think “price went down.” Start to bottom, it’s a drop.
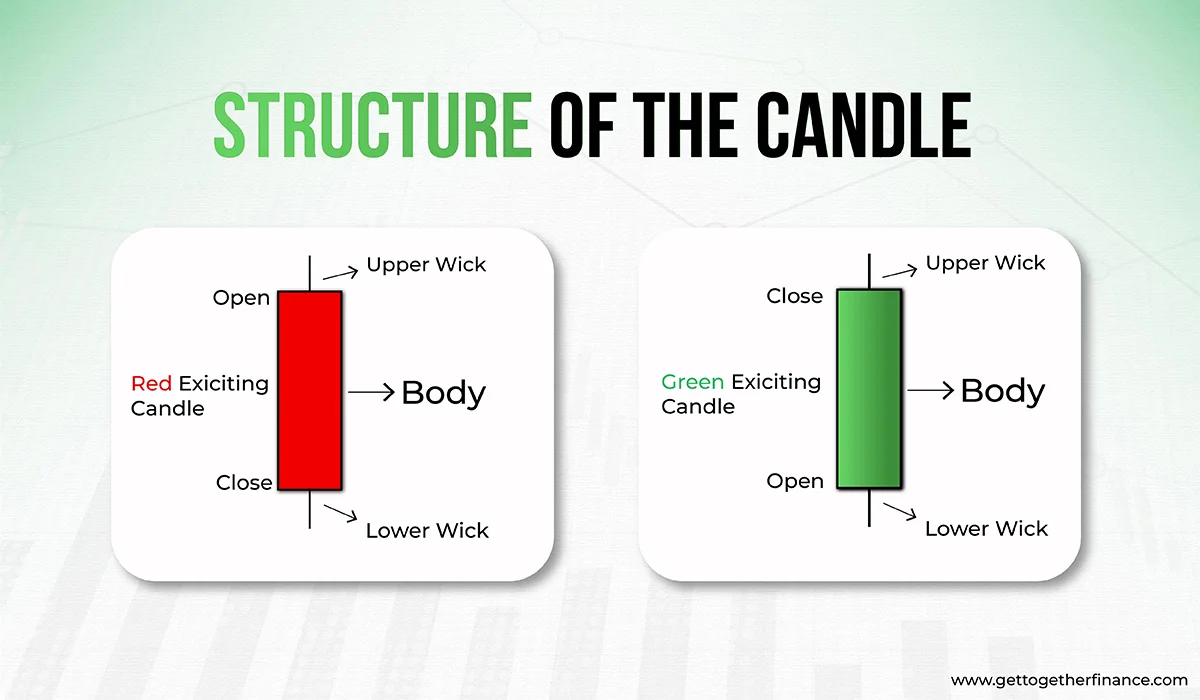
Structure of the Candle
The shape and size of these candles give hints about how the market feels. By understanding these candle formations, you can identify demand-supply zones, spot trends, find candlestick formations, identify chart patterns like Double-top and Bottom , Head and Shoulder pattern etc. and make better trading decisions. Now, let us take you on a tour to the technical side of the journey!
- Upper Wick: Imagine this as the “highest point” wick or the upper tail of a candle. It shows the top price the stock reached. Picture a flag on a tall mountain.
- Body: Think of this as the main part. It shows how the stock opened and closed. If the body is filled, it closes lower than it started. If it’s empty, it’s the other way around.
- Lower Wick: This is the “lowest point” wick. It shows the bottom price the stock hit. Picture a little flag in a valley.
So, each candle tells a quick story about how the stock’s price moved around. Learning these parts helps you understand where the stock has been and where it might go. Simple, right?
Fact Check: Let’s learn about closing and opening of a candle. The wick (tail) of a candle tells about the high and low points of the candle. If the tail is longer at the top, it means the stock reached a higher price but closed lower. On the flip side, if the tail is longer at the bottom, it means the stock went lower but closed higher. Likewise, the candle body shows closing and opening price. In a green candle, the lower body is the opening price and the upper body is the closing price. And in a red candle, the upper body is the opening price and the lower body is the closing price.
So, the tail is like a visual clue about the battle between buyers and sellers during that period.
Logic of Pending Orders
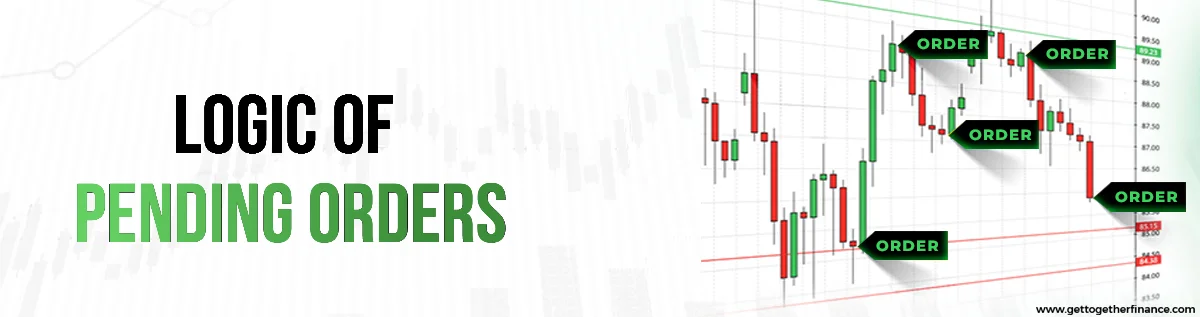
Think of the base candle like a playground for buyers and sellers in the stock market. And guess who shows up? Pending orders! They’re like secret messages that decide whether the next candle will leave a green or red footprint behind. They announce the mighty tale of the winner of battle between buyer and seller with visual candles. It’s like a pause before a new candle starts.
So, while all the action is happening, these pending orders are working backstage to get ready for the next move in the market. And that’s when it either creates the demand zone or the supply zone.
Special Note: There is no way anyone can count these pending orders, but they make a big difference. They create special areas where buyers and sellers meet, showing the market where to go next.
Also Read: Price Elasticity of Demand
Example of Pending Orders
The secret of buyers, sellers, and pending orders is the key of the biggest questions about the stock market – why the stock price fluctuates, who determines the stock price, and how the stock market works.
Let’s take an example: Imagine an XYZ company buys a million (10 lakh) toy cars, worth 1 crore rupees. Now, think of these toy cars as shares in the stock market. Now, the order of 9 lakh cars are sold off immediately.
But guess what? There’s still a bunch of toy cars – 1 lakh of them – just hanging out, waiting for someone to pick them up and there is no seller left. And yes! Here’s the twist: these pending orders can sometimes be a bit sneaky. Now there are 1 lakh orders pending in the market, still haven’t been bought yet.
This creates a bit of a battle between the buyers and sellers in the market, all happening in the background. They wait in the shadows until the right time comes. And when they do show up, they can make the price jump or drop suddenly, just like a surprise dance move. And that’s how, in simple terms, demand and supply dynamics work. Pretty easy, right!
Cracking the Code of Demand-Supply Zones
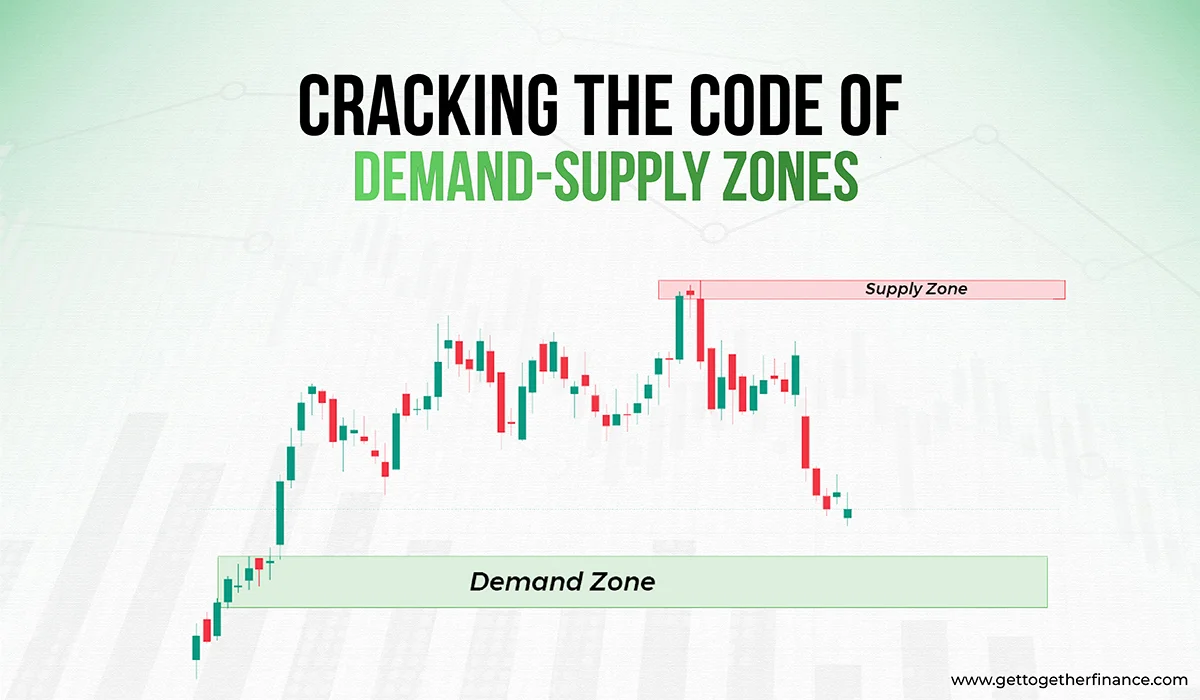
According to trading and stock market experts, demand and supply dynamics is one of the most reliable techniques to ace the game of stock market. But it’s important to dig deep in the demand-supply zone and know how you can detect it to be ahead of the game. Let’s swim in the ocean of info more:
Demand Zone – The Buyer’s Triumph
Imagine you’re at a sports game, and the crowd is cheering for their team. Now, in the stock market, when we talk about the Demand Zone, we’re talking about a situation where the buyers are winning the game. Here’s how it works:
- Let’s follow through with an example. Remember those 1 million orders from XYZ? Out of them, only 9 lakh orders found their match and got sold. But what about the other 1 lakh orders? They’re still hanging around, waiting for their turn but no one is selling the car in the market anymore. This is where the magic begins.
- Now, these pending orders set the stage for something interesting – it’s called a base candle. Imagine this base candle as a little rest stop in the stock market journey. During this time, buyers and sellers are in a battle, trying to figure out who’s going to take the lead.
- Think of it this way: the buyers want the price to go up, while the sellers want it to go down. It’s a tug of war over the price. And as the battle comes toward the end, the stock price remains somewhat steady, like a pause candle on the chart.
- If the buyers win the battle – that’s where they wave the victory flag of a demand zone. It’s like the buyers are saying that there is no way you can win over until the next fight.
- This change is represented by a green candle on the stock chart, and it’s a sign that the buyers are in control. And all of this action begins with those pending orders, setting the stage for a thrilling showdown. Cool, right?
The Demand Zone is like a beacon of positivity. It shows that buyers have taken control, and the stock’s price is likely to rise as they continue their efforts.
Supply Zone – The Seller’s Triumph
Remember that sports game? Well, sometimes the opposing team wins, and that’s where the Supply Zone comes in. In this scenario, sellers have the upper hand:
- Let’s go back to the scenario where the buyer goes ahead and executes an order for 1 million cars (stocks) and 1 lakh orders are still pending. Now, during this halftime, there’s a fierce battle going on between the buyers and sellers. It’s like watching two teams strategize and compete for the upper hand.
- But this time, even after the recent purchase, more sellers showed up than assumed. They’re like the opposing team that scores a crucial point, shifting the momentum in their direction.
- As a result, the stock’s price starts to slide down, just like the opposing team taking the lead in a game. This downtrend is represented by a red candle on the stock chart.
- This is where the supply zone comes into play. It’s like a territory claimed by the sellers, influencing the market’s downfall after a fierce fight with the buyers.
The Supply Zone is a warning sign that sellers are gaining momentum. The stock’s price might drop further as they continue their influence.
The Physics of Trading
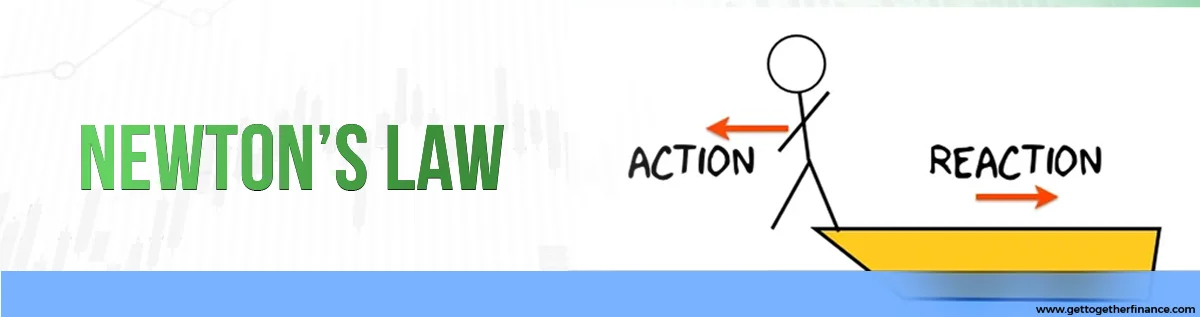
The laws of physics have a cool connection to trading. Let us tell you the gist of the story. Sir Isaac Newton, the famous English Physicist and mathematician figured the cause behind any object behaviour. He quoted “An object at rest stays at rest, and an object in motion keeps moving at the same speed and direction unless something outside pushes or pulls on it.”
Basically, things like to keep doing what they’re already doing. This idea also means that objects don’t like change – they resist it. This resistance to change in motion is called inertia. But how does all this connect to the stock market and trading?
Imagine the way prices move in the stock market – it’s kinda like inertia in action. Just like in physics, the only reason a market stops going up is because some force messes with it. In this case, it’s like a bunch of people suddenly deciding to sell (supply), and that’s what stops prices from climbing any higher.
In Addition
Supply-demand dynamics is just like a seesaw battle between two teams. Sometimes the buyer wins, leading to a green candle and creating a reliable demand zone. Other times, the sellers dominate, causing a red candle and a supply zone. This constant back-and-forth is what shapes the dynamic dance of the stock market and decides the price and growth of any stock. Just like in a sports match, the game isn’t over until the final whistle blows!
Wanna Know More?
Information can be liberating, but technical overload can cloud your brain and can be too much. We all agree that sometimes we give our best shot but get no result without right strategies and proper guidance. You might either be the guy who got it all or the guy who needs a little push and mentor support. “Trading in the Zone – Elementary” is your step-by-step guide to technical knowledge of the stock market.
It’s like a demand-supply map that comes along with lifetime mentorship to guide you when you feel lost. Or you can access the Sanjeevani Booti of demand and supply dynamics by clicking on this link.


