Double Top and Double Bottom Pattern: Complete Trading Guide 2026
- Updated on : May 23, 2026
- 5190 Views
- by Arun Singh Tanwar

 Facebook
 Instagram
 Youtube
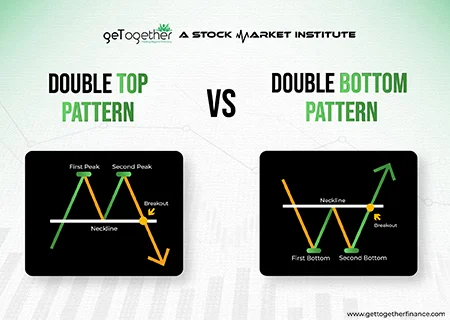
Over the years, experts in the stock market have developed various techniques and strategies to study price charts. These techniques eventually help in forecasting the price movement of the stock. One such technique is the candlestick chart patterns.
The double top pattern and the double bottom pattern are one of the prominent candlestick chart patterns. These patterns help in indicating possible trend reversals.
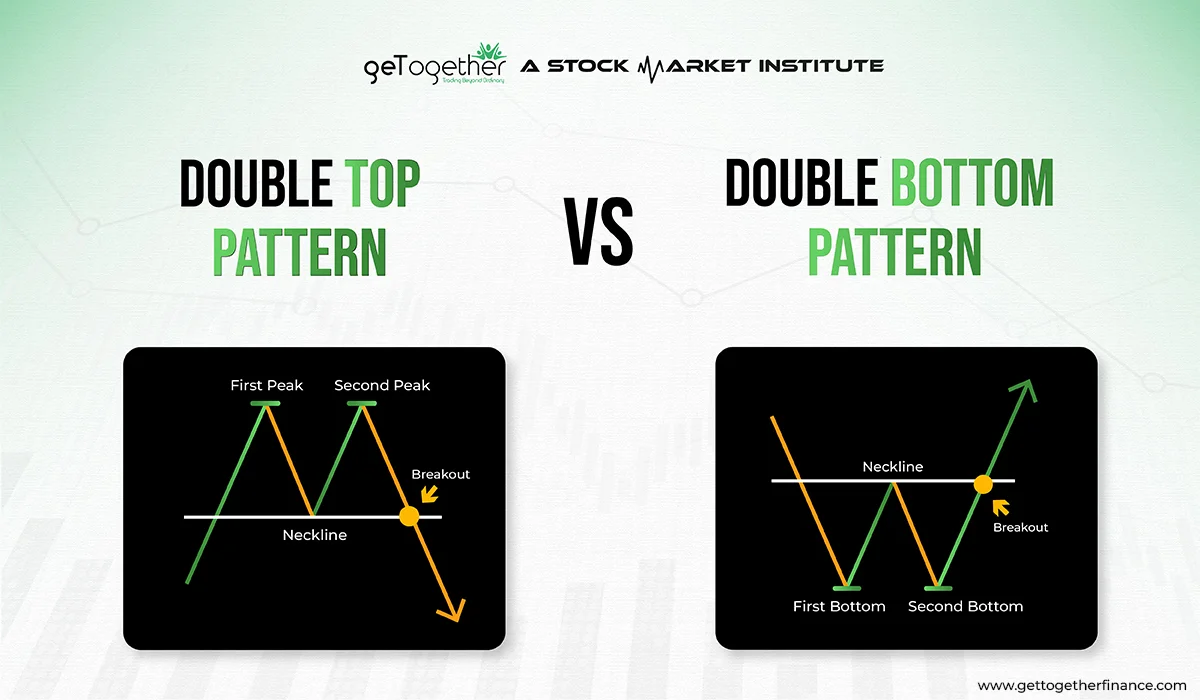
The double top and double bottom chart pattern is one of the easiest and most reliable candlestick chart patterns. The double top pattern helps in forecasting a possible bearish trend, and the double bottom pattern helps in forecasting a possible bullish trend.
What is the Double Top Pattern?
The double top pattern is formed at the end of the upward rally or the uptrend. In the uptrend, the price keeps hitting a new high every time, creating different resistance zones. But, when the price consolidates between the same resistance zone two times, the double top pattern is formed. Here, the price is restrained to go up from a certain point.
No new resistance zone has been created at this point. Thus, when the price of the stock is not able to pass above a certain resistance level, the double top pattern is formed. This signals the start of a reverse trend in the price of stock. If the formation of a double top pattern falls in the supply zone, then it is highly probable that the price will go down after the pattern formation.
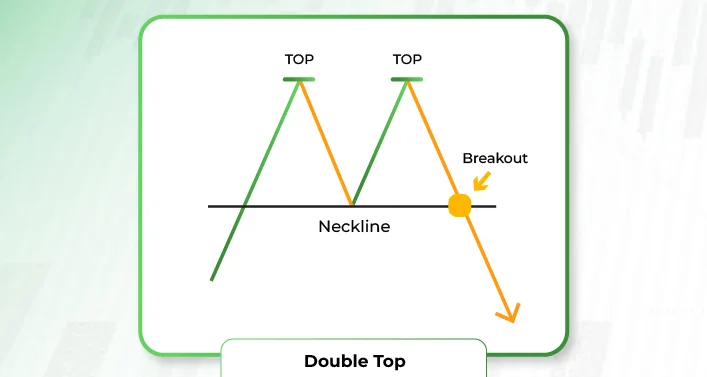
The shape of the pattern is similar to the “M” shape. Here the peaks of “M” are at the resistance zone from where the price is unable to go up. After the “M” pattern is formed, the breakout point comes at the support zone, from which the downtrend starts.
Also Read: Shooting Star Pattern
How to Spot a Double Top Pattern?
The double top pattern helps in identifying when the price of the stock is going to witness a bearish trend reversal. It can be interpreted as:
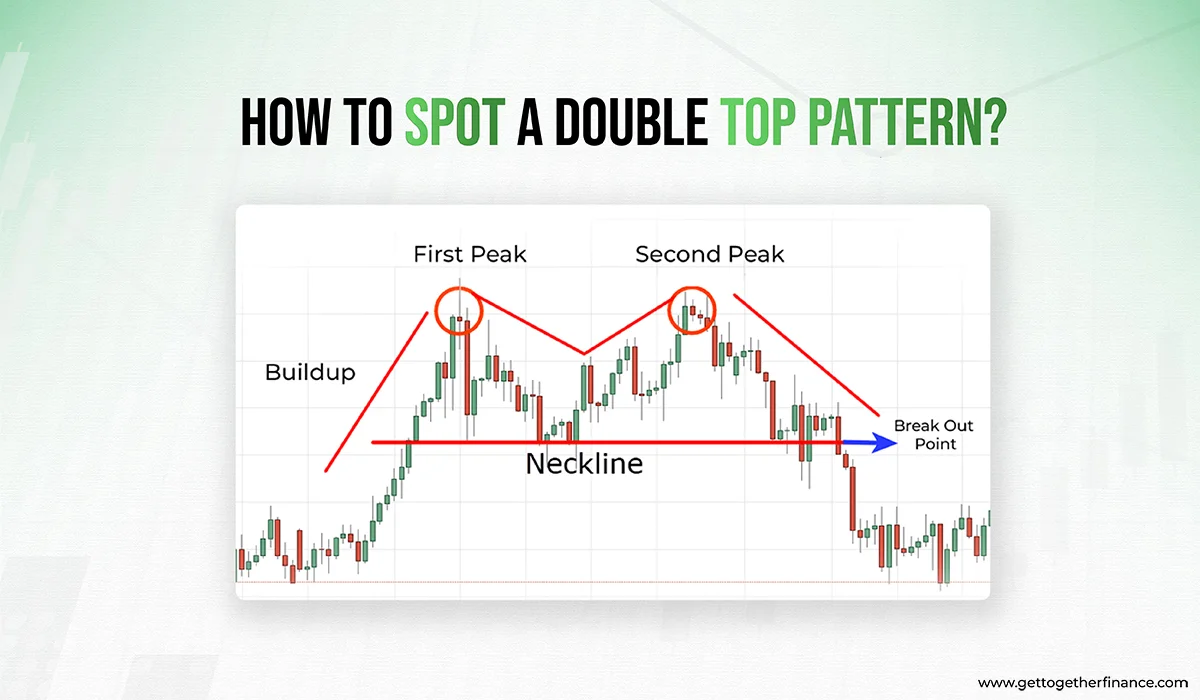
The buildup: This pattern is formed in an upward rally. In the upward rally, the price keeps making a new high consecutively. Whereas, at one point, the price stops increasing and hits the same high twice at the same price range, here the double top pattern is formed. This is because, the buying pressure has stopped, and now sellers are overtaking the market.
Same high: When the price is unable to go up after hitting the same high, an “M” shape pattern is formed. As the pattern is made after the buying pressure reduces, it signals a bearish trend may start by ending the uptrend.
Breakout point: After hitting the same high twice when the price comes down, it is highly probable that a trend reversal can be seen after the price crosses the neckline. Here, the breakout point is when the price crosses the neckline. Thus, selling in the underlying can be seen.
Let’s understand it in a simple way when the rally started from 100 and hit a high of 120, but then it bounces down to 110, which leads to the formation of half “M”. When the price has again risen from 110 to 120 but is unable to go higher than 120, the double top pattern is signaled. As the price is unable to go up after 120, it starts dropping.
Following, the price hits 100, and this was the starting point of the pattern also, the neckline of the pattern is also in this range. When the price hits 100, the double top pattern completes, and after the breakout, a bearish trend is expected.
What is Double Bottom Pattern?
The double bottom pattern is formed at the end of the downward rally or the downtrend. In the downtrend, the price keeps hitting a new low every time, creating different support zones. But, when the price consolidates between the same support zone two times, the double bottom pattern is formed. Here, the price stops falling after a certain point. No new support zone is created at this point in the downtrend.
Thus, when the price of the stock is not able to go below a certain support level, the double bottom pattern is formed. This signals the start of a reverse trend in the price of stock. Thus, the price is expected to go up from here. If the formation of a double bottom pattern falls in the resistance zone, then it is highly probable that the price will go up after the pattern formation.
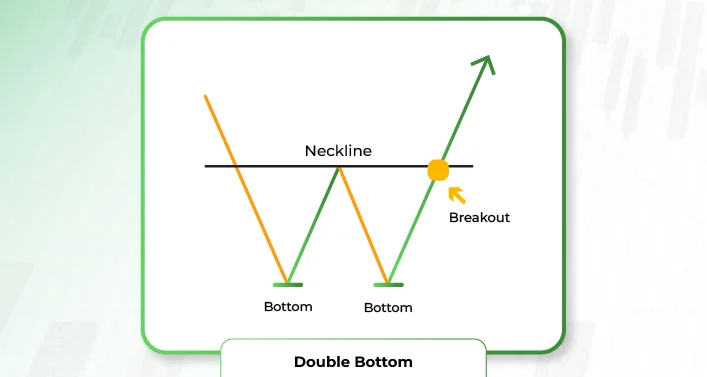
The shape of the pattern is similar to the “W” shape. Here the bottom points of “W” are at the support zone from where the price is unable to go down. After the “W” pattern is formed, the breakout point comes at the resistance zone, from where the uptrend starts. The pattern is formed when the selling pressure reduces in the market and the buying starts.
How to Spot a Double Bottom Pattern?
The double bottom pattern helps in identifying when the price of the stock is going to witness a bullish trend reversal. It can be interpreted as:
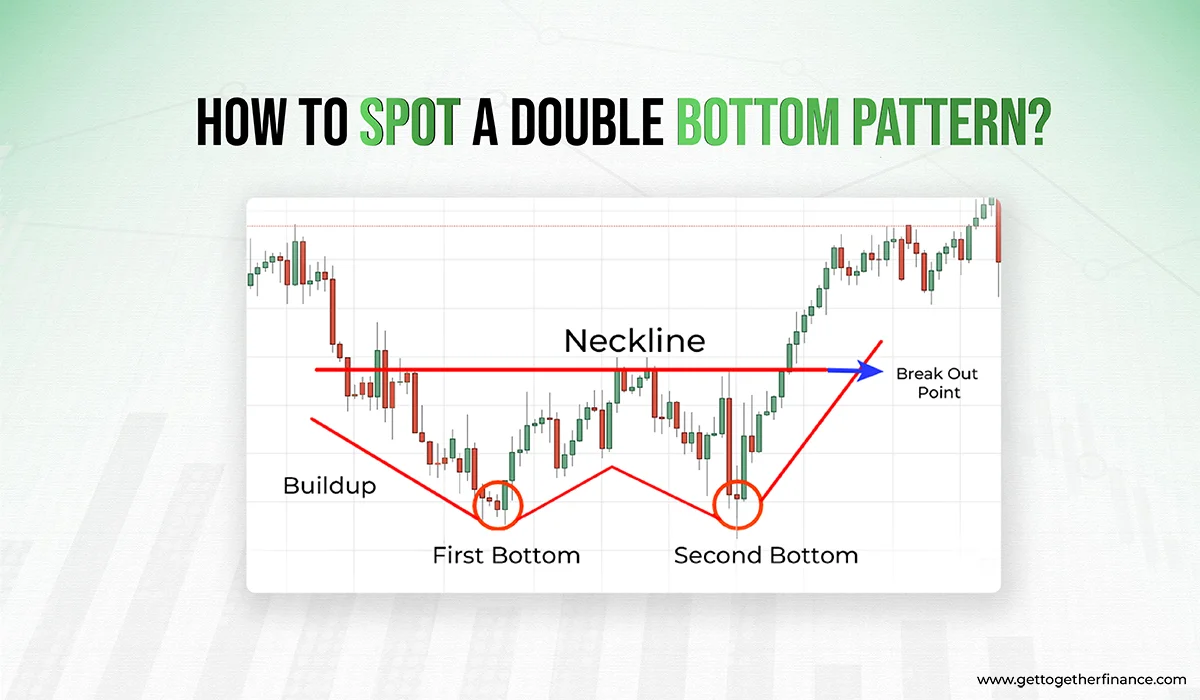
The buildup: This pattern is formed in the downward rally. In the downward rally, the price keeps making a new low consecutively. Whereas, at one point, the price stops falling and hits the same low twice, here the double bottom pattern is formed. This is because, the selling pressure has stopped, and now buyers are overtaking the market.
Same low: When the price is unable to go down after hitting the same low, a “W” shape pattern is formed. As the pattern is made after the selling pressure reduces, it signals a bullish trend reversal.
Breakout point: After hitting the same low twice when the price comes up, it is highly probable that a trend reversal can be seen after the price crosses the neckline. Here, the breakout point comes when the price crosses the neckline. Then the increase in price can be seen.
Let’s understand it in a simple way when the rally started from 120 and hit a low of 100, but then it again rises back to 110, which leads to the formation of half “W”. When the price has fallen from 110 to 100 again but is unable to go lower than 100, the double bottom pattern is formed.
As the price is unable to go down after 100, it starts to go up again. Following, the price hits 120. This was the starting point of the pattern, the neckline of the pattern is also in this range. Here, the breakout point is at 120. After 120, it is highly probable that the price will go up, resulting in a trend reversal.
Best Tools to Spot Double Top and Double Bottom Patterns Automatically

These tools are:
- TradingView Indicator.
- TrendSpider.
- MetaTrader 5.
Which Timeframes Are Best for Double Top and Double Bottom Patterns?

Generally, higher-framework charts are most beneficial for traders, mainly the weekly or daily charts, as they reduce false signals and increase trustability.
How to Confirm a Double Top or Double Bottom Pattern?

A double top candlestick pattern confirms when the price breaks and goes below the neckline, which indicates selling pressure. While double bottom candlestick patterns confirm when the price breaks and goes above the neckline, which shows buying pressure.
Analyzing Support/Resistance Levels with Double Tops and Bottoms
Double Top-Pattern
- Resistance Level: In a double-top pattern, the points with peaks are considered good resistance points. Because the price has reversed two times from there, it shows that great selling pressure is lying in that area.
- Support Level: On the contrary, the support level in the double-top pattern is a trough from where the price bounces again to give a new high. A good buying pressure is said to be there that gives a good push to the price for the completion of the pattern.
Double Bottom Pattern
- Resistance Level: The resistance level in the double-bottom pattern is a peak from where the price bounces again to give a new low. A good selling pressure is said to be there that gives a good push to the price for the completion of the pattern.
- Support Level: In a double-bottom pattern, the points with troughs are considered good support points. Because the price has reversed two times from there, it shows that great buying pressure is lying in that area.
Advantages and Disadvantages of a Double Top & Double Bottom Pattern
Double Top Pattern
Advantages
- Predictable: It often predicts the reversal in the uptrend
- Profit opportunities: Gives traders the opportunity to take short trades at the right point and capitalize on a downtrend.
- Good confirmation: An excellent confirmation of pattern breakout can be taken at the price breaks support level or the neckline. It shows that the downtrend has started.
- Widely recognized: It is a universally recognized pattern, making it popular among every type of trader.
Disadvantages
- False Signals: Often the pattern results in failure because of false signals, excellent advanced technical analysis support is ended for reliable trade setup.
- Delayed Entry: Waiting for the breakout point might result in missing half downtrend, missing out on an optimal entry point.
- Market Conditions: The patterns do not work in highly volatile market conditions, hence are not reliable all the time.
- Volume Requirement: It usually requires confirmation in the form of increased trading volume, which may not always be the right indicator.
Double Bottom Pattern
Advantages
- Indicates Reversal: it helps in identifying a potential reversal in a downtrend, giving traders capitalize on long positions.
- Risk Management: Provides realistic stop loss points near the lows of the pattern to save traders from adverse market conditions.
- Confirmation: The double bottom structure of the setup is confirmed when the price breaks above the resistance level (the high point between the two bottoms), which increases the trade setup’s reliability.
- Recognition: Easily identifiable and a popular trading pattern among trailers worldwide.
Disadvantages
- Pattern Failure: When the overall trend is bullish, one cannot take long trade based on a single pattern, it traps traders as the downtrend continues.
- Late entry: Confirmation of pattern misses out on the half rally that could’ve given good profits to the trader.
- Not Reliable Throughout Likewise to double top pattern, it doesn’t work in volatile markets.
- On used as an Add-on: This pattern can only be used as an add-on to your in-depth technical analysis, solely relying on this pattern might lead to unreliable trade-setups.
How Reliable Are Double Top and Double Bottom Patterns?

Within technical analysis, double top and double bottom patterns are mainly considered the most reliable reversal patterns. This is because it clearly shows the struggle between seller and buyer at a resistance or support level. Furthermore, it is identified as a strong indicator of trend reversal. As some sources propose, when traded and identified correctly, these patterns have 65% to 75% success rates.
Can Double Top and Double Bottom Patterns Fail?

Within trading, no chart can give a full guarantee of future price movement. Double top and bottom fail because of many reasons, which include:
- Incomplete confirmation.
- Subjectivity in volume.
- Overriding market conditions.
- Lack of volume confirmation.
Double Top vs Double Bottom
| Double Top | Double Bottom |
| It can only be confirmed after an uptrend | It can only be confirmed after a downtrend |
| Have two consecutive peaks (M shape) | Have two consecutive troughs (W shape) |
| Price hits the same resistance level twice | Price hits the same support level twice |
| Breakout point leads to the downtrend | Breakout point leads to the uptrend |
| Breakout below the support level confirms the pattern | Breakout below the resistance level confirms the pattern |
How Can Traders Use These Patterns?
This pattern can be used as an add on to your advanced technical analysis of demand and supply aligned with price action.
For instance, when you identify an excellent supply zone and it aligns perfectly with double top pattern, then you get the green signal for short trade.
Same can be considered in the case of finding a good demand zone and if it aligns with double bottom pattern, then it is a green signal for long trade. In both cases, volume confirmation and market context are crucial to validate the patterns and enhance the likelihood of a successful trade.
Trading in Double Top Pattern
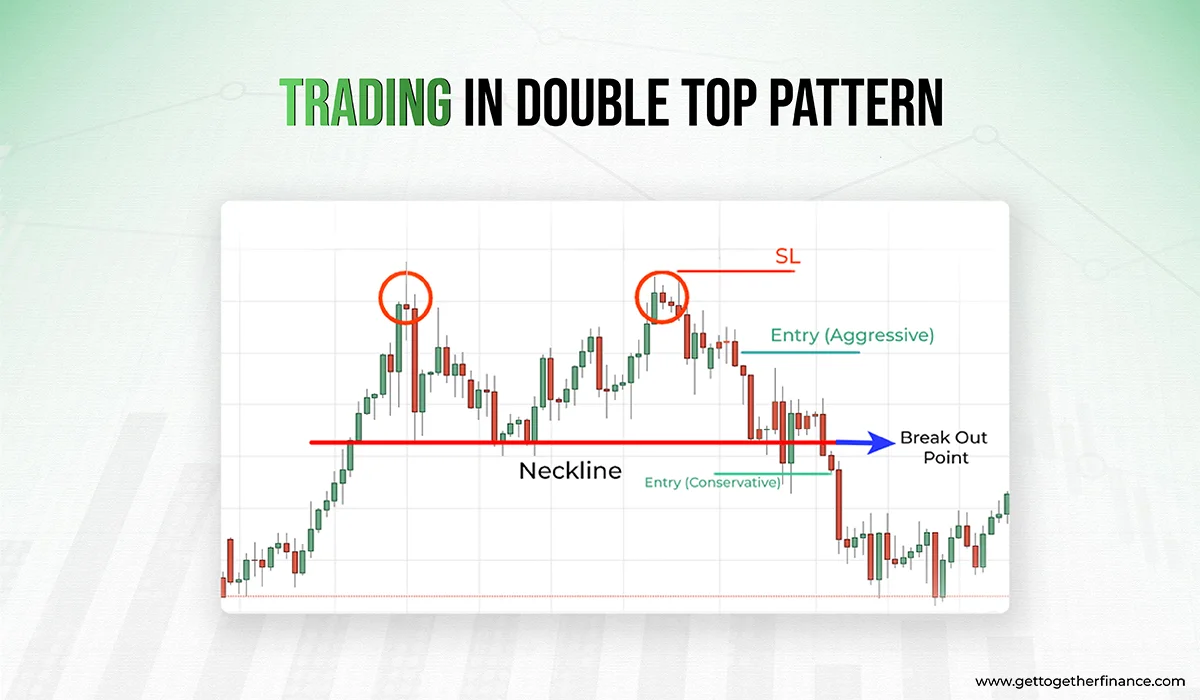
Trading in the double top is done by short-selling the stock. This is because the double top pattern signals the start of a downtrend leading to a fall in prices.
Before you start to trade, analyze the pattern well with the technical analysis. You can also take the help of indicators like RSI and MACD as an add-on for confirmation of the pattern.
As you know, the double top pattern is formed in an uptrend and resembles the “M” shape. Aggressive traders tend to take entry into the trade when the downtrend starts after the formation’s second peak. Whereas, the conservative traders wait for the downtrend to reach the breakout point. The breakout point is at the support level or the neckline. Traders who want to play it trade conservatively, take entry into the trade at the support level and enjoy the downtrend.
In the end, when the trend starts to reverse after the price falls down, an exit in the trade can be taken. At this point, traders buy the stock and book profits after exiting the short position.
Be Cautious: Unlike derivatives, short trades in the equity cannot be carried forward, only intraday day can be done. So plan your trades accordingly in this scenario.
Trading in Double Bottom Pattern
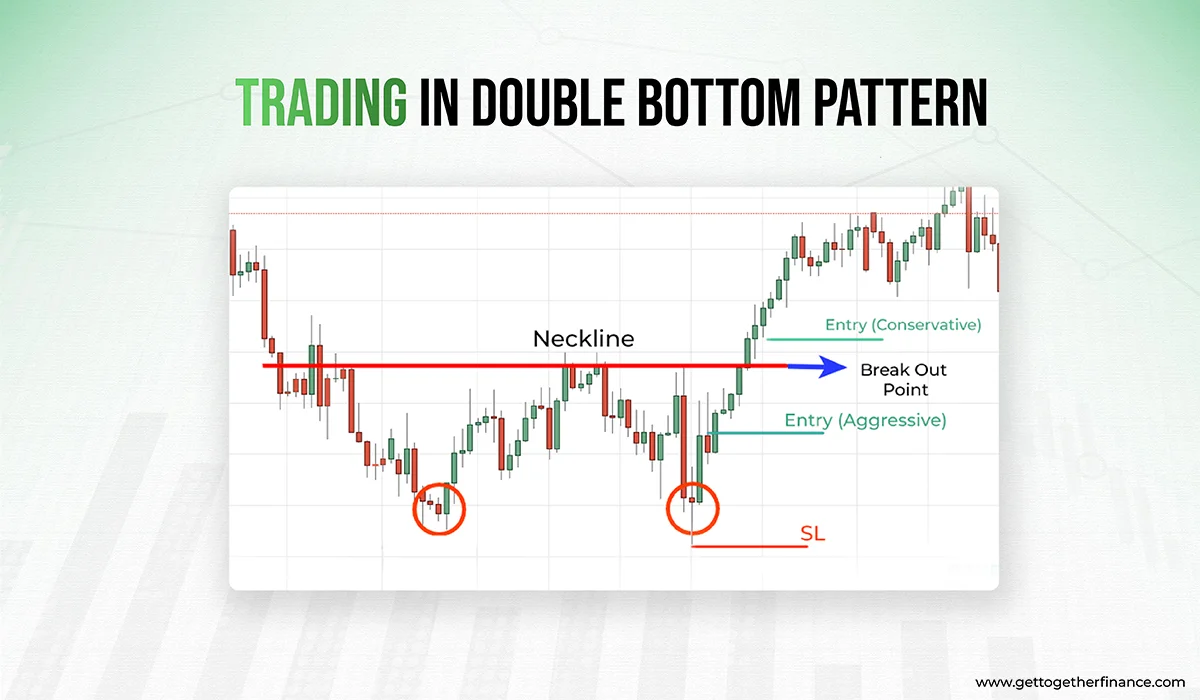
Trading in the double bottom is done by buying the stock at the dip. This is because the double bottom pattern signals the start of an uptrend and the end of the downtrend leading to an increase in the prices.
Before you start to trade, analyze the pattern well with the technical analysis. You can also take the help of indicators like RSI and MACD as an add-on for confirmation of the pattern.
As you know, the double bottom pattern is formed in a downtrend and resembles the “W” shape. Aggressive traders tend to take entry into the trade when the uptrend starts after the formation’s second bottom of “W”. Whereas, conservative traders wait for the uptrend to reach the breakout point. The breakout point is at the resistance level also called the neckline.
In the end, when the trend starts to reverse after the price has increased to a point, an exit in the trade can be taken. At this point, traders sell the stock and book profits.
Top Mistake Traders Make with Double Top and Double Bottom Patterns

These mistakes are:
- Entering too early.
- Ignoring volume confirmation.
- Disregarding the preceding trend.
- Expecting perfect symmetry.
- Improper stop-loss placement.
Examples of Double Top and Double Bottom Patterns in Real Markets

The double top pattern of Tata Motors was formed on the weekly chart in late 2016, which includes two highs of Rs 540-550. The first peak was made in 2016, which decreases to the neckline. The second peak was formed in 2017 with the same height. This pattern was a bearish reversal as the price went beyond the neckline.
The double bottom pattern of Tata Motors took place during March/April 2020. The stock price decreased to Rs 60-65, went upward to the neckline of Rs 110-120, and then again reduced to Rs 70-75. The price crossed the neckline, which confirms a bullish reversal.
Limitation of Double Top and Double Bottom
Although, double-top and double-bottom patterns have helped traders in recognizing the possible trend reversal for a long time. There are still some limitations in the pattern. The pattern is quite common in the candlestick charts and is seen often. But, it is not always reliable. For the higher probability of trades to be successful, one should check whether the pattern is forming the demand and supply zones which are commonly known as support or resistance.
Using these patterns with knowledge of Demand and Supply theory lowers the risk of trapping. If the breakout point of the double top pattern falls in the supply zone then only the pattern is said to be more reliable. Otherwise, it may be a false signal. Whereas, in the double bottom pattern, the breakout point should fall in the demand zone, otherwise it is also a false signal.
Conclusion
Finally, double top pattern and double bottom pattern are useful for detecting future trend reversals in financial markets. While these patterns provide insight into market sentiment shifts, traders must also contend with their subjectivity, false signals, and the impact of market noise. Using these patterns in conjunction with other indicators and risk management approaches as part of a holistic trading strategy can improve decision-making and contribute to better informed and profitable trading outcomes.
FAQs
1. How do you trade in double to pattern?
The double top pattern indicates a likely downward movement and potential selling opportunities. You can trade the pattern on the break of the neckline, with the stop loss above the pattern and the profit target the same distance down from the neckline as the pattern’s height.
2. Can a double top pattern be bullish?
A double top pattern with a ‘M’ form signals a bearish reversal in the trend. A double bottom pattern with a ‘W’ form indicates a bullish price movement.
3. What is double bottom pattern at the top?
A double bottom pattern is the inverse of a double top pattern and is a bullish reversal pattern. The stock price will reach a high point before retracing to a level of resistance. It will then produce another peak before reversing from the current trend.
4. Is double top pattern a buy or sell?
A double top pattern indicates the end of an uptrend. As a result, if the market develops a double top, exit long positions (buy) before prices collapse. You can also go short (sell) to profit from the market’s downturn.
If you’re ready to explore the stock market like a Pro, we’ve got one of the most reliable technique for you – Learn more


