MACD Indicator : ( Moving Average Convergence/Divergence )
- Updated on : May 23, 2026
- 4917 Views
- by Arun Singh Tanwar

 Facebook
 Instagram
 Youtube
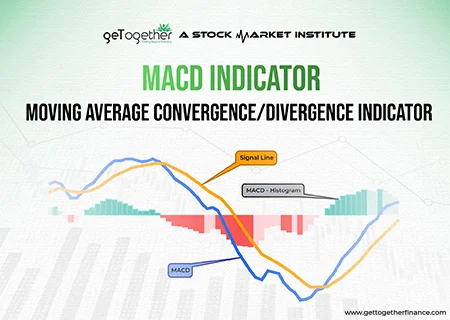
The stock prices are controlled by the demand-supply forces, we all know this. But, is that enough to analyze the candlestick charts? Well.. the answer is CERTAINLY NOT. There are several indicators that can help traders in enhancing their technical analysis for a better understanding of candlestick chart patterns. One such pattern is the MACD indicator (Moving Average Convergence/Divergence).
The MACD indicator helps traders in forecasting whether the investment of the stock will go up or go down in a certain time period. Indicators works as an add-on for confirmation in recognizing certain chart patterns. Followingly, they help traders in knowing when to take entry and exit in the trade.
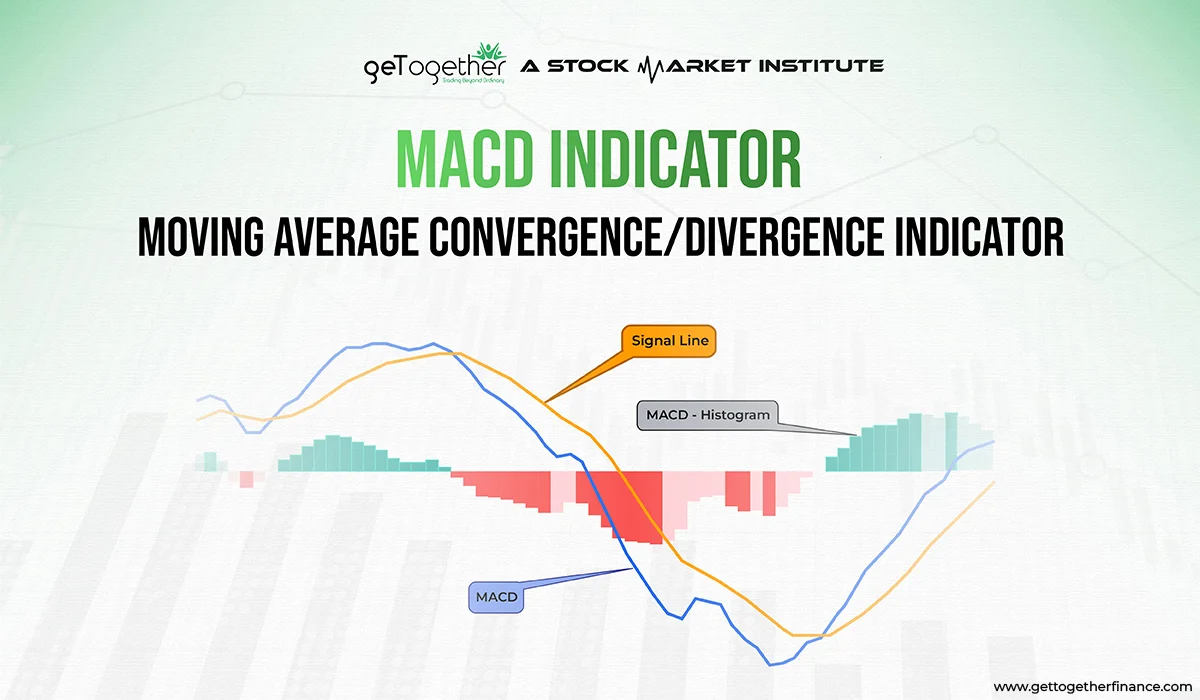
What is MACD Indicator?
What is a MACD Indicator?
MACD indicator also known as Moving Average Convergence/Divergence is an important tool for traders to depict when the trend reversal is going to happen. It works as a confirmation add-on for traders on their technical chart analysis.
The MACD indicator is formed of two different moving averages, 12 MA and 26 MA. The moving average is the average closing price of the past 12 candles and 26 candles respectively.
The trend reversal in the candlestick chart can be easily forecasted with the help of the MACD indicator.
The 12 MA is also known as the fast line and the 26 MA is also known as the slow line. These lines move simultaneously on the MACD chart to help traders in catching the momentum of trend reversals in the candlestick chart.
There is no set criterion to decide the number of candles for the MACD chart. The default format for lines of moving averages is 12 and 26. But, it can be adjusted according to the knowledge and needs of traders.
Also Read : Types of stock market indicators
MACD vs Relative Strength
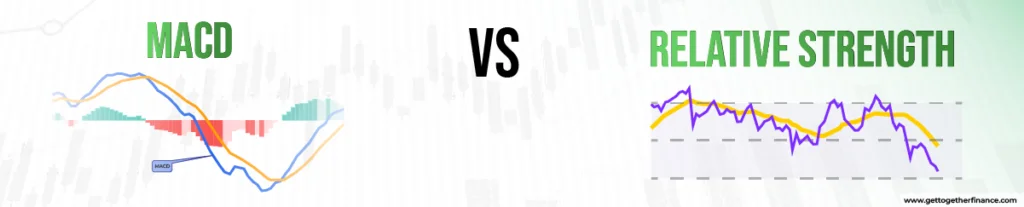
Relative Strength and MACD (Moving Average Divergence/Convergence), both are indicator tools used for technical analysis. One is used to know the speed and change of price movement, where the other is used to spot the potential price reversal. Here let’s divide the difference on the grounds of factors to understand in simple way:
| Aspect | MACD (Moving Average Convergence Divergence) | Relative Strength (RSI) |
| Type | Momentum Indicator | Oscillator |
| Purpose | Identifying trend direction and momentum | Indicating potential overbought or oversold levels |
| Components | MACD line, Signal line, Histogram | Single line (RSI line) |
| Interpretation | MACD line crossing signal line indicates trends | Above 70 suggests potential overbought conditions; below 30 indicates potential oversold conditions |
| Range | No fixed range; values can be positive or negative | Ranges from 0 to 100 |
| Signals | Crossovers and Histogram changes | Overbought and Oversold conditions |
| Timeframe | Suitable for various timeframes | Generally used for shorter-term analysis |
How do you calculate the MACD?
MACD is a wonderful tool to predict the potential uptrend or downtrend of price, despite the candlestick chart view. But how do we calculate MACD? Here let’s us give you a gist:
- Take 12 MA of the price.
- Take 26 MA of the price.
- Subtract sum of 26 MA from the 12 MA for the MACD line.
In case the 12 MA (fast line) crosses 26 MA (slow line) from the above, intersecting the negative range below zero line, it means the trend is going down. Contrary, if 12 MA (fast line) crosses the 26 MA (slow line) from below from positive range ranging above zero line, it shows the possibility of upcoming downtrend.
- Calculate 9 MA of the MACD line for a signal line.
- The difference between MACD line and signal line creates MACD Histogram.
What’s left with us is the question, “Why use two moving averages and then use another for the signal line?” Well! The signal line acts like a slower moving average, smoothing the impact of faster MACD lines, leading to precise outcomes.
Also Read: Fibonacci Retracement
How do you interpret the MACD?
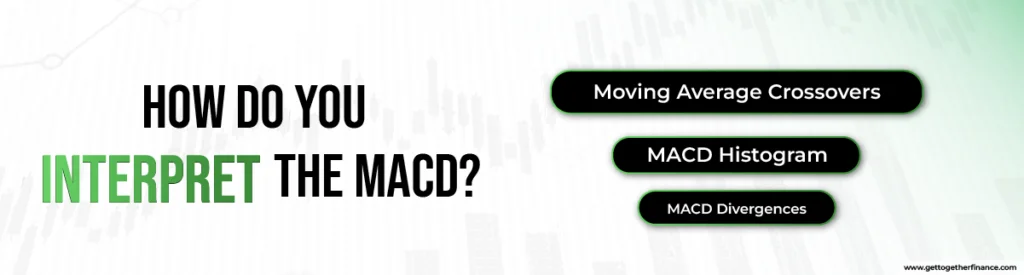
MACD indicators acts as a versatile tool that is commonly interpreted into three ways i.e.
- Moving Average Crossovers:
- MACD Histogram
- MACD Divergences
Let’s get into the details how?
Moving Average Crossovers: Use 12-period MA with 26-period MA to generate the MACD line. If the 12 MA line crosses 26 MA from above in the positive range of zero, it means the trend might reverse and take a bearish approach. Vice versa, if 12 MA crossed 26 MA from below, ring the bells, because it’s time to book some profit using the uptrend.
MACD Histogram: It is basically the difference between the MACD line and the signal line. If you read the histogram bars going above the zero line, it means that the MACD line is above the signal line. It also signals potential upward momentum in the price. Vice versa, if the bar drops below the zero line, that means the MACD line is below the signal line, showing potential downward momentum. The change in the histogram leaves the remark of potential shift in the price momentum.
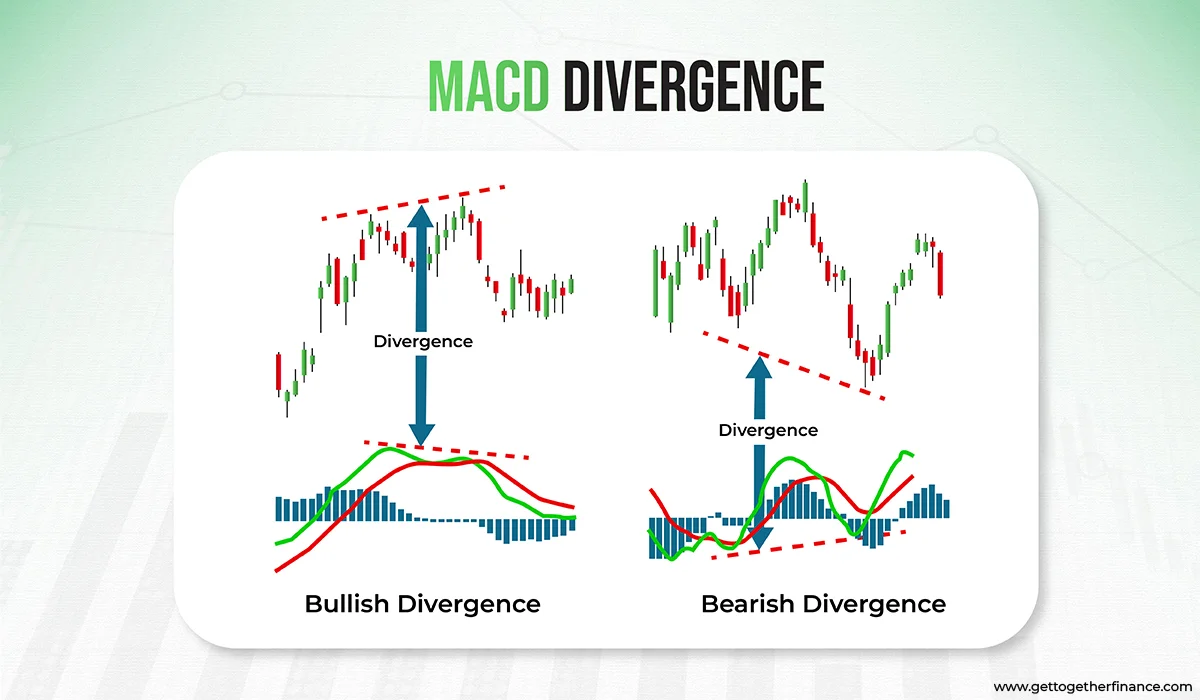
MACD Divergence: When both candlestick chart and MACD indicator go in opposite directions, there’s your alert of divergence. When price makes red candles consistently, but the MACD indicator makes higher lows, it’s a sign of potential upward reversal and bullish divergence. Conversely, bearish divergence happens when the candlestick goes green after green in color, but MACD makes lower highs in candles. Traders use MACD divergence to anticipate trend reversal.
Every trader read the charts as per their personal preference, however all the methods offer the same accuracy with a tweak in the outcome. The MACD indicator is not completely reliable and can trap you thinking of a trend reversal. It is considered as a back-up tool to complement your research of demand and supply theory for an added accuracy.
Interpretation of MACD Indicator:
MACD indicator helps in forecasting whether the price of the stock is going to experience an uptrend or a downtrend. It can be interpreted as:
Buy Sign: When the 12 MA (fast line) crosses the 26 MA (slow line) from below in the negative range that is below the zero line of the MACD chart then the uptrend is possible. But this can also trap you. So using this crossover while the price is in the support zone or the demand zone of the candlestick chart, makes the uptrend highly probable and reduces the chance of trapping.
Sell Sign: When the 12 MA (fast line) crosses the 26 MA (slow line) from above in the positive range that is above the zero line of the MACD chart then the downtrend is possible. But this can also trap you. So using this crossover while the price is in the resistance or the support zone of the candlestick chart, makes the downtrend highly probable and reduces the chance of trapping.
Divergence in MACD Indicator:
The divergence in MACD occurs when the momentum of candlestick charts and the MACD graph do not match. There are times when you can see a powerful downtrend in the candlestick chart. At the same time, the MACD chart may not see a downtrend similar to the candlestick chart. This is a secret sign that the situation might not be as bad as it seems in the candlestick chart. This situation is called divergence.
The same can happen in a strong uptrend. Leading to the false signal of buying the stock. But, if MACD does not match the candlestick chart, then there is a high chance that the uptrend might not be as strong as it seems. The price might start falling soon in this condition, leading to a downtrend.
Let’s take a look at this illustration. Here, in the candlestick chart, you can see an uptrend with rising resistance zones. But, comparing the MACD chart at the same price range shows the price movement downwards.
In the candlestick chart, the first high is lower than the second high. Whereas, in the MACD chart, the second high is lower than the first high.
Here, the MACD charts contradict the price movement in the candlestick chart. This situation gives a hint to the traders that something is fishy and the uptrend might not last long. This whole situation is termed as divergence when the momentum of the price is different in the candlestick chart compared to the MACD chart.
Example of MACD Crossovers
If the MACD indicator drops below the signal line, it’s your alert to sell your trade. Conversely, if it rises above the signal line, expect an uptrend direction. However, it is highly suggested to conduct MACD indicators with a more foolproof approach such as demand-supply zone study to make nuance informed decisions. Here is an example to understand it in a simpler way through a graph.
Example: Canara Bank
Crossover Price: 382.90 RS
Crossover Date: 28 July 2014
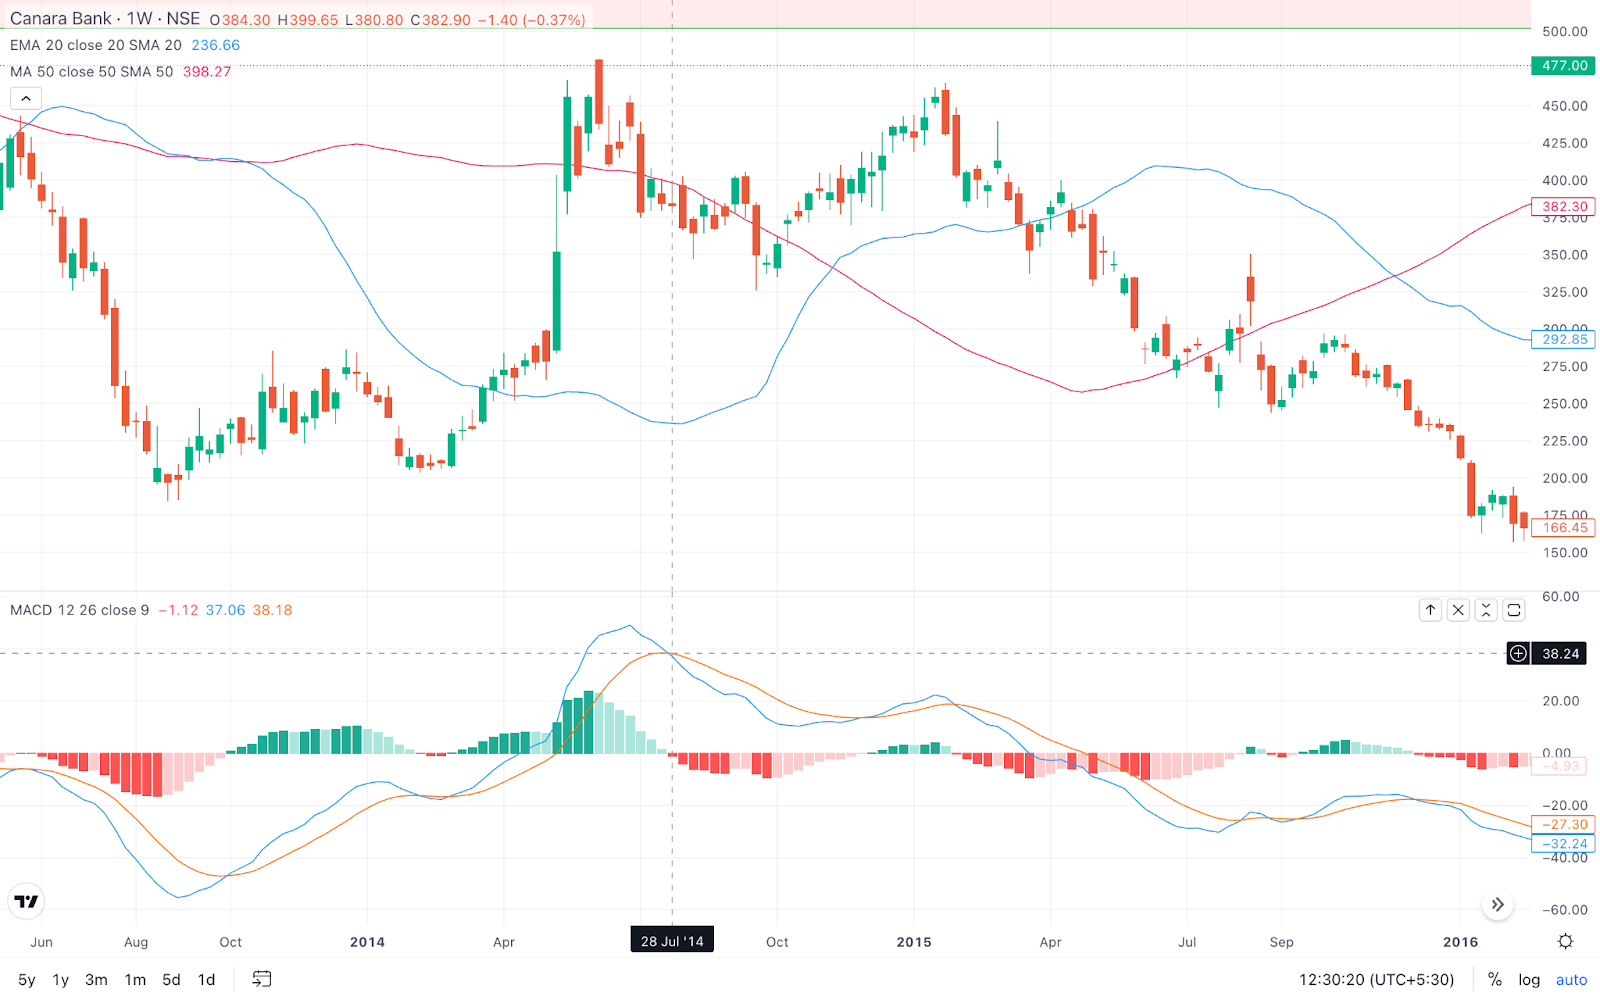
Above graph shows a signal crossover on 28 July 2014, leading to complete reversal of the trend. The formed bearish divergence indicates a long-term bearish trend and downward price direction. However, the trend soon changed its direction again for a while only to go back to bearish mood.
What problems does MACD solve?
MACD (Moving Average Convergence Divergence) is one of the useful tool for technical analysis of stock market, but doesn’t always guarantee the outcome: Here are few problems MACD indicator helps with:
- Spotting Trends: It shows if prices might go up or down by comparing short-term and long-term averages.
- Checking Momentum: MACD helps see how fast prices are changing, indicating the strength of the trend.
- Decision Signals: It helps decide when to think about buying or selling based on crossovers and patterns.
- Detecting Changes: MACD also spots changes in direction that might not be clear by just looking at prices.
So, MACD is a tool for understanding trends and deciding when to make moves in the stock market. But it’s crucial to know that the MACD indicator alone doesn’t solve all the problems of traders and has few setbacks.
What Do Critics Say
Common False-Vergence
One of the major misconceptions traders have is that MACD divergence is a foolproof approach. Well, falling for this statement could be a trap because it doesn’t guarantee the sale. Often traders find themselves into the trap of bullish MACD divergence, only to find themselves on their face down. Not being able to forecast all reversals is also a following concern along with not being able to predict real price reversals.
SideWays Glitches
The game of sideways markets glitches the MACD system. When the price goes sideways, it pulls back the MACD indicators from extremes. As the price moves in the same direction, the distance between 26 MA and 12 MA shrinks, pushing the indicator toward zero. Hence, every time the price goes in a sideways direction, the MACD indicator always seems to show a divergence. Leading to the essence that the MACD indicator does not work on the choppy or sideways market. Usually it’s just MACD dancing around the zero line, watching MA move back and forth.
The Solution
MACD indicator is a versatile tool for gauging trend reversal, it’s only one piece of the market puzzle. To make informed decisions, for robust research use it with demand-supply zones, fundamental analysis, and complementary indicators.
How does MACD work?
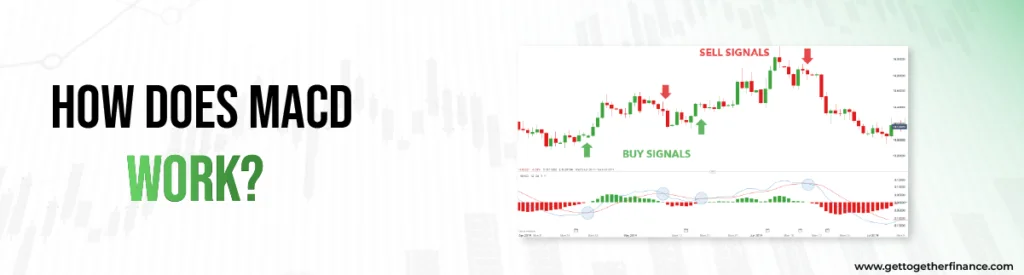
MACD works by reading the difference between two moving averages of different time periods. Often the best value is considered 12 MA and 26 MA, to read short term and another long term price movement. The final difference value helps plot the MACD line, which moves back and forth to zero.
If the fast line (12 MA) crosses the slow line (26 MA) from above, it signifies a bearish (downward) trend. If the fast line (12) joins the slow line from below then it’s time when you ask, “Did someone say trend is going up.”
MACD can create a false trap of the price up move and lead to a great loss, if playing with big money is your take. Use demand and supply zones to strengthen your market research and compliment your theory with MACD indicator to add a bit of evidence from a different view.
For precise trading signals, generate the MACD signal line of MACD, a kind-day EMA of the MACD line. When the signal line intersects the MACD line, it acts like the trigger for buy and sell decisions. It is also helpful to know divergence points between the price and the indicator, showing the trend reversal.
Limitations of MACD:
Though MACD is an excellent indicator, it still has some limitations:
- MACD can only live up to the short-term expectation. It is not competent enough to provide data for long-term calls.
- MACD is solely based on the price movement of the stock. It does not take other factors into account like volume, external news etc.
- Relying solely on the crossovers on the MACD chart from trend reversal make traders miss an opportunity. There are times when a reverse trend can be seen in the candlestick chart without MACD crossover.
MACD Formula:

Conclusion
In the volatile world of trading, the MACD indicator is a flexible instrument that provides insights into price patterns and momentum. While it is quite useful for assessing prospective buy and sell signals, it is critical to understand its limitations. To achieve effective trading, combine MACD with other indicators and methods, resulting in a comprehensive approach that balances its strengths and shortcomings. As traders grasp the discipline of analyzing MACD, it becomes a valuable tool in their armory, directing decisions based on a greater understanding of market dynamics.
FAQs
What does the MACD indicate in trading?
MACD indicators are a useful tool to forecast the point of trend reversal. In simple terms, it tells the story of potential areas from where the price is going to a reversal trend. The whole concept helps traders decode whether security is oversold or overbought. Traders can use this as an add-on tool to identify the price reversal point with their research.
What is the difference between signal line crossover and centerline crossover in MACD?
A crossover happens when the 12 MA line crosses the 26 MA line, but there is just a fine difference. If the MACD line goes up and crosses above the signal line, it’s known as Signal Crossover aka bullish crossover. On the other hand, if the MACD goes down and crosses the signal line from below, it is called Centerline Crossover, aka bearish crossover.
Can the MACD be used to identify overbought and oversold levels?
Yes! The distance between MACD line and Zero line helps detect whether a share is oversold or overbought. It helps traders or investors whether to make a purchase or trade in the market.
Can MACD value be compared for different securities?
Yes, you can use MACD values to compare across different securities. While the actual numbers might be different for each stock (because they have different prices), you can still use MACD to see if stocks are moving in similar or different ways.
What is the best moving average to use with MACD?
There is no certain criteria of moving average value for MACD. But the most popular ones are 12 and 26. Some people prefer shorter ones for a quick view, while others like longer ones for a distant view. Default is the best recommended by experts, hey, it’s about finding what works best for you, right?
What is the best setting for a MACD indicator?
Suit yourself! Yes, since there is no criteria for the number of candles in MACD, the “default” is considered the best setting. In default, 12 MA and 26 MA is used to understand the trend and its crossover as the reversal point.
How do you use EMA and MACD?
EMA smoothens the price data and helps in spotting trends. Whereas MACD uses signals and crossovers to spot potential buy and sell signals.
How do you find divergence with MACD?
Divergence of MACD is the rebel that goes onto its own path, despite the direction the stock price’s select. That means, if the candlestick pattern and MACD chart pattern don’t seem to tell the same story, it’s the time when you should assume the other potential outcome too.
What is a good MACD value?
There is no universally "good" or "bad" MACD value; it’s more about decoding the strength and direction of the trend for a specific asset or stock. People use divergences, MACD histograms to measure the value and make more nuanced decisions.
How do you use the MACD indicator?
Traders use the MACD’s lines to identify when the uptrend or downtrend is going to start based on the price movements of the stock.
Is MACD a good indicator?
One of the most prevalent technical indicators is the moving average convergence divergence (MACD) oscillator. The MACD exhibits the adaptability and multifunctionality that traders want, with characteristics of both uptrend and downtrend indicators, as well as a moving average.
As MACD Indicator, traders also use RSI Indicator to enhance their trading accuracy. You can read more about the RSI Indicator – here


