RSI Indicator : ( Relative Strength Index )
- Updated on : May 23, 2026
- 4134 Views
- by Arun Singh Tanwar

 Facebook
 Instagram
 Youtube
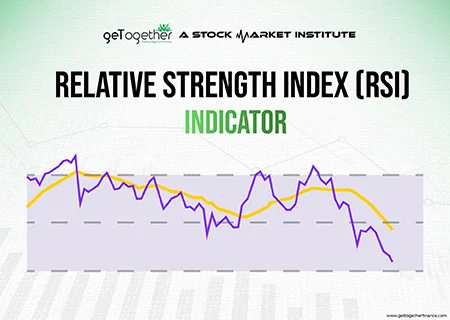
Overview
“Ups and Downs are part of our lives and part of the stock’s life too.” It is a well-known fact that the stock market is extremely volatile and dynamic. In the market, Relative Strength Index Indicators (RSI indicator) are used to measure the volatility in a particular stock’s price. The purpose of RSI indicator is to measure the recent price changes of particular stocks on a scale of 100.
This further helps traders or investors in making informed trading decisions. It is like the media of a particular stock, as it takes full notes of ups and downs. Further, it compares the price of a stock in both uptrend and downtrend, thus helping traders in forecasting the future movement of the stock.
Role of RSI Indicator:

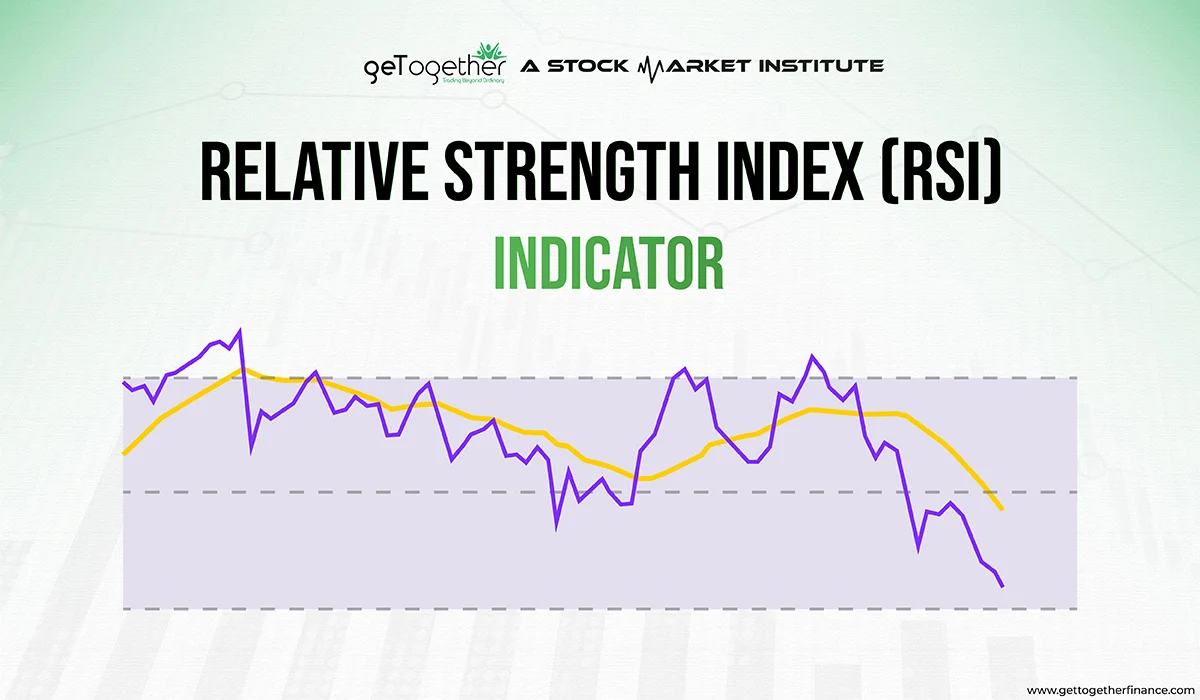
RSI Indicator help in keeping track of price fluctuations and price trends of a stock on a graph of scale 1-100. The graph of this indicator helps immensely in identifying market sentiments and trends. They help significantly in determining the strength of price trends and points of reversal. Thus, known as momentum oscillators or momentum indicators. Momentum oscillators help in studying the speed or frequency at which the price is changing or fluctuating.
The prime role of RSI indicator is to help traders in analyzing overbought and oversold situations. It also indicates the reversal of trends and a corrective pullback in the price of the stock.
RSI is a useful tool in technical analysis, with appropriate analytical skills traders can know when to sell or buy the stock. As said the RSI indicator measures price on a scale of 1-100. When the RSI is near 30 or below, it indicates the situation when the stock is oversold. Whereas when the RSI is near 70 or above, it indicates the situation when the stock is overbought.
How the RSI works?

The RSI tends to compare a security’s strength on days when prices go up to its strength on days when prices go down. As a momentum indicator, RSI relates the comparison to the price action which gives proper signals to the traders and make informed decisions.
Why is RSI important?

- To predict the price formation in a security.
- Help traders validate trend and trend reversals.
- Analyze overbought and oversold securities.
- Provides insights about buy and sell signals.
RSI Ranges

Bullish Range: 40-80
Bearish Range: 20-60
Overbought Zone: 70-100
Oversold Zone: 0-30
50 is the midline or the neutral point that divides the bullish and bearish momentum.
RSI Swing Rejections

RSI Swing Rejection is a unique strategy that identifies potential reversals. It focuses on price failing to surpass certain RSI levels and then reversing direction.
Bullish Swing Rejection: RSI enters the oversold zone, moves back above 30, pulls back but stays above 30 and breaks at the recent high.
Bearish Swing Rejection: RSI enters overbought zone, moves back below 70, pulls back but stays below 70 and breaks the recent low.
Interpretation of RSI Indicator:

- RSI makes it easy to spot the support and resistance zone in the candlestick chart of the stock. Many traders find it difficult to find patterns like a double top, or double bottom in the chart. Whereas, taking help from RSI Indicator makes it easier.
- There are times when a new high or low is seen on the candlestick chart but it is not detected in its RSI index. This is called divergence and it often signals a reversal in price trend.
- If the RSI of a stock makes a smaller high and then drops below the previous low, then a downtrend is expected. This is called the Top Swing Failure.
- If the RSI of a stock makes a higher low and then the price goes above the previous high, then the uptrend is expected. This is called the Bottom Swing Failure.
Overbought and Oversold Level:
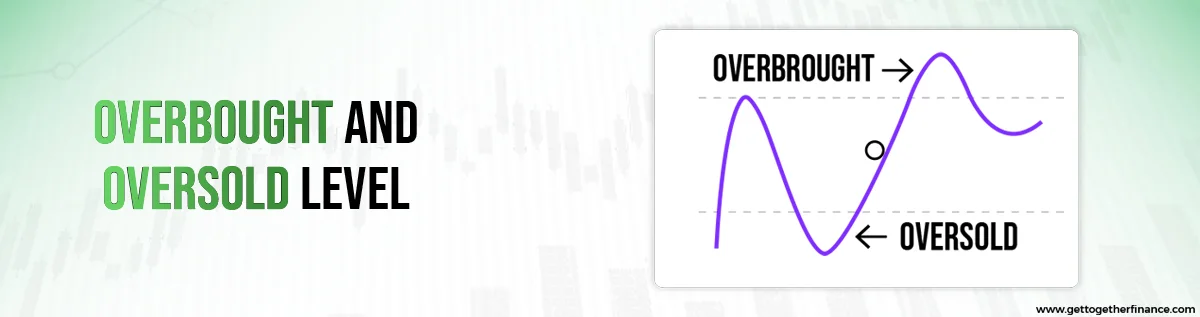
Overbought and oversold levels indicate the unfair price as compared to the intrinsic value of the stock.
Overbought level is when the trade value of the stock is above its fair and intrinsic value, it results in an unnecessarily high price of the stock. In this condition, the RSI of the stock is above 70. This often helps traders in forecasting reversal in an uptrend. Thus, they tend to sell the stock.
An oversold level is when the trade value of the stock is below its fair and intrinsic value, it results in an unnecessarily low price of the stock. In this condition, the RSI of the stock is below 30. This often helps traders in forecasting reversal in a downtrend. Thus, they tend to buy the stock.
Hence, RSI can be a bullish indicator when it is oscillating on or below the level of 30. Whereas, it is considered a bearish indicator when it is oscillating on or above the level of 70.
Note: During strong trends, the RSI may remain oversold or overbought for longer than expected. A trader needs to have patience in such a situation to make profits out of it.
Also Read: Bollinger Bands
What is Divergence?
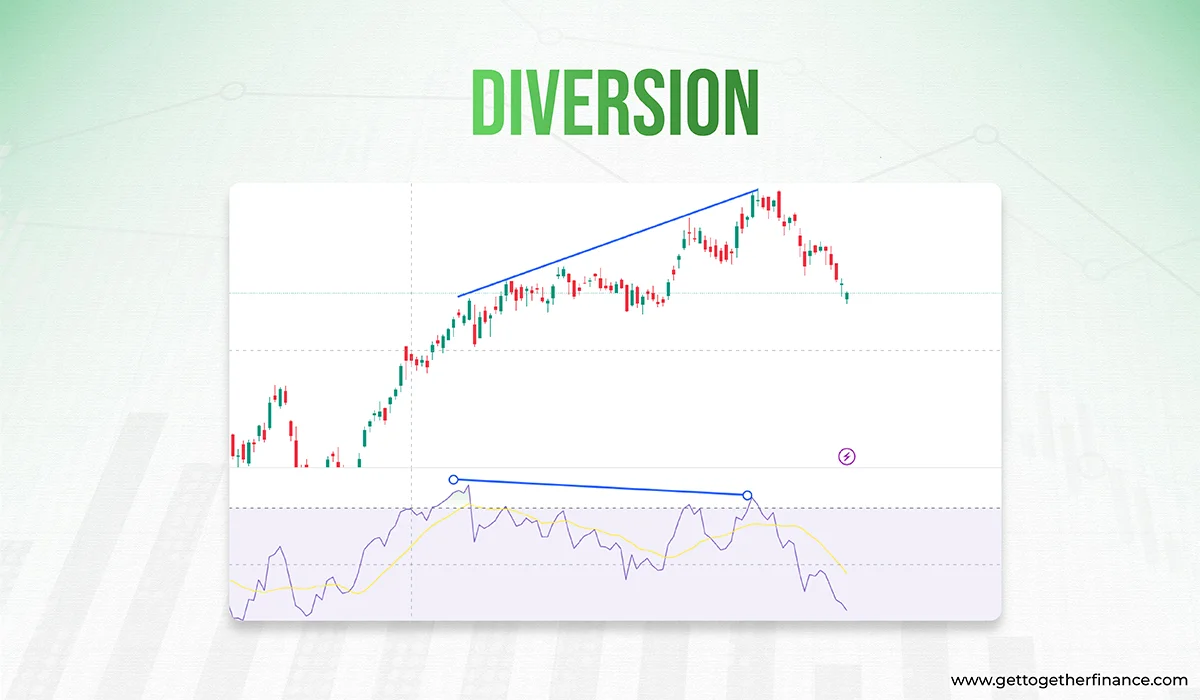
In earlier times, people used to identify the accurate support and resistance zones with the help of RSI. But as time passed, it gained popularity among traders and started trapping them by giving false signals.
That’s when people understood the concept of divergence. Times when consecutive highs and lows are not formed similar to the RSI chart compared to the candlestick chart. Meaning, it is not necessary if the price is going from A (low point) to B (high point) in the price chart then similar will be with its RSI index.
Often the price goes down in RSI despite the rise in its price chart. This indicates the reverse trend. Or vice versa in case of a downtrend.
Suppose the price goes down 15 then to 10 and then to 5. But in the RSI after 10 the downtrend stops. This is called divergence. This signals the start of the uptrend in the candlestick chart. Vice versa happens in the downtrend.
RSI in Different Market Types/Timeframes

The power of the RSI indicator lies in its versatility, but its interpretation must change based on the market environment.
Performance in Trending vs. Range-Bound Markets
- Range-Bound Markets (Sideways): RSI is highly reliable in range-bound markets. The standard 70/30 zones work best, predicting predictable price bounces.
- Strongly Trending Markets: In a strong uptrend, the RSI indicator may stay above 70 for prolonged periods without reversing. Traders must be cautious about blindly selling in these conditions.
Reliability Across Different Timeframes
- Daily/Weekly Charts: RSI trading signals are generally considered most reliable on higher timeframes (Daily or Weekly). Divergence spotted on these charts carries significant weight.
- Intraday Charts (e.g., 5-minute): The relative strength index is more prone to noise and false signals on short-term charts. Intraday traders must use RSI alongside confirmation tools like volume.
What Traders Often Get Wrong?

The single biggest mistake traders make is treating the RSI indicator as a definitive signal based solely on the 70/30 line.
When RSI Fails? The False Signal Trap
This is the primary scenario for when RSI fails.
- The Error: Selling short simply because the RSI crossed 70 in a strong, sustained uptrend.
- The Reality: The price continues to climb (sometimes reaching 80 or 90) while the trader is trapped in a short position.
- The Solution: Never trade the indicator in isolation. An RSI below 30 is only a high-probability buy setup if the stock price is also at a major Demand Zone (support level). Always confirm the RSI signal with price action.
Trader Note: The RSI is best used as a confirmation tool for existing support and resistance zones, not as a standalone entry trigger. The true strength of the indicator lies in spotting RSI divergence, which is a leading indicator.
Limitations of RSI Indicator:
Compared to all indicators RSI is one of the most reliable indicators for traders. But, in the past few years, RSI has become a prominent indicator and thus a lot of trapping in false signals has increased significantly. Be it short-term trends or long-term trends, both can be easily interpreted. A trader needs to learn the whole technical analysis well before making any move. Along with the good signal, there are also some false signals.
To identify and avoid trapping and make a profitable move in trade, traders need knowledge about technical analysis that can help them utilize the RSI Indicator as an add-on to advanced knowledge of technical analysis. Our trading in the zone course can surely help you out, you can be an advanced-level trader with top-notch knowledge about technical analysis. Further, you can learn to filter the positive signal from the false positive signal.
Be Cautious: Though the RSI frequently comes into the range of 30 or below, many times it is a false alarm for the bulls. Whereas it is a high-probability setup when RSI is at 30 or below and the price of the stock is also in the demand zone. Vice-versa applies to the supply zone.
Calculation of RSI Indicator:
Two part calculation is used in this indicator:
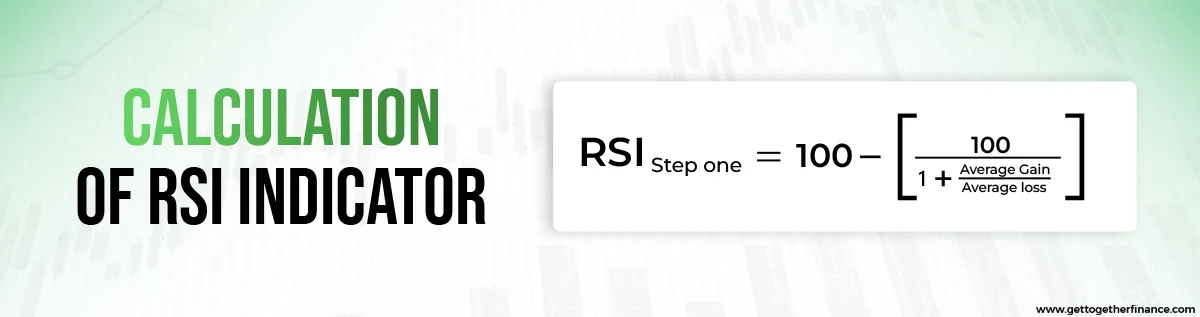
With the help of this formula, traders can get an accurate RSI index for a specific look-back or time period. For this calculation, we need to find the average percentage gain or loss for a specific period. Also, in this calculation, no negative value is taken, losses are also taken in the positive value.
With the help of this formula, traders get a simplified RSI indicator of stocks, which helps in making informed trading decisions. It can be seen that calculating is a long method, obviously, we can’t do it every time we analyze the chart. So, choose a broker that provides accurate RSI data along with charts. Many online brokers provide data of RSI Indicator on charts for traders to make fast-paced decisions. It can be plotted beneath the price chart for a better understanding.
Conclusion
The Relative Strength Index (RSI Indicator) is a versatile and effective tool that provides useful insights into stock price momentum. It also helps in detecting potential trend reversal. Traders and investors can identify overbought and oversold levels, as well as divergence patterns that forecast prospective price changes, by analyzing the RSI. Whether you’re a novice trader or a veteran market player, including the RSI in your technical analysis toolkit will help you make better decisions.
FAQs
Q. How do you interpret RSI Values?
A. When the RSI indicator on the RSI chart reaches 30, it is a bullish sign; when it crosses 70, it is a bearish sign. In other words, RSI levels of 70 or higher suggest that a stock is becoming overbought or overvalued. On the other hand, RSI values of 30 or lower can suggest that a stock is being oversold or undervalued.
Q. What is a good RSI level to buy stocks?
A. A good RSI level for stocks is when it is at 30 or below. Generally, the downtrend is expected to reverse at these positions.
Q. What does RSI 14 mean?
A. The RSI indicator’s default RSI value is 14 periods. That is, the indicator is derived using the price chart’s latest 14 candles or bars. Using a lower interval, such as 5 periods, will lead the RSI to hit extreme levels (above or below 30) more frequently.


