BOLLINGER BANDS
- Updated on : May 23, 2026
- 4273 Views
- by Arun Singh Tanwar

 Facebook
 Instagram
 Youtube
Overview
A famous Greek mathematician Archimedes once said that with a long enough lever and a place to put it, he could move the world. Same with trading in the stock market, Bollinger Bands act like the lever- a vital trading indicator that can highly affect your financial outcome. But the question is what exactly are Bollinger Band, and how do they work?
By having a good understanding and using Bollinger Bands, you can access valuable information that will help you in making a better trading decision.
So let’s have a tour of trading in the stock market with Bollinger Band.
What Are Bollinger Bands?
John Bollinger founded the Bollinger Bands concept in the era of 1980s. It is a set of trend lines that are plotted two standard deviations away from the simple moving average (S.M.A)for a stock’s price.
By showing you the upper and lower limits of ‘normal’ price movements. It helps you navigate price direction, just like a teacher helping students in their toughest exams.
Bollinger Bands USP is their adaptable nature. They tend to expand when volatility or unsteadiness increases and shrink or contract when it decreases. reflecting the ups and downs of the market.
They aren’t just usual lines on the chart. They are the significant trading indicator of the market which captures key features of successful trading strategies like market volatility, rhythm, and range. This helps traders anticipate market movement and make decisions based on statistical analysis.
How Bollinger Bands Are Formed?
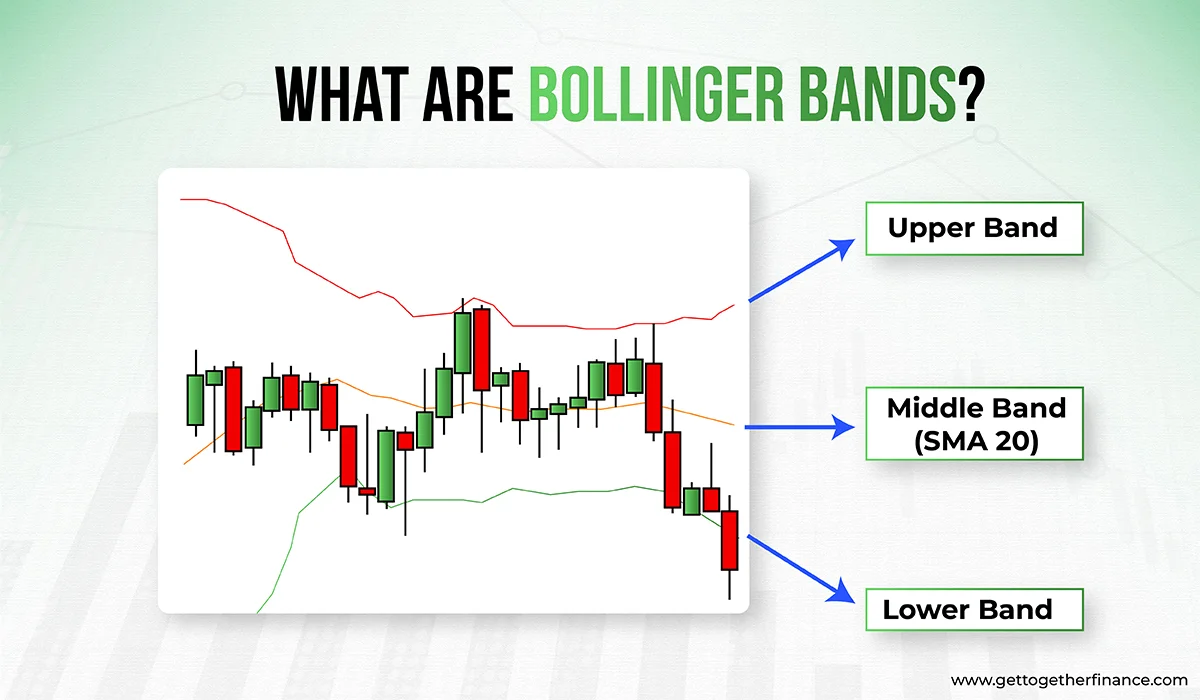
Basically, Bollinger Bands are made up of three core elements that work together, The simple moving average (SMA), upper band, and lower band.
The simple moving average is the heartbeat of Bollinger Bands. it can be calculated by calculating the average closing price of the candle for a set number of time periods. For example, the average closing price of the last 20 candles would be the SMA of those 20 days.
This leads to the formation of the middle band which serves as a reference point for the upper and lower bands. The Upper and Lower Bands are located two standard deviations away from the simple moving average.
But why only two standard deviations away? Statistically 95% of the price section Would fall in this range only, Just like water tides marking their boundaries of price movement Our highs and lows. When a price tends to touch across these bands. It signals that the market is making an evident move.
Understanding the formation of Bollinger Bands. How are they formed? What do they do? How do they work? Will give you a deeper insight into what they are telling you Which will help you in navigating through your Trading journey.
Also Read: MACD Indicator
The Squeeze
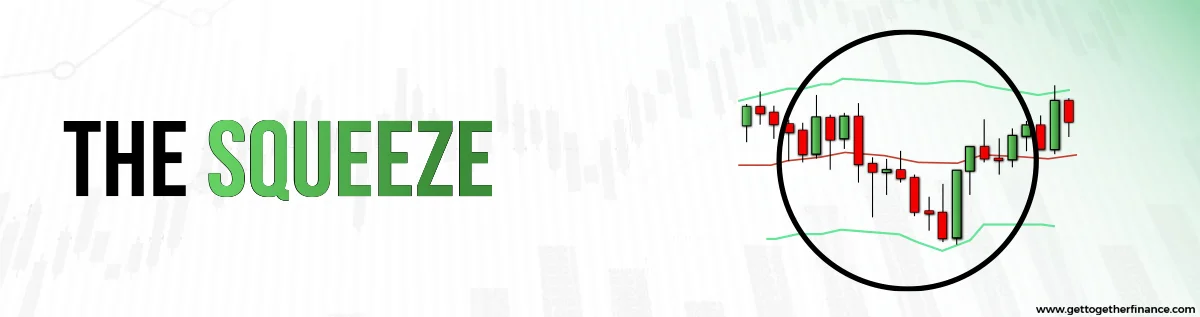
The Squeeze is one of the major concepts of Bollinger Bands. When the bands come closer to compressing the moving average it is known as the Squeeze. This signals that there is a consolidation happening in that area where buyers and sellers are fighting and whoever wins the fight, drives the price in their favorable direction. By also giving potential signs of future breakout and trading opportunities for traders.
Bollinger Band POP
Contrary to the wider Bands moving away, it is more likely to see a decrease in volatility with a high chance of the possibility of exiting a trade. But here are things to keep in mind: These conditions are not considered as trading signals as these bands do not indicate when the change will take place or in which direction it will take place. For better understanding, it is recommended to use advanced technical analysis like demand and supply theory.
Breakout
Not precisely, but approximately 80 to 90% of price action can be seen between the two bands. The occurrence of any breakout above or below these bands is very evident and It is not a trading signal!!However, many investors mistakenly took it as a signal to buy or sell.
NOTE: Bollinger Band doesn’t exactly provide any hint of future breakout in any stock or index.
How to use Bollinger Band in trading?
Bollinger Bands is a trading indicator. Which helps the traders in identifying potential buying and selling opportunities. When the price of a stock comes near the upper band. It indicates that the stock is being overbought and might be up for a price correction or reversal. Like a rubber band, when stretched to its limit, the chances of it snapping back increases very much.
And the exact opposite can be seen when the price comes closer to the lower band. And give an indication that this stock is being oversold and could be up for a price bounce just like a spring, ready to bounce back with equal and opposite force as taught in class In Newton’s third law.
“Every action has an Equal and opposite reaction”
However, an experienced trader would never make the mistake of using Bollinger Bands alone as it may lead to false signals. One should always combine Bollinger Bands with other technical trading indicator to make a safe and Sound trading decision.
What are the common mistakes while using Bollinger bands?
The most common mistake while using Bollinger Band is To assume That when the price touches the band, it gives the signal of selling or buying. Which can lead to wrong decisions based on incomplete information. But please keep in mind Bollinger Bands are a technical trading indicator, not a fortune teller. It will provide insight But relying solely on Bollinger Bands Can lead to regret later on.
Another common mistake traders make is over-relying on Bollinger Bands.
Yes, they are amazing tools But it shouldn’t be the only one on which your trading decisions are being made. It’s just like making a house, only with the help of a hammer. It might be a good hammer Or maybe the Hammer of Thor But you would need other tools too to get the job done. Corporating Bollinger Bands with another technical trading indicator is crucial for accurate Trading signals.
And the most crucial one is neglecting the overall trend. Bollinger Bands work, best when used in conjunction with trend analysis. A trader ignoring the trend might end up regretting their decision. In other words, an attempt to buy falling stocks in the hope that they will reverse and bounce back and will give you a good profit can lead to an evident loss if it still remains in the declination phase.
Conclusion
Financial markets can be very difficult and volatile to navigate. Bollinger Bands offers a great deal by being a useful trading indicator and by providing important insights into market volatility and price points to buyers and sellers. By understanding the construction and formation of Bollinger Band one can easily interpret the signals more efficiently. It can be used in various trading strategies such as Bollinger Band Squeeze or Bollinger Band Bounce. One should try and avoid common pitfalls like over-relying on Bollinger Bands, neglecting the overall trend, and using Bollinger Band as a standalone for selling and buying signals.
FAQs
What are Bollinger Bands?
Bollinger Bands is a trading indicator that works on a simple moving average set by two standard deviation lines which helps in identifying potentially overbought or oversold conditions.
How can you use Bollinger Bands?
When the price of stock approaches the upper band it indicates the overbought condition and if it approaches the lower band it indicates the oversold condition.
But it’s not a standalone buy or sell signal and should be used in conjunction with other technical indicator.
What is a Bollinger Band squeeze?
Bollinger Band squeeze denotes that, when the bands come closer to compressing the moving average it is known as the Squeeze. This signals that there is consolidation happening in that area where buyers and sellers are fighting and whoever wins the fight, drives the price in their favorable direction.


