Hammer Candlestick Pattern: Psychology, Confirmation Signals & Trading Guide
- Updated on : May 23, 2026
- 5031 Views
- by Arun Singh Tanwar

 Facebook
 Instagram
 Youtube
A hammer candlestick pattern is formed when the body of the candle is formed upwards with a negligible upper wick; leaving the candle with only a lower wick. The significance of forming this candle lies in the fact that a huge fight between buyers and sellers took place. This fight was refraining from the price of getting in either direction. This leads to the candle closing near the point of its opening price. The hammer candle can either be green or red, but it signifies a great fight between sellers and buyers. Also, the size of the Hammer candlestick pattern’s lower wick is nearly double the size of its body.
What is a Hammer Candlestick Pattern?
A hammer candlestick pattern usually occurs at the bottom of the downtrend, signifying that buyers are taking over the market. After combining with other technical tools, the hammer candlestick pattern at the end of the downtrend is considered to be a strong bullish signal. Whereas, if the hammer candlestick pattern occurs in the uptrends, there are high chances that the trend might continue.
Only the formation of the hammer pattern does not indicate the price reversal in the chart. One should wait after the hammer formation and see the following candle. If the follow-up candle opens and closes above the hammer candle range, then it is a good bullish signal.
Type of Hammer Candlestick Patterns
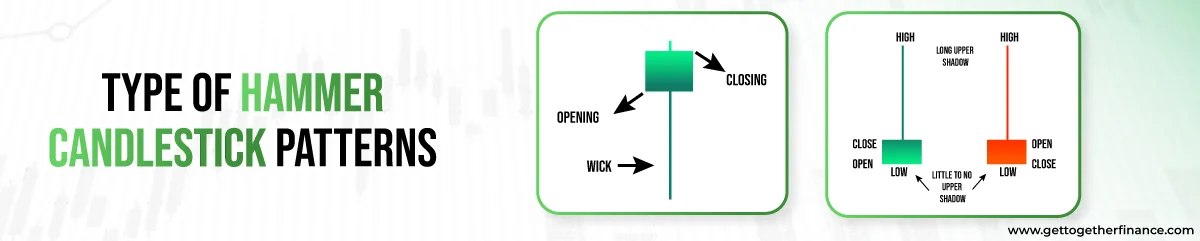
In every candlestick chart we see, on a broader view, we see two types of candles, green and red candles. Whereas, the one who knows the in-depth technical analysis knows how different types of stock market chart patterns lie in the red and green candle. In the hammer candlestick pattern, there are two types. One is the green hammer and the second is the red hammer. However, the structure of both patterns is the same. Still, the green hammer is considered a more powerful signal.
In the green hammer, the closing point is above the opening point. Whereas in the red hammer, the closing point is lower than the opening point. But, both these hammer patterns are considered as a good bullish candlestick pattern.
Apart from the traditional hammer pattern, there is another important hammer pattern named the inverted hammer pattern. This is also a bullish hammer pattern. The structure of the inverted hammer pattern is completely opposite to the hammer pattern. Here, the body of the candle is at the lowest point and it has an extended upper wick. The wick is nearly double the size of the hammer body. An inverted hammer is considered a strong bullish signal because if we look closely at its pattern, it was once a strong green candle but due to unforeseen selling pressure it became a hammer. It signifies that buyers are getting ready to change the momentum of the market.
Inverted Hammer Candlestick Pattern

The inverted hammer candlestick pattern looks exactly the opposite of the traditional hammer pattern. Here, the body of the inverted hammer is at the lower side, having no or negligible place for the lower wick and it has a longer upper wick.
The upper wick is almost double the size of the body of the inverted hammer pattern. The inverted hammer is used as the bearish signal by conventional traders when it is found in the resistance zone. This is because the inverted hammers refrain the price from going up after witnessing a good uptrend it signifies that sellers are now taking over the buyer and trying to bring the price down.
However, with time, this pattern has gone through several modifications by traders’ observations. Now, the inverted hammer is also considered as the bullish signal if it is formed in the support area.
Generally, you can see the inverted hammer pattern frequently in the candlestick chart. But, to trade based on its reliability, consider this pattern when it is formed in the support area after the downtrend. It signifies that the buyers are trying to take the price of the stock up. Hence, the price is struggling to go further down from the support area.
Examples of How to Use a Hammer Candlestick Pattern
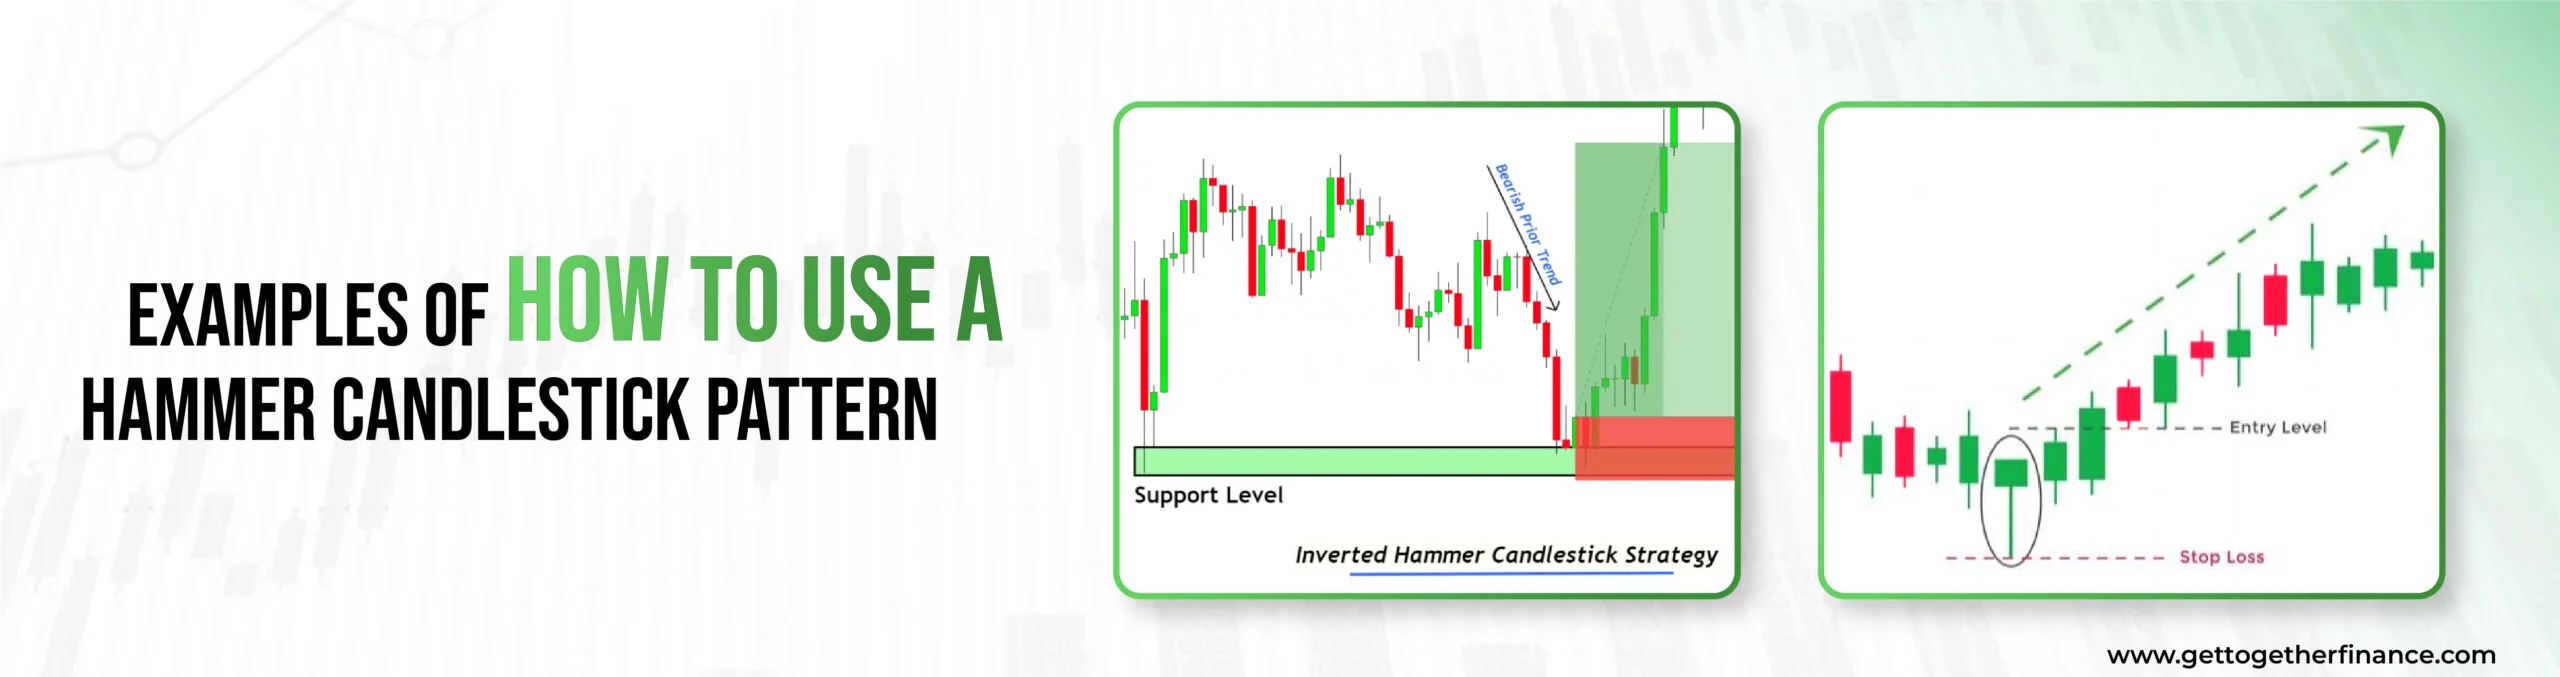
The Hammer Candlestick pattern is used as a reliable bullish signal if it is seen formed in the support zone. If the price is coming down due to heavy selling by making strong red candles, and then if a hammer forms in between, it signifies a bullish trend reversal. This is because the buyers are now trying to reverse the momentum of stock prices and fighting to bring the price up. After the hammer pattern has formed, you can check the follow-up candle and see if it moving in an upward direction. If the follow-up candle goes up, then there are high chance that the hammer pattern has reversed the downtrend. You can trade at this accordingly.
In the above example, you can see the hammer pattern forming after the strong downtrend. This hammer pattern is followed by a strong green candle, indicating a trend reversal. As the hammer pattern is formed in the support zone and and strong green follow-up candle is formed, it is a high probability trade setup of a long position.
In this example of an inverted hammer candlestick pattern, it can be seen that an inverted hammer pattern is formed at the support zone after a strong downtrend, this signifies that buying pressure has somehow emerged and stopped the surge of the selling pressure. Thus, stopping the price from going down. After the inverted hammer, a good follow-up pattern for a bullish trend is formed. This makes it a high-probability trade setup for the long position.
How to Confirm a Hammer Candlestick Pattern
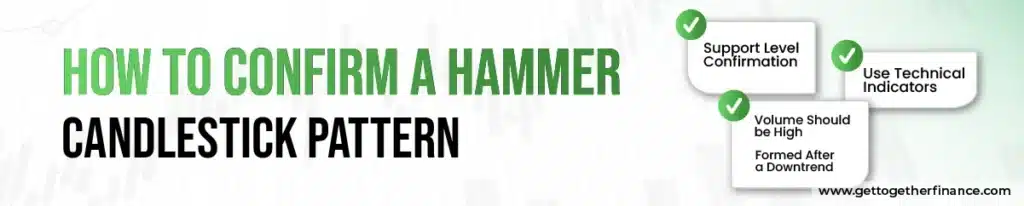
Like other candlestick patterns in the stock market, a hammer pattern has to be confirmed before taking a trade. Confirmation assists traders in avoiding misleading signals.
Here are some ways to verify it:
- Volume Should be High
An increase in hammer or the next candle shows strong buyer demand.
- Formed After a Downtrend
The hammer should form after the price reduces. If it formed after an uptrend or sideways, it is weaker.
- Use Technical Indicators
Traders use indicators with technical analysis patterns like the hammer to confirm the reversal.
- Support Level Confirmation
When the hammer forms near the support zone, it gives a more powerful signal.
- Next Candle Should Be Bullish
The next candle after the hammer has to close above the hammer’s high. This depicts that buyers are in control.
Difference Between a Hammer Candlestick and a Doji
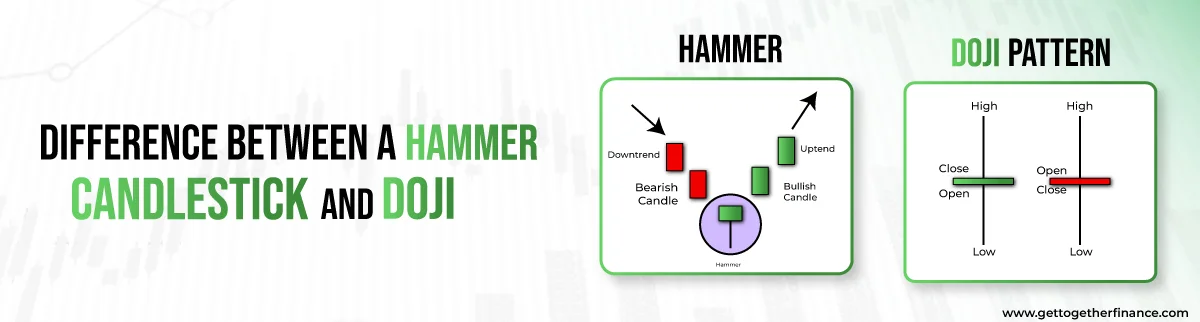
Traders often find themselves confused between the pattern of hammer candlesticks and doji. Though they have minor differences in the pattern, but their impact is significant. In the hammer, there is almost negligible or no upper wick. Further, the body of the hammer pattern is towards the upper side of the candle. This implies that though the price has consolidated a lot, its opening and closing points are nearby.
On the contrary, in the doji candle, the upper and lower wicks of the candle are significantly visible. But, the body of the candle is not formed properly. This is because the opening and closing prices are almost or completely similar in doji candles. This leaves no space for body formation, unlike the hammer pattern.
How to Trade Hammer Candlestick Pattern
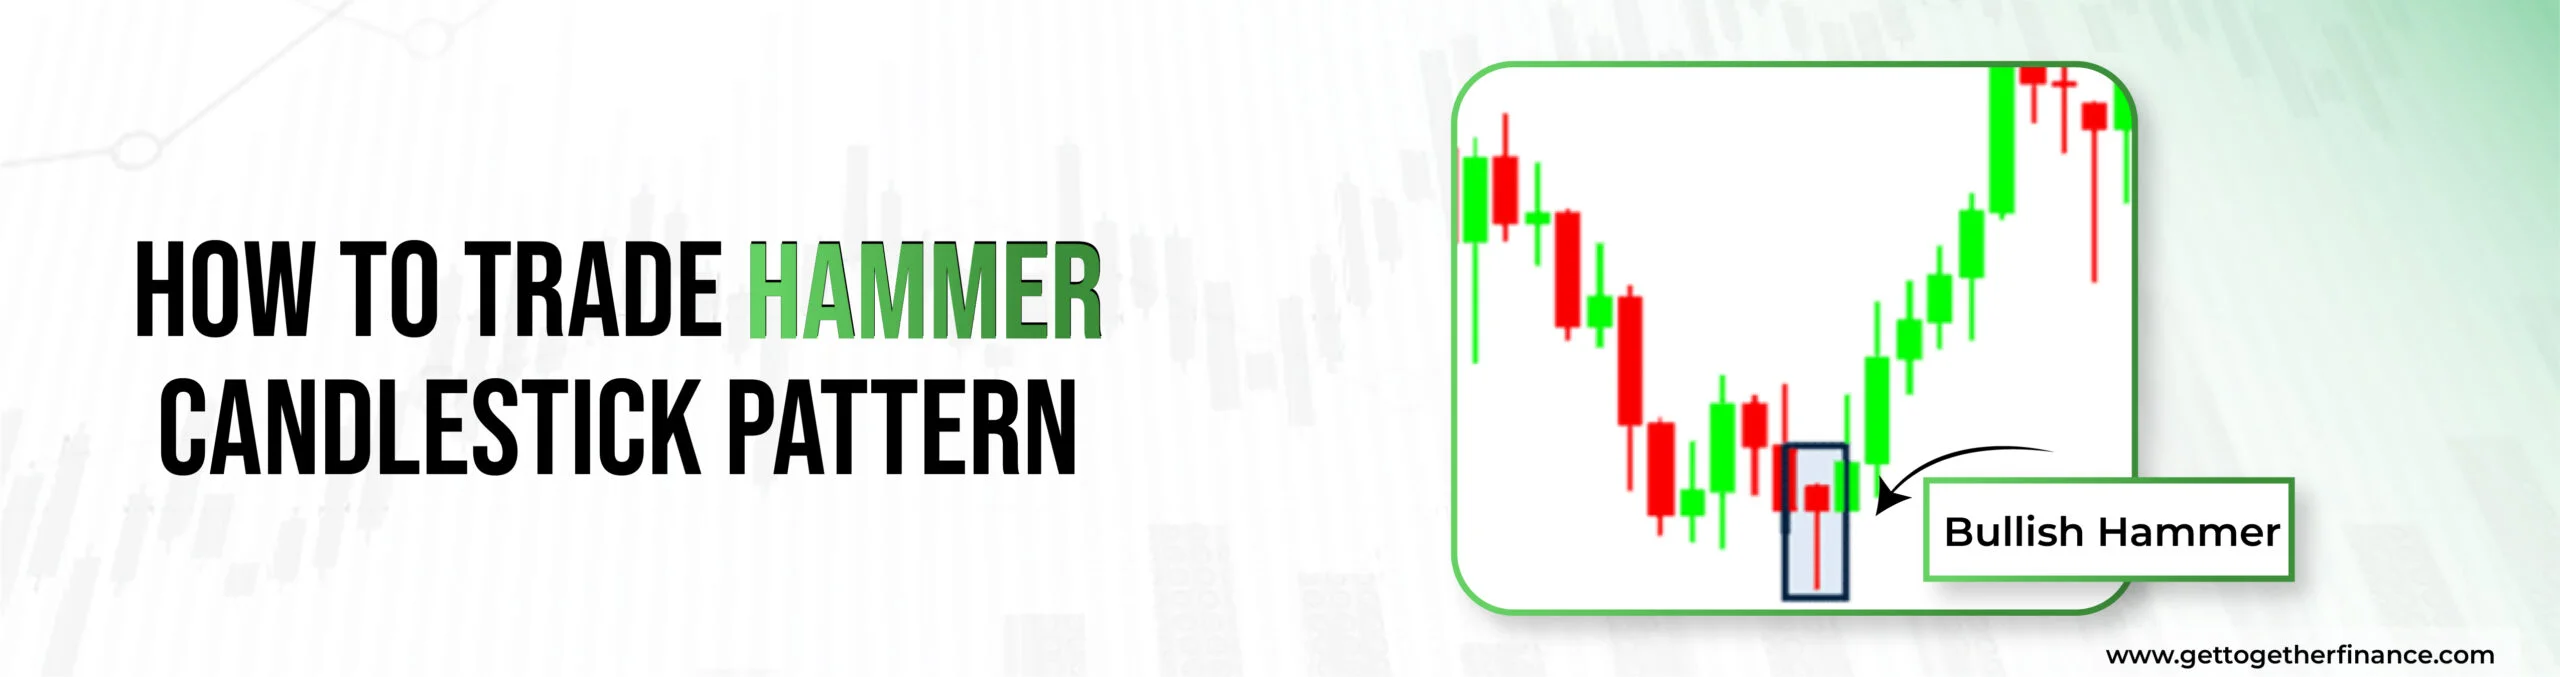
In the above figure, you can spot a significant hammer candlestick pattern after a strong downtrend. Now, after spotting the hammer pattern, you need to check whether the pattern is falling in the support zone in accordance with a good demand zone.
If the hammer pattern is formed at the support zone in accordance with the demand zone, then it is a high-probability trade setup. But, after this, wait for the formation follow-up candle. If the follow-up candle goes according to your study then you can trade like:
Entry Point: After the formation of the follow-up candle
Stop Loss: Below the hammer candle
Target: Double the range of stop loss
Best Timeframes to Trade the Hammer Candlestick Pattern

The Hammer pattern is one of the most reliable candlestick patterns in the stock market, which can appear on any timeframe.
- Weekly Timeframe (Strongest Signal)
On the weekly chart, hammer patterns are the most powerful and signal a major trend reversal. This framework works well for traders who hold a position for a long time.
- Lower Timeframes (5-min, 15-min) (Less Reliable)
On a very short timeframe, the hammer pattern is likely to produce more false indications due to price fluctuations. Traders have to wait for proper confirmation to increase the accuracy of the signal.
- Daily Timeframe (Most Reliable)
Among all the timeframes, the daily timeframe is considered the most powerful because it captures the complete range of price movement of the entire trading session.
- 1-Hour and 4-Hour Timeframes (Good for Short-Term Trading)
These tools are so useful for short-term and intraday traders as they deliver consistent signals. They provide reliable signals, but proper confirmation is necessary before trade. However, it is necessary to take confirmation before implementing any trade.
Hammer Candlestick Pattern vs Bullish Engulfing Pattern
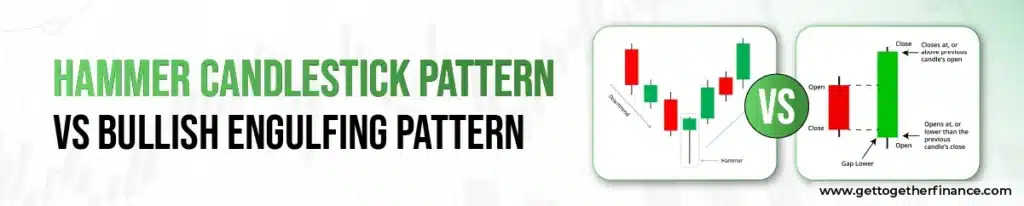
The Hammer and Bullish Engulfing are both considered bullish reversal patterns, but they differ in formation and in the levels of strength.
| Basis | Hammer Candlestick Pattern | Bullish Engulfing Pattern |
| Formation | Hammer candlestick pattern forms when the price falls, but buyers move it higher before closing. | A bullish engulfing pattern forms when a small bearish candle is followed by a big bearish candle that fully covers it |
| Number of Candles | It has a single candlestick pattern | It has a double candlestick pattern |
| Reliability | It is less reliable than bullish engulfing | It is more reliable as it provides stronger confirmation |
| Confirmation Needed | Hammer candlestick pattern requires confirmation from the next bullish candle | It gives a strong confirmation, but waiting for the next candle increase its accuracy |
| Helpful for Traders | It is helpful for traders to identify early reversal opportunities | It is helpful for traders to enter trades with more confidence |
| Signal Strength | It indicates early signs of buying pressure | It indicates strong buying momentum and a shift in market control |
| Purpose | The main purpose of the hammer candlestick pattern is to indicate a possible trend reversal | The main purpose of the bullish engulfing pattern is to indicate a strong and confirmed trend reversal |
Key Insight: The hammer is more effective when it appears after a strong downtrend instead of a slow decline.
Difference Between a Hammer and a Hanging Man
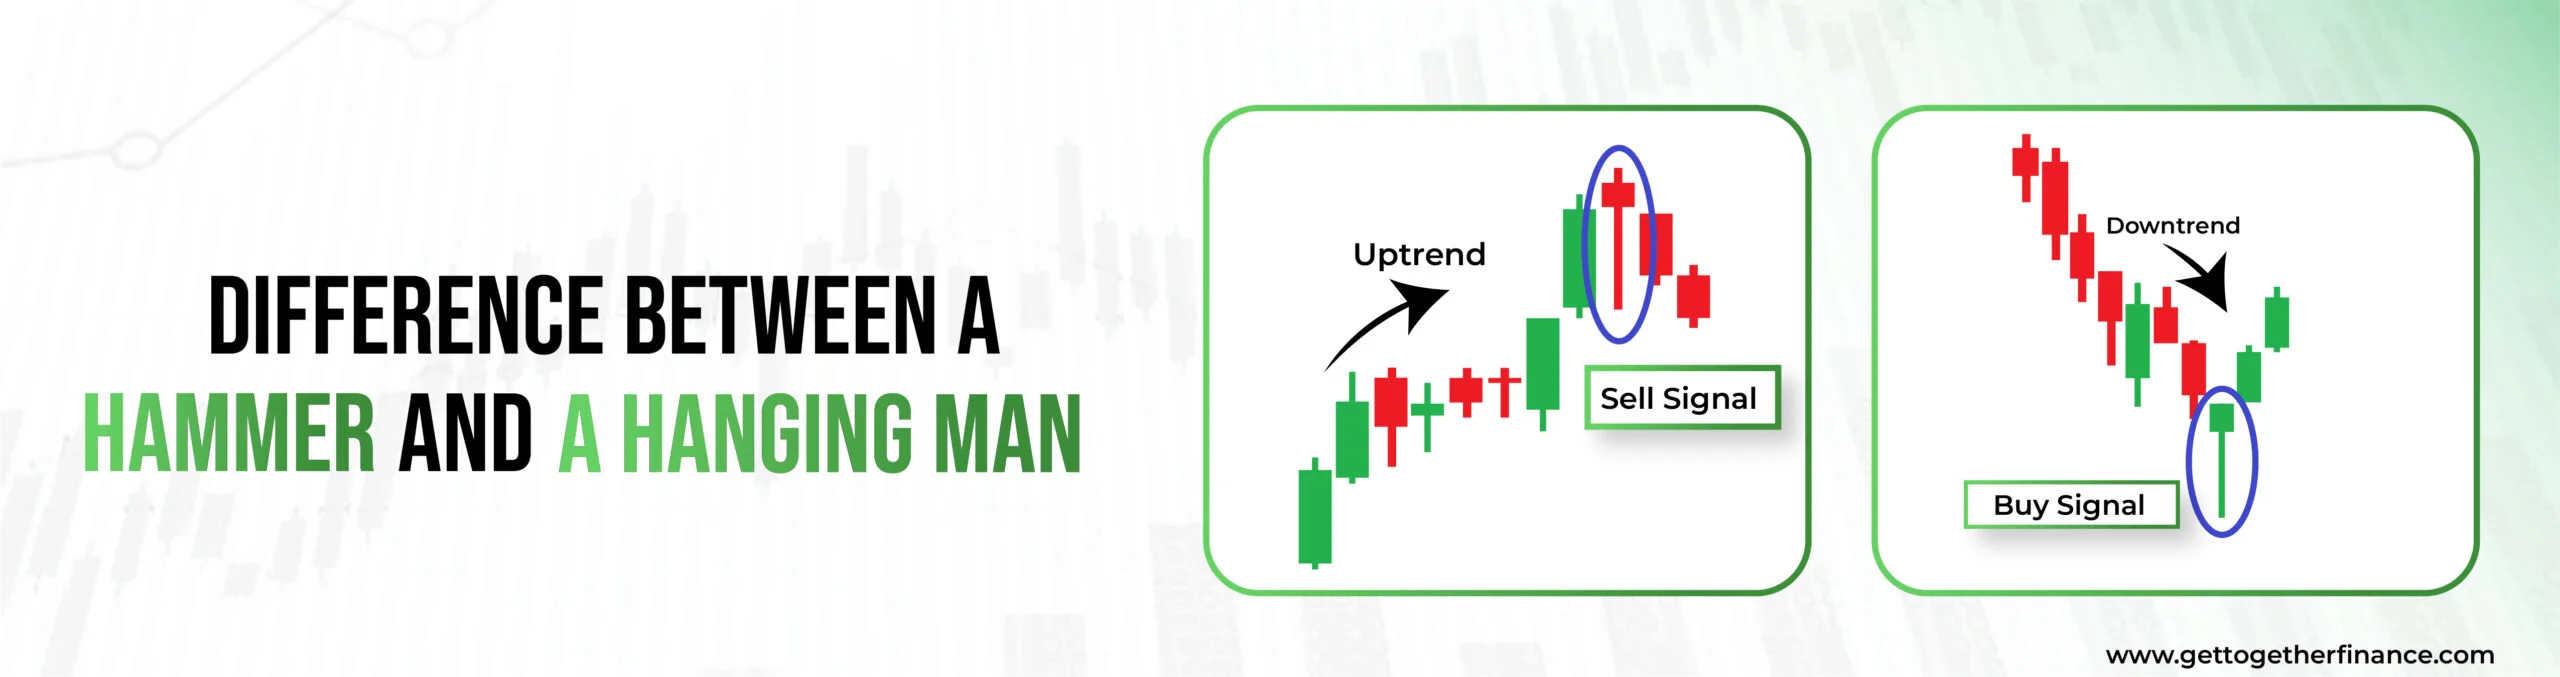
The hanging man and hammer pattern, both look similar in the candlestick chart. But, their use is distinguished by the place they are formed. Despite being similar in formation, the hammer pattern is a bullish signal and the hanging man is the bearish signal.
If a pattern resembling to hammer pattern is formed after the uptrend, it is termed a hanging man. It denotes that after powerful buying, sellers are trying to bring the price down, resulting in the formation of a hanging man pattern. The hanging man pattern should only be considered or traded when it is formed in the resistance zone and is in accordance with a good supply zone. Otherwise, it might be a false signal.
In the case of a hammer pattern, it is a bullish signal when it forms at the bottom downtrend in accordance with the support zone.
Importance of Hammer Candlestick Pattern

A hammer pattern is helpful for traders when it occurs after the downtrend. When the price is making consecutive lower lows in the downtrend, then the formation of the hammer pattern puts a stop to it. This suggests that now the buyers are gearing up to overpower the sellers.
If the other factors like demand and supply, price action, and market trends are in the favor, then the hammer pattern works as an excellent bullish signal.
The longer lower the wick of the hammer pattern signifies that sellers tried to bring the price down. But, the closing of the candle near the opening price indicates that buyers fought with full force to bring the price upwards.
Whenever a hammer candlestick pattern forms, one uses advanced technical analysis knowledge and forecasts whether the downtrend is going to witness a reversal or not. Additionally, it is a great sign for traders to exit the short position as the trend may reverse.
Also Read: Iron Butterfly Strategy
Trader Psychology Behind the Hammer Candlestick Pattern

The Hammer candlestick pattern is a bullish reversal pattern that shows a shift from sellers to buyers. Initially, sellers reduce the price, which perpetuates the downtrend. This creates the long lower shadow. However, buyers then enter the market and begin purchasing at lower prices. Buyers step in and again push the price up to around where it began.
This means sellers tried to reduce the price but failed to keep it down. Buyers did not want lower prices and pushed back strongly. This shift indicates that the price has stopped falling and has started moving higher. Although traders generally wait for confirmation from the next bullish candle before taking a trade.
Common Mistakes Traders Make With the Hammer Pattern

Here are some common mistakes that traders make while using technical analysis patterns, like the hammer pattern.
- Ignoring the Previous Trend
The hammer is a bullish reversal pattern and works well after a downtrend. Applying it in a rising market reduces its effectiveness.
- Ignoring Volume
Limited volume indicates weak buyer participation. Traders have to look for stronger volume to verify the reliability of patterns.
- Not Using Stop Loss
Some traders skip using stop-loss. When the patterns fail, it can lead to heavy losses.
- Trading Without Confirmation
Most traders enter a trade immediately after seeing a hammer. A signal may be false if it is not confirmed by a bullish candle.
- Not Checking Support Levels
A hammer that is formed near a powerful support zone is more trustworthy. If traders are not able to consider resistance and support levels, then it can resulted to wrong trades.
- Entering Too Early
Opening a position before the next candle completely closes poses considerable danger. In order to avoid danger, traders have to wait for proper confirmation.
Limitations of Hammer Candlestick Pattern

One of the biggest limitations of the hammer candlestick pattern is that a trader cannot take a position solely based on the hammer pattern. For an accurate and highly probable trade setup, a trader needs to include various factors in their study. These factors are technical analysis, demand and supply theory, price action, and some technical analysis. There are a lot of false signals in the price chart that can trap the traders at any level.
For example, if a stock has seen a good downtrend after low lows a hammer pattern appears. After seeing the hammer patterns people might gear up for these long positions, but sometimes the price goes down again trapping the trader. The price went down because the other market factors were in favor of hammer candlestick patterns.
When Does the Hammer Candlestick Pattern Fail?
The Hammer pattern can fail when the buyer fails to keep pushing the price higher after it forms.
Below are given some situations when it fails:
- Forms in a Strong Downtrend
When the selling pressure is too strong, the hammer gives a false indication, and the price continue keeps falling.
- Low Trading Volume
A hammer that develops on low volume indicates that buyers have limited interest, which lowers the overall trustworthiness of the signal.
- Forms Away from Support Level
When the hammer appears from an important support level, the chances of reversal decrease.
- No Confirmation from Next Candle
If the next candle is bearish and closes under the hammer’s low point, then the pattern fails.
- Breaking the Hammer’s Low
When the price drops below the hammer’s low, it shows that sellers are still in control.
Key Insight: The hammer pattern not only indicates a reversal but also discloses a strong rejection of a lower price and possible market bottom.
Conclusion
The hammer candlestick pattern is a powerful technical analysis tool that can provide significant insights into market emotion and future price reversals. The pattern’s unusual shape, which resembles a hammer with a small body and extended lower shadow, denotes a strong rejection of lower prices and suggests a bullish turnaround.
The hammer pattern can be used by traders and investors to identify prospective purchasing opportunities, particularly following a decline. The long lower shadow indicates that purchasers drove the price upward, signaling a transition from bearish feeling to probable positive momentum. However, other elements like market context, volume, and additional technical indicators must be considered to corroborate the signal’s intensity and validity.
The hammer candlestick pattern, when combined with detailed analysis and risk management measures, can improve trading decisions and overall trading performance. To maximize its efficiency and produce profitable trading outcomes, it is critical to constantly educate oneself and practice employing this pattern in various market scenarios.
FAQs
Can hammer candlestick patterns be applied to intraday trading?
Yes, the hammer candlestick pattern can be applied in intraday trading. However, the trader should not depend solely on the study of patterns to enter into the trade. A trader should check whether the hammer pattern is falling into a good demand zone or not. Otherwise, there is a high chance that it may be a false signal.
How long should a lower shadow be for a valid hammer candlestick?
For a valid hammer candlestick pattern, the lower shadow or wick should be almost double the size of the body of the hammer.
Are there other candlestick patterns similar to hammer patterns?
The doji candlestick pattern is said to be slightly similar to the hammer pattern. In the doji pattern, the opening and closing of the price are almost the same but it does have small upper and lower wicks. Whereas, in the hammer pattern, opening and closing prices are near, but not the same. Also, there is rarely an upper wick in the hammer pattern and the lower wick is comparable to longer than doji.
Can the hammer pattern be used in conjunction with fundamental analysis?
No, the hammer pattern cannot be used in conjunction with fundamental analysis. Hammer pattern is a part of technical analysis and its study is based on candlestick charts. The study of fundamental analysis is based on the balance sheets of the company, P&L statements, financial ratios, etc. hence there is no connection between hammer pattern and fundamental analysis.
Are hammer candlestick patterns more effective in certain markets than others?
Hammer pattern is part of technical analysis and candlestick chart patterns. No matter what market we analyse, the chart patterns work similarly in every market. But, one should depend solely on the study of these patterns in any market. It is always advisable to make moves based on advanced technical analysis in every market.
How to trade hammer candlestick patterns?
After the hammer formation at the bottom of the downtrend, wait and see the formation of a follow-up candle. If a strong green candle is formed with an opening and closing higher than a hammer, then it is a good sign of a bullish trend reversal. Here, a trader can take entry as soon as the follow-up candle is completed.
How to recognize a hammer candlestick?
A hammer candlestick pattern is usually formed at the bottom of the downtrend. You can recognize it if that negligible upper wick with the opening and closing positions for the candle falling near to each other. At last, a trader should see whether the candle has almost double the lower wick compared to the body of the candle. (The body of the hammer will be formed between the range of opening price and closing price)
What does a hammer candlestick mean?
The hammer candlestick pattern at the end of the downtrend signifies that buyers are ready to overpower the sellers. The downtrend can reverse and price may see an uptrend with the formation of a hammer pattern.


