Fibonacci Retracement
- Updated on : May 23, 2026
- 4412 Views
- by Arun Singh Tanwar

 Facebook
 Instagram
 Youtube
Overview
The world is connected in unexpected ways, and our ancient India has proved this with various methods. There is a stock market tool named, Fibonacci Retracement, which is derived from the famous Fibonacci Sequence. The sequence helps in identifying the potential reversal points of the particular stock.
This mathematical sequence was developed by Indians in nearly 200 BC and then introduced to the world by Leonardo of Pisa, also known as Fibonacci. Indian mathematicians proved long ago how this algorithm and its GOLDEN RATIO connect the world beautifully.
As the time passed, many applications of the Fibonacci sequence were developed. One of these is the Fibonacci retracement, used by technical traders in the stock market.
What is Fibonacci Retracement?
Derived from the famous Fibonacci sequence, Fibonacci Retracement helps in determining the potential reversal zones. The Fibonacci sequence is the set of numbers where the sum of the last 2 numbers makes up the next number. The greatest thing about this sequence is that the ratio of two consecutive numbers in the whole sequence is the same.
Let’s understand it better with the actual example, here the Fibonacci Sequence
0,1,1,2,3,5,8,13,21,34,55,89,144,233, 377….. and the sequence goes on
Now let’s understand it thoroughly.
The series of ratios in the Fibonacci Sequence is 61.8%, 38.2%, and 23.6%.
FACT TO REMEMBER: Though 50% is not the Fibonacci sequence, it is still considered a parameter to understand the sequences at various places, including the stock market.
The ratio between a number and the number next to it in the above sequence is nearly 0.618 and the percentage is 61.8%. Where the inverse ratio is also correct. In the inverse scenario, we divide any number of the sequence with the number just before it. Here, the ratio is 1.618.
This ratio is called GOLDEN RATIO.
When we divide a number with the second number on its right, the ratio is .382 and the percentage value is 38.2.
According to the above information, the key ratios used in Fibonacci sequence are 61.8% and 38.2%. Interestingly, the golden ratio of the Fibonacci sequence is found in various places. It is found in spirals of galaxies, hurricanes, flowers, DNA Strands, etc.
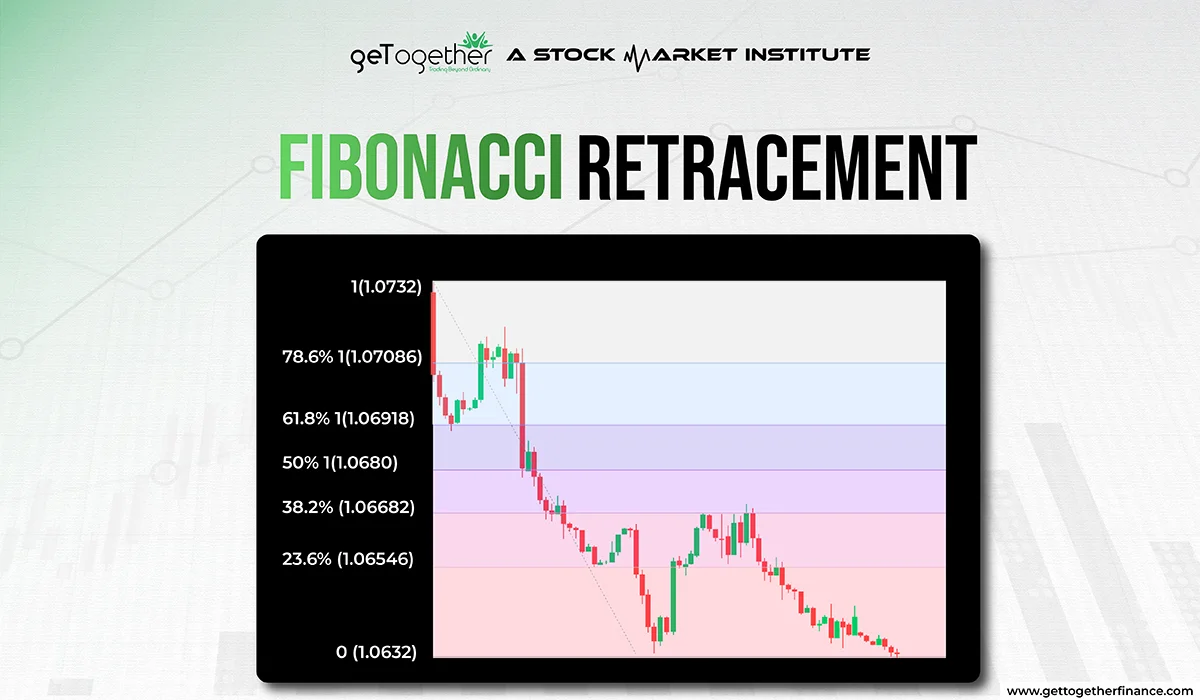
What Are Fibonacci Retracement Levels?

Fibonacci retracement is a technical chart tool as well as a universal algorithm; its levels in technical charts indicate potential support and resistance levels where the price might reverse direction. These levels are derived from the Fibonacci Sequence, a mathematical series and algorithm that is prevailing in nature and is also applicable to financial markets. The key Fibonacci retracement levels are 23.6%, 38.2%, 50%, 61.8%, and 100%.
The Formula for Fibonacci Retracement Levels
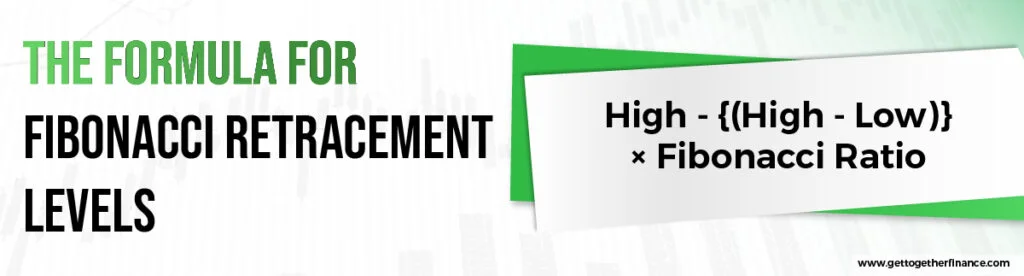
The Fibonacci retracement levels are calculate using this formula:

In this formula:
- High is the highest price point at the given levels
- Low is the lowest price point at the given levels
- Fibonacci Ratio refers to the percentage retracement levels derived from the Fibonacci sequence (e.g., 23.6%, 38.2%, 50%, 61.8%, 100%).
How to Calculate Fibonacci Retracement Levels

To calculate Fibonacci retracement levels, follow these steps:
- Identify the high and low points of the price movement.
- Subtract the low from the high to determine the range.
- Multiply the range by the Fibonacci ratios (23.6%, 38.2%, 50%, 61.8%, 100%).
- Subtract each resulting value from the high to get the retracement levels.
For example, if the high of the stock is ₹200 and the low is ₹100:
- Price Range = ₹200 – ₹100 = ₹100
- Fibonacci levels:
- 23.6% level = ₹200 – (₹100 × 0.236) = ₹200 – ₹23.6 = ₹176.4
- 38.2% level = ₹200 – (₹100 × 0.382) = ₹200 – ₹38.2 = ₹161.8
- 50% level = ₹200 – (₹100 × 0.50) = ₹200 – ₹50 = ₹150
- 61.8% level = ₹200 – (₹100 × 0.618) = ₹200 – ₹61.8 = ₹138.2
- 100% level = ₹200 – (₹100 × 1) = ₹200 – ₹100 = ₹100
What Do Fibonacci Retracement Levels Tell You?

Fibonacci retracement levels can assist traders in identifying levels at which a stock or security’s price level may become potential support or resistance. When the price of a stock returns to one of these levels, it usually means that the r These measurements are frequently employed in technical analysis to identify entry and exit locations, place stop orders, and forecast profits.
Also Read: Last Traded Price in Share Market
Why Are Fibonacci Retracements Important?

Fibonacci retracements are important for several reasons:
- Predictive Power: The retracement levels provide a way to predict the potential reversal price levels based on past price movements.
- Support and Resistance: Fibonacci levels often coincide with probable support and resistance levels on the chart, making them helpful for traders.
- Versatility: The best thing about the retracement is that it can be applied to any financial market, including stocks, commodities, and forex.
- Risk Management: Identifying important levels where prices may reverse allows traders to construct more effective stop-loss and take-profit orders, hence boosting risk management tactics.
To summarize, Fibonacci retracement levels are an effective tool for technical analysis, providing insights into probable market reversals and assisting traders in making more educated decisions.
Fibonacci Retracement in Stock Market
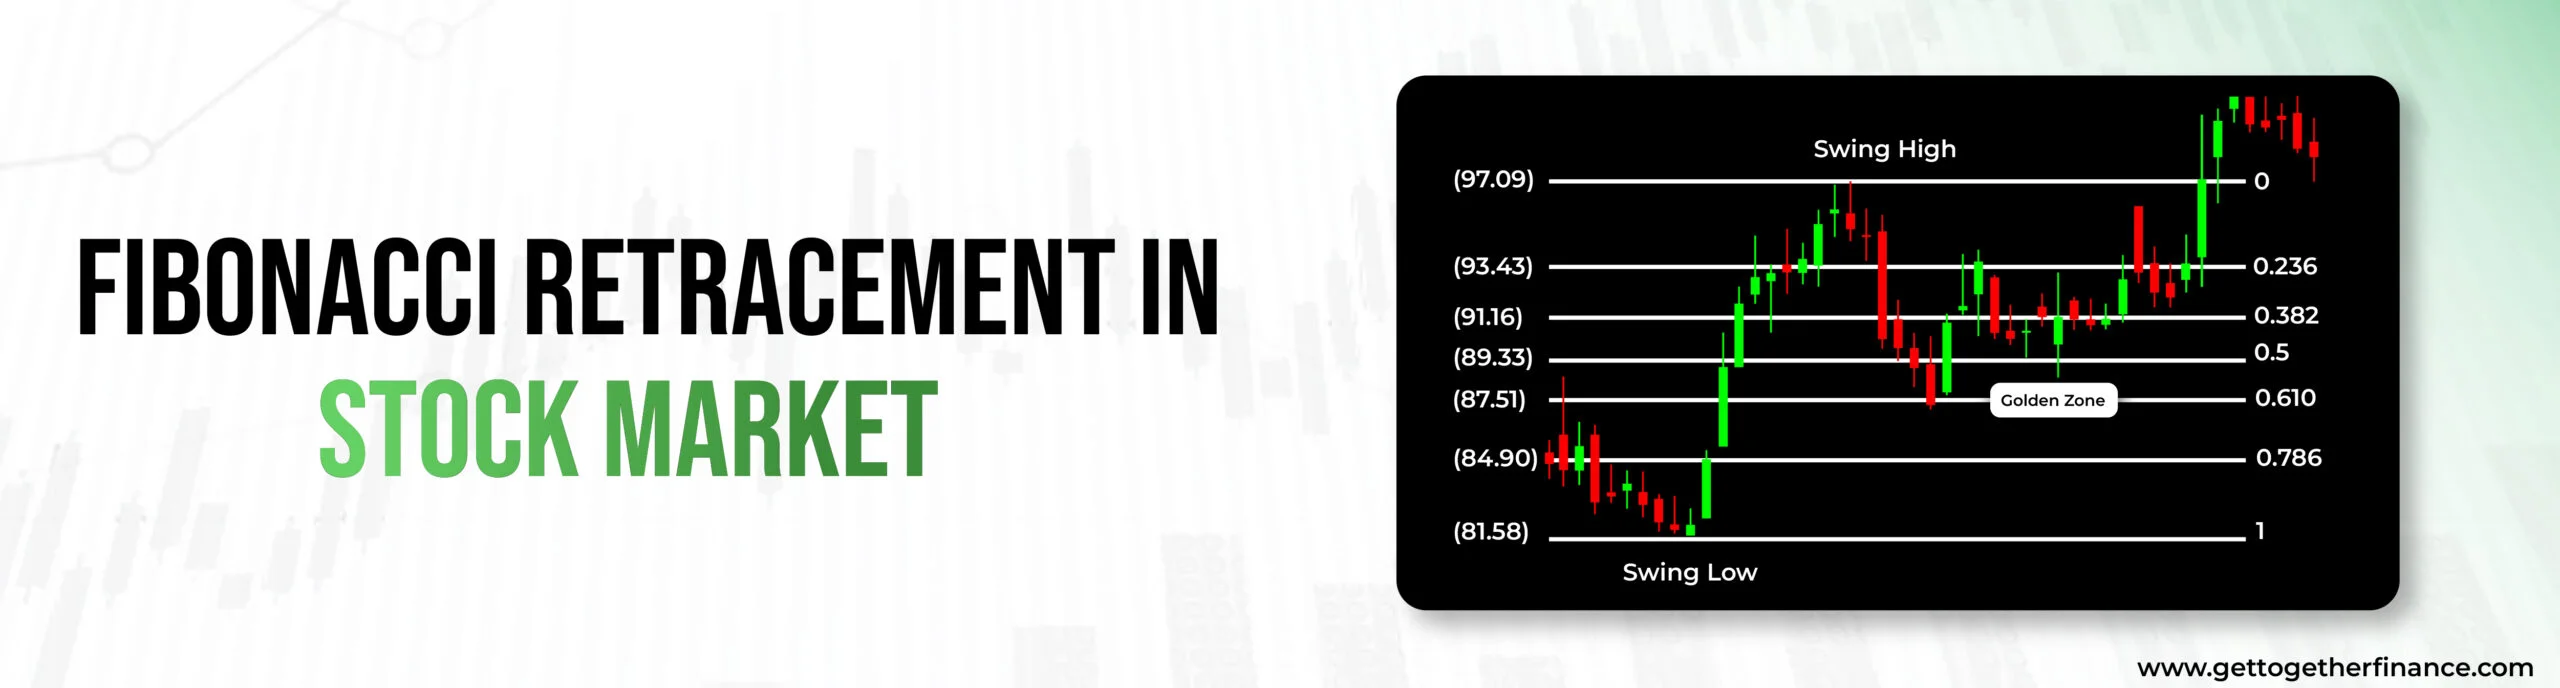
Fibonacci Retracement in the stock markets helps in identifying the probable points from where the price can take a U-turn. This further helps in knowing proper entry and stop loss points in any trade.
You don’t have to do the above calculation to find the possible reversal points via this retracement. The digital brokers allow you to make the Fibonacci retracement lines automatically.
These retracement lines divide the area between the origin support zone origin resistance zone of the stock into 3 core areas or curves. These are at 23.6%, 38.2%, 61.8%. Position of the current price of the stocks in different parts of the retracement helps in predicting the future direction of the price.
Let’s understand this with an example; suppose the price of a stock has witnessed a continuous upmove from 50 to 150. Now, after the upmove, when the price starts falling again, traders use the retracement levels to know when the price can reverse itself and move upward again.
Here, the Fibonacci area will be marked from 50 to 150 and the range of retracement is 100 (150-50). When the price starts to go down it is possible that it can reverse itself from the Fibonacci levels. The first Fibonacci level will be at 23.6%, here it will be nearly at the price range of 73-75. The next correction point can be at the 38.2% level, which is nearly in the price range of 88-90.
Further, the next price correction level will be at 50%, which is nearly the price range of 100-105. Now, if the downtrend is not corrected by all the upper levels, there is a high probability that a golden ratio of 61.8% can reverse the trend. In this scenario, it will be near the price range of 111-115.
This was an example of the use of Fibonacci retracement in a downtrend, it is used in the same way in an uptrend too.
Limitations of Fibonacci Retracement

The retracement lines provide a clear overview of probable price reversal points between the origin support and origin resistance area. But, with all these theories and strategies, there is no full proof assurance that the price will go according to the rules of the retracement line. This means, that if lines show that the price is at the lower part of the retracement it will go up, but if there is a supply zone it can even fail. Hence, there is no surety that the price will go in an upward direction, because of various other factors.
Various external factors determine the price of the stock. One of the main factors is demand and supply forces. That’s why it is important to study and analyse the candlestick chart well before making any move solely based on the retracement lines.
Conclusion
Fibonacci retracement lines are a useful tool in technical analysis since they provide traders with valuable information about probable price reversals and support/resistance levels. Traders can make more educated judgments, improve their risk management tactics, and boost the likelihood of profitable trades by utilizing the mathematical ratios obtained from the Fibonacci sequence.
It is important to remember, however, that these retracements are not perfect and should be used in conjunction with other indicators and research methodologies. Retracement lines can become a valuable addition to any trader’s arsenal with practice and a thorough understanding of market dynamics, assisting in more efficiently navigating the complicated world of financial markets.
FAQs
Does Fibonacci Retracement actually work?
The retracement lines help in finding possible price trend reversals in the stock. However, these are not completely reliable. One should take the help of other technical trading theories like demand and supply too, before confirming their trade.
What is the best time frame in the chart to use Fibonacci?
The best time frame to use the Fibonacci is the time frame you want to trade on. It can be weekly, monthly, or daily according to your choice of trade.
What is the Strongest Fibonacci level?
The strongest level in this sequence is the golden ratio, which is 61.8%.
Difference between Fibonacci retracement and Fibonacci extension?
While extensions represent where the price will move after a retracement, retracement levels reveal how deep the pullback can be. In other words, retracement lines measure trend pullbacks, and Fibonacci extensions measure impulse waves in the trend’s direction.
What is retracement v/s reversal?
Retracements are transitory or short-term price reversals within longer trends, whereas reversals are permanent or long-term price reversals. Retracements occur when there is continuous consolidation in the price, whereas a trend reversal occurs when the direction of the trend changes.
Want to learn more about trend reversal with the help of Fibonacci Retracement and advanced technical analysis? Join our free course Trading in the Zone- Elementary now and grab all these learnings.


