Shooting Star Candlestick Pattern: How to Identify and Trade It
- Updated on : May 23, 2026
- 3135 Views
- by Arun Singh Tanwar

 Facebook
 Instagram
 Youtube
Overview
For traders, a shooting star is not only about a cosmic event, but it is also about a potential turning point that would be revealed on the chart. As already Candlestick patterns have become quite popular among traders for trying to gain an advantage by being able to read the live price action as it forms. It is among one of the most popular patterns because it gives essential information.
In this blog, we will go on a journey of understanding shooting star pattern. What is it? How to identify it? And how you can use it in your trading journey for your own benefit. Let’s start rolling to get a better understanding of this chart pattern.
What Is the Shooting Star Candlestick Pattern?

The shooting star candlestick pattern is a type of candlestick pattern that indicates a possible reversal from an uptrend to a downtrend. This pattern is formed when the price opens, goes higher, then drops and closes near its opening price. Because of this, the candle has a small body at the bottom and a long upper shadow, which represents a fight between buyer and seller. The buyers tried to increase the price, and the sellers tried to control it, but in the end, the sellers won.
The shooting star candlestick pattern is a warning sign that indicates traders should be cautious about buying and a possible selling opportunity. That’s why it is important for them to always wait for confirmation before making any move, such as a price break below support levels.
Structure and Anatomy of the Shooting Star Pattern
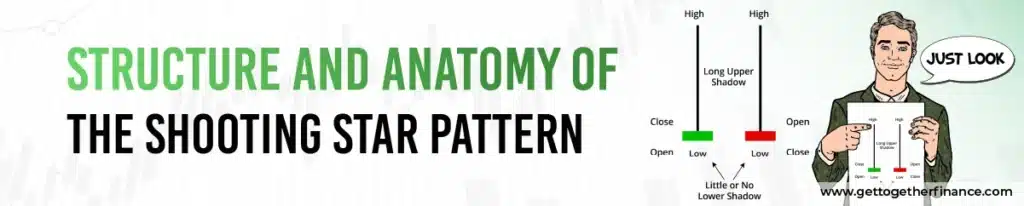
The shooting star candlestick pattern has a very particular structure that helps traders find it on the chart. It forms after an uptrend and shows the fight between buyers and sellers. The candle represents that buyers increase the price higher, but the seller dominates in the end. This move signifies a possible reversal in the market direction.
Upper Wick
The upper wick is the most crucial part of the shooting star pattern. It is long because buyers pushed the price really high during that session. The seller came and pushed the price down quickly, showing higher selling pressure.
Real Body
The real body of the shooting star is small and located near the bottom of the candle. It represents that the opening and closing prices were almost the same. At the start of the session, the market was uncertain, and neither buyers nor sellers had full control. But by the end, sellers came and reduced the price to close near the bottom.
Lower Wick
The lower wick is either very small or completely absent. This means when the price decreases, it stops there, and no buyer tries to push it back higher. This makes the sellers in control, which increases the chances of a bearish reversal.
How to Identify a Shooting Star Pattern on a Chart?
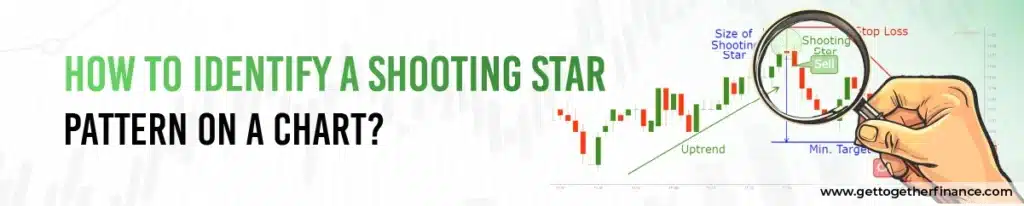
When a trader identifies a shooting star pattern, it helps them in spotting possible trend reversals. They seek the right candle structure along with proper market conditions. Traders focus on particular characteristics and the position of the pattern on the chart. This combination helps in confirming whether the pattern is valid or not.
Key Characteristics to Look For:
In order to identify a shooting star on a chart, check these key features:
- A small real body near the bottom of the candle
- A long upper wick, generally at least twice the size of the body
- Little to no lower wick
- The candle forms after a price increase during the session, but closes near the opening price
These characteristics represent that buyers increase the prices, but sellers step in and push the prices down.
Where Does the Shooting Star Appear?
The location where the shooting star appears on the chart matters a lot. If the candle is in the wrong place, then it means nothing. If the candle is in the right place, then it becomes a strong and valid signal. For a shooting star to be valid, it must appear at the top of an uptrend. The reason is that this is the best place where it actually makes sense. It becomes even more reliable when it forms near a resistance level to give extra confirmation. If the same candle appears in a sideways or downtrending market, then it becomes less effective. The reason is that there is no clear market trend, which makes the signal weak.
Is the Shooting Star Pattern a Bearish or Bullish?

The Shooting Star pattern is a bearish signal. It appears at the top of an uptrend, which indicates that buyers lose their strength. When the candle starts to form, buyers increase the price, but they are not able to hold it. Then, sellers enter and reduce the price, creating a long upper wick and a small body. This shows that the market refused to accept higher prices. Because of this, the price stops going higher and starts to decline. However, before taking action, traders always wait for confirmation, such as a bearish candle in the next session.
What is the difference between Shooting Star and Inverted Hammer?
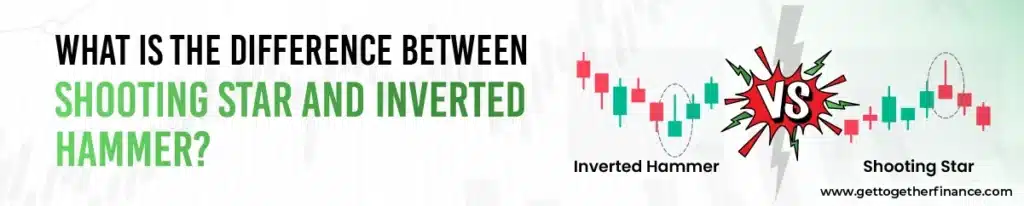
The shooting star and inverted hammer are looking similar, but they form in completely different market contexts. Although both of these patterns have similar features, such as small bodies and long upper wicks. But what they signal depends on their position on the chart. By understanding the difference, traders can make better decisions.
| Features | Shooting Star | Inverted Hammer |
| Type of Signal | Bearish reversal | Bullish reversal |
| Trend Location | A shooting star appears at the top of an uptrend | The inverted hammer appears at the bottom of a downtrend |
| Reliability | It is more reliable near the resistance levels in an uptrend | It is more reliable near the support levels in a downtrend |
| Market Psychology | Shooting star shows weakness as buying pressure fails and selling pressure wins | The inverted hammer shows potential strength as buyers begin to step in after a decline |
| Market Signal | It indicates a bearish reversal as the price may go down | It indicates a bullish reversal as the price may go higher |
| Confirmation Needed | In a shooting star, a bearish candle in the next session confirms the reversal | In an inverted hammer, a bullish candle in the next session confirms the reversal |
Also Read: Cup and Handle Pattern
How to Trade the Shooting Star Pattern?
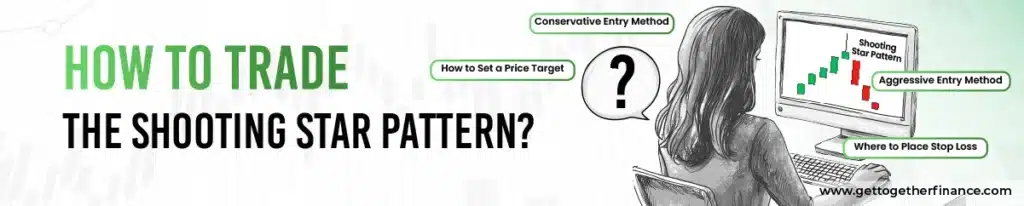
To trade the Shooting Star, you need 2 things: a structured plan and proper risk management. Traders use this pattern to look for selling opportunities because it is a bearish reversal signal. But, in order to improve the accuracy, both confirmation and right entry are essential. By using a disciplined approach, traders can get better results from this pattern.
Aggressive Entry Method
In the aggressive entry method, traders enter the trade just immediately after the shooting star candle closes. They enter near the closing price of the candle without waiting for confirmation. This method gives traders an early entry at a better price, and if the trade goes right, traders earn a high profit. But here the risk is high because there is no confirmation for reversal, and the price might still go higher. That is why, for risk management, setting a stop-loss above the high of the shooting star is important. Most experienced traders prefer this method as they are comfortable in reading price action and managing their risk.
Conservative Entry Method
In the conservative entry method, traders wait for confirmation before entering a trade. They don’t act immediately; they look for additional signals to check whether the reversal is valid or not. In this approach, traders only enter the trade when the next candle is red to confirm the selling pressure. If the price breaks below the low of the shooting star, it is a strong indication that the market may move downward.
Conservative entry method helps in reduce risk because it avoids false signals and increases the chances of a successful trade. But by waiting for confirmation, traders get delayed in entering the trade. So, when they enter, the price has already gone down. Although they catch the move but miss the starting part of it.
Where to Place Stop Loss?
For traders, it is important to place a stop-loss correctly in order to manage risk and protect capital. Also, the stop-loss has to be placed above the high of the shooting star candle. If the price goes above the high of the shooting star, it indicates that buyers regained control, and the bearish signal is no longer valid. When a trader places a stop-loss at this level, they can limit their losses if the trade goes wrong.
How to Set a Price Target?
To make a profit and manage risk, traders have to set a price target. If there is no target, then they may exit too early or stay in the trade for too long. Traders use previous support levels as a target because there is a good chance the price will pause or reverse there. Also, they can use a risk-to-reward ratio of at least 1:2. This means that if you take one unit of risk, then you have to make a double unit of reward.
Additionally, traders don’t have to close their entire trade at once. They can close half of it early to get some profit. Also, keep the other half open to get more if the price moves in their favour. When a trader sets a clear target, they can make sure that potential profit is higher than their risk. This is important for being successful and profitable in trading over the long term.
Is Shooting Star at Supply Zone a High-Probability Trade Setup?
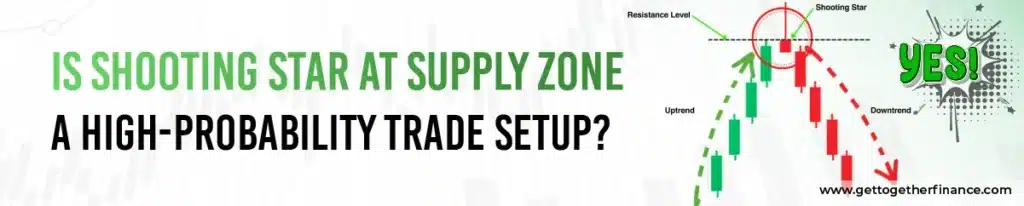
Yes, a shooting star at a supply zone is a high-probability trade setup, mainly when confirmed by the next candle. A supply zone is an area where sellers are strong, and the prices have previously reversed downward. At this level, when a shooting star forms, the indication becomes so strong because both the pattern and the zone are pointing in the same downward direction.
This trade setup works well because the supply zone acts as a resistance area where sellers tend to come. The shooting star confirms that higher prices were rejected. Both signals show that buyers are becoming weak and sellers are taking control, which makes the price reverse.
Combining the Shooting Star with Other Technical Indicators
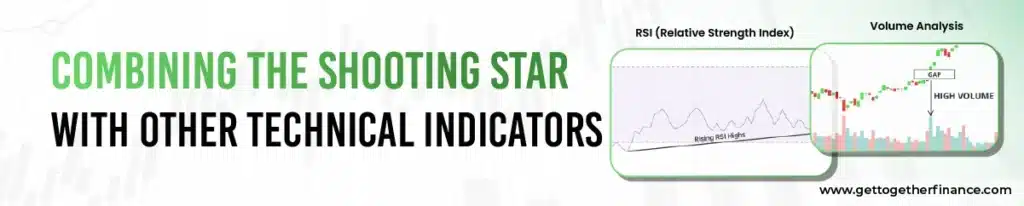
When the shooting star pattern is combined with other technical indicators, it becomes more reliable. Additional tools help traders in confirming the signal and minimizing the risk of false trades. Because of this combination, they can make decisions confidently and increase their accuracy.
RSI
The Relative Strength Index is a popular indicator that helps traders identify where the market is overbought and oversold. Also, it helps in confirming whether the shooting star signal is strong or not. When the RSI is above 70, and a shooting star appears, it suggests the market is overbought, and the bearish signal is strong. Additionally, if the RSI starts to decrease after the shooting star appears, it confirms that buyers are losing strength and sellers become active.
Volume Analysis
Volume is a significant factor in confirming the Shooting Star pattern. It helps traders understand how much selling pressure is behind the price movement. When a shooting star forms with high volume, it makes the signal more reliable. This shows a strong selling pressure and active trader participation in the reversal. In contrast, if the pattern forms with low volume, it may be less trustworthy because traders don’t participate actively to support the reversal.
Common Mistakes Traders Make with the Shooting Star Pattern
There are some mistakes that traders make with the shooting star pattern, which lead to losses and wrong trades. This happens when they don’t wait for confirmation, don’t do analysis and only depend on the pattern. By understanding these common mistakes, traders can improve their chances of making successful trades.
Ignoring the Trend
A Shooting Star only works when the price was already rising before that candle appears. If the price wasn’t rising before, then there is nothing to reverse, and the pattern doesn’t apply or should be ignored.
Not Waiting for Confirmation
When a trader enters a trade immediately without waiting for a bearish confirmation candle, it can lead to wrong signals and money loss.
Wrong Stop-Loss Placement
If the trader sets a stop-loss too close or does not place it above the candle’s high, it can result in huge losses.
Ignoring Volume and Indicators
Mostly, traders fail to use tools such as RSI or volume analysis, which can weaken the signal and make it less trustworthy.
Ignoring Key Levels
When traders don’t take trades without considering supply zones or resistance, then it can minimize the trustworthiness of the setup.
Real Chart Examples of Shooting Star Pattern
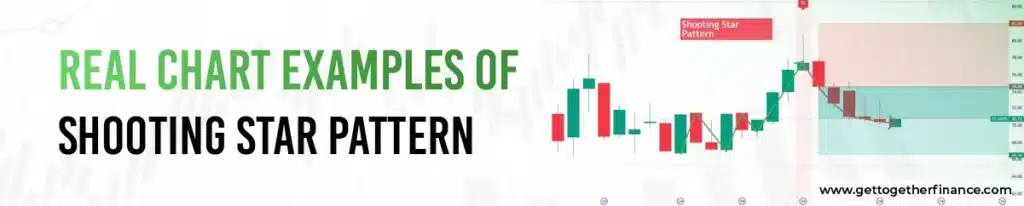
For traders, it is very important to understand the real chart examples in order to know how the shooting star pattern works. In this pattern, they not only identify the candle but also understand the market situations.
The market is in a strong uptrend, which makes higher highs. Then suddenly, a Shooting Star appears with a long upper wick and a small body. This suggests that buyers tried to raise the price higher but couldn’t do that.
In several cases, the Shooting Star forms near a supply or resistance zone, which makes it more trustworthy. After the pattern forms, the next candle turns red and breaks below the low, which confirms the reversal.
For example, if a stock increases from ₹100 to ₹120 and then a Shooting Star appears at ₹120. It is followed by a bearish confirmation candle, after which the price may begin to decline. This shows that buyers are losing strength and that sellers are gaining power.
What are the Limitations of the Shooting Star?
A single candle influence is much less during a major uptrend price fluctuation in this pattern and might not matter much as the trend persists forward. That’s why confirmation is a must. However, after confirmation, there is no guarantee that the price will continue to fall. It might pick up in alignment with the longer-term uptrend.
Although it’s good to use this chart pattern for your own benefit, with its gaining popularity, one must be aware of the trapping. So to avoid trapping traders started to use technical analysis where they would only use this pattern in the resistance area also known as the supply zone because it will be a high probability Trade setup where chances of gaining profit are very much rather than trapping.
Conclusion
The shooting star pattern is one of the most prominent signals towards a downward reversal, where its structure is somewhat similar to an inverted hammer, but its indication and placement are quite different. Though it can help you navigate your trades. It is not a standalone signal for buying or selling. One should incorporate more than one form of technical analysis tool to dig out the gains from the trades.
Frequently Asked Questions(FAQs)

When to use a shooting star candlestick chart pattern?
It is a candlestick pattern which is a very convenient technical analysis tool to use in trade in the stock market. It may be useful for traders gone short on a market looking for an accident or traders lol looking for an entry point to go long.
What is a shooting star, Bullish or Bearish?
This pattern is a bearish reversal signal that signals a recent higher move which might end up with a new lower move.
How can you trade after identifying the chart pattern?
After identifying the pattern you can either enter a trade. When the pattern is completed or, you can make a short trade when the price moves below the Low.
Is the shooting star always a reversal signal?
No, the shooting star is not always a reversal signal. It requires proper confirmation and the right market conditions to be reliable.
What timeframe works best for the shooting star pattern?
The shooting star pattern works best on higher timeframes such as 15–25 minutes, 75–125 minutes, and daily charts. The reason is that the signal is clear and more reliable.
Can the shooting star appear in intraday charts?
Yes, the shooting star pattern can appear on intraday charts and is generally used by traders for short-term trading opportunities.


