Cup and Handle Pattern: Formation, Breakout Signals & Trading Strategies
- Updated on : May 23, 2026
- 38424 Views
- by Arun Singh Tanwar

 Facebook
 Instagram
 Youtube
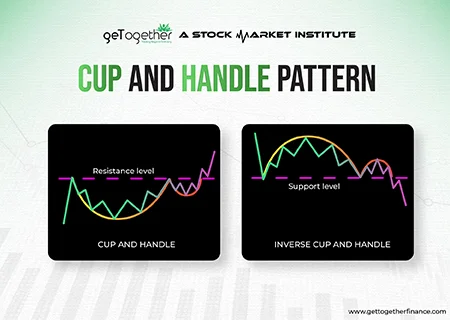
Overview
When you see a pattern forming, identify it well and know when it should break. This is both a life lesson and a great stock market lesson. Likewise to our lives, a pattern has to break in the stock market for trade opportunities. There are different candlestick chart patterns in the technical analysis. The role of these patterns is to signal the start of an uptrend or downtrend with the help of a breakout point.
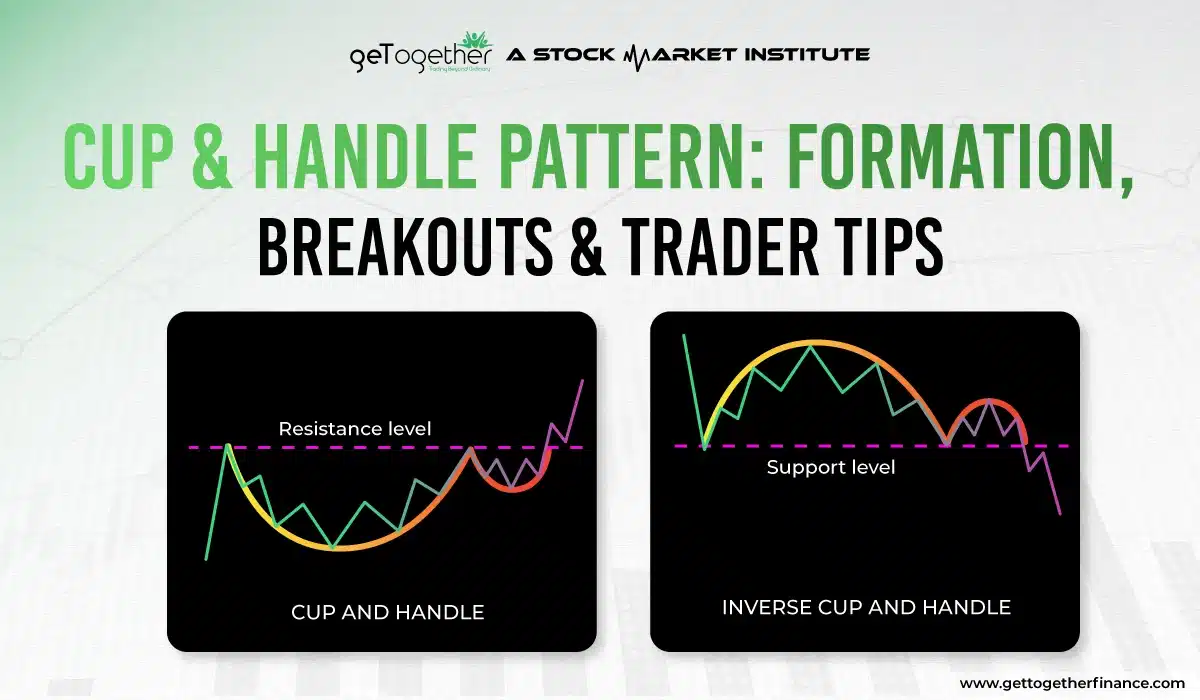
The cup and Handle pattern is one of the prominent patterns in technical analysis. It is of two types; cup and handle and inverted cup and handle pattern. The cup and handle pattern helps in signaling the uptrend in the chart. Whereas, the inverted cup and handle pattern help in signaling the downtrend in the chart.
Also Read : share market chart patterns
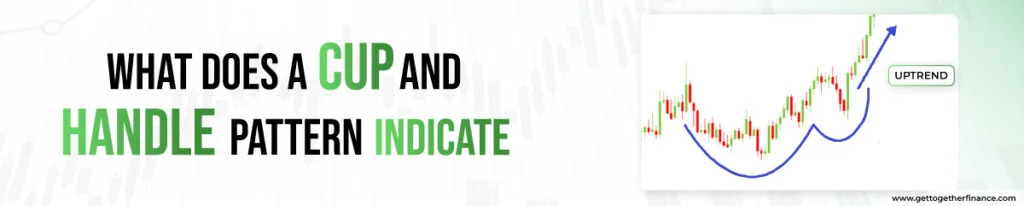
What is Cup and Handle Pattern
The Cup and Handle pattern is one of the candlestick chart patterns that is used significantly by conventional traders. It is similar to the actual shape of the cup and handle, and traders use it as a reliable breakout trading strategy. Traders anticipate the pattern completion with a strong upmove and trade accordingly at the breakout point. It is considered an excellent bullish signal when used in accordance with demand and supply.
Cup and Handle Pattern
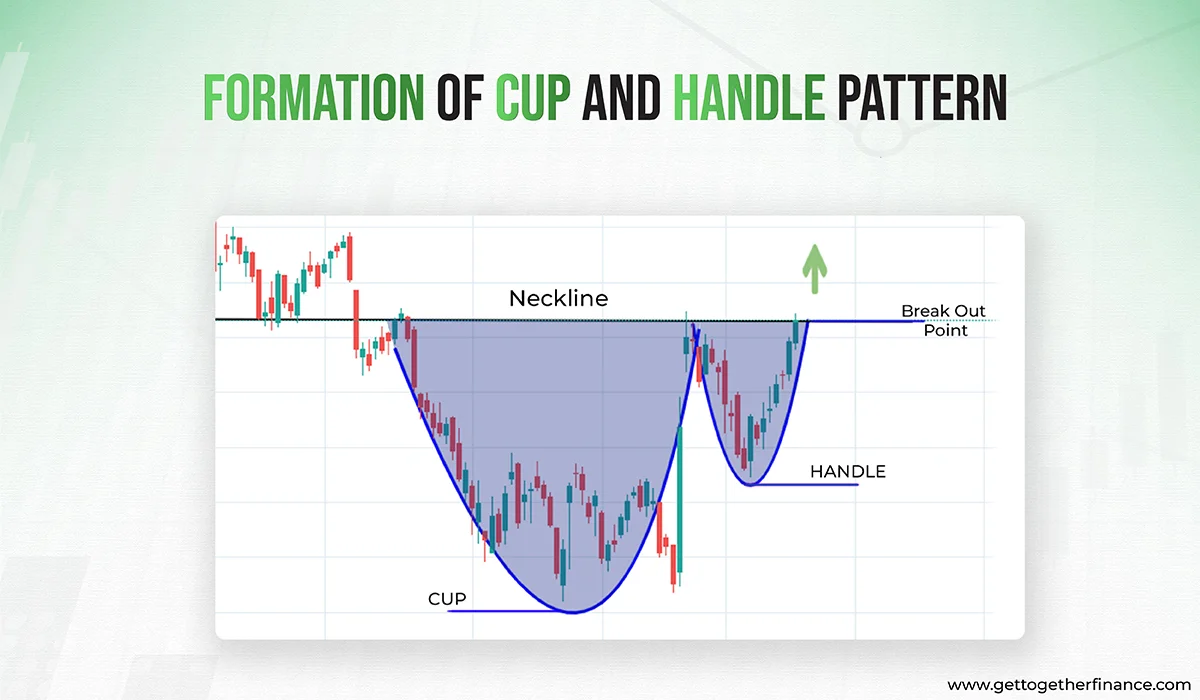
As its name suggests, the cup and handle resembles the shape of a teacup and its handle. The cup has a “U” shaped pattern made by consecutive lows followed by consecutive highs in the candlestick chart.
After the “U” shaped pattern has formed, the price hits a new low by drifting sideways. This low is higher than the previous low and it again climbs up. Resulting in a smaller “u or v” shaped pattern. This part is identified as the handle. (This is smaller than the cup part formed beforehand)
This pattern is considered a reliable bullish signal. After the pattern has formed, its breakout point can lead to a hike in stock price. The breakout point comes when the formation of the handle completes.
Remember: The handle pattern needs to be identified well. Traders need to remember that the low point of the handle should be higher than the low point of the cup.
Interpretation of Cup and Handle Pattern:
This pattern can be used in both forms; as a reversal pattern or as a continuous pattern. In the downtrend, cup, and handle patterns work as a trend reversal pattern.
When the Cup and Handle Pattern forms in the downtrend and the price goes up after the breakout point, resulting in a trend reversal.
Whereas, in the uptrend, this pattern indicates the continuation of the trend. When the Cup and Handle Pattern forms in an upward rally the price continues to go up after the breakout point. This breakout point comes after the end of handle formation.
The bullish continuation pattern occurs when buyers take a little pause before they take over the market all over again. It is similar to the situation when a lion takes two steps backward just to jump higher the next minute.
Also Read: RSI Indicator
Understanding Cup and Handle Pattern
In the simplest language, the cup and handle patterns indicate that buyers are trying to take the price up by overpowering the sellers. The cup part is formed when the price steeps low but also recovers to the same point. After the formation of the cup, the price again tries to steep low but it is not equivalent to the depth of the cup and a strong pullback makes the handle part. This complete pattern is recognized as a cup and handle pattern, where it is anticipated that buying is getting stronger and institutions are trying hard to recover the price irrespective of selling pressure created by sellers.
Inverted Cup and Handle Pattern
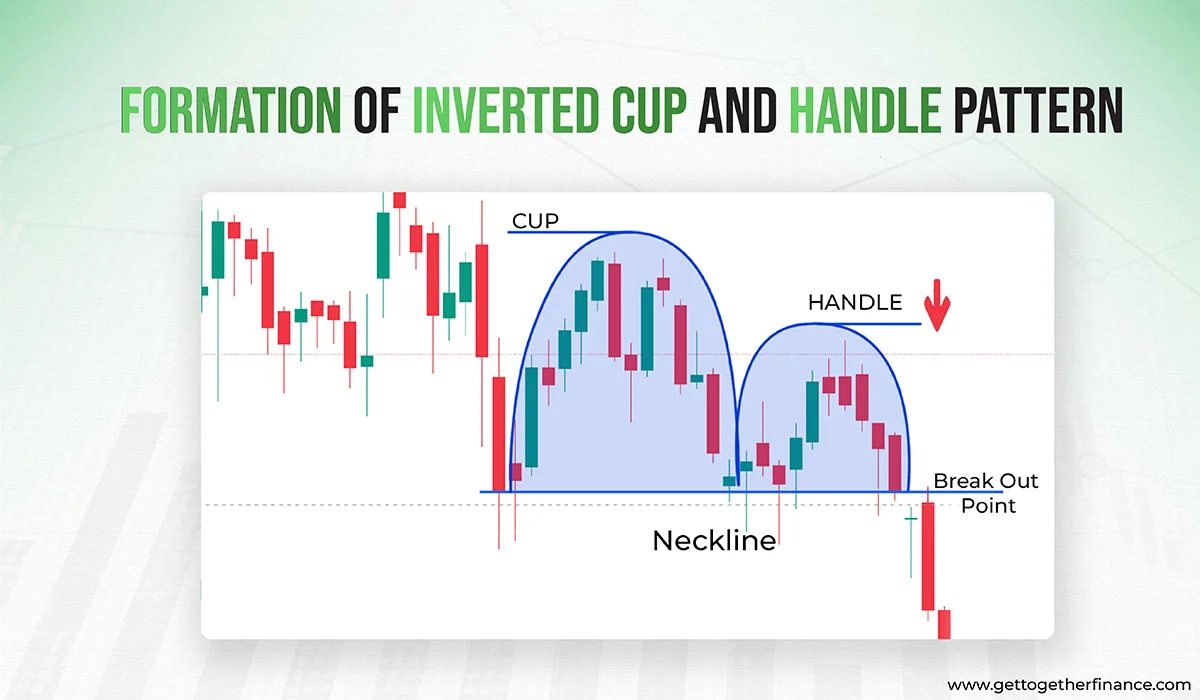
The inverted cup and handle pattern help in identifying the bearish trend in the candlestick chart. It is quite similar to the usual cup and handle pattern but in an inverted way.
The cup has an inverted “U” shaped pattern made by consecutive highs followed by consecutive lows in the candlestick chart.
After the “inverted U” shaped pattern has formed, the price hits a new high by drifting sideways. This high is lower than the previous high (high of the inverted cup) and it again falls down. Resulting in a smaller inverted “u or v” shaped pattern. This part is identified as the handle. (This is smaller than the cup part formed beforehand)
As this pattern is considered a reliable bearish pattern, its breakout point can lead to a downtrend.
Remember: The handle pattern needs to be identified well. Traders need to remember that the high point of the handle should be lower than the high point of the cup.
Interpretation of Inverted Cup and Handle Pattern:
The inverted cup and handle pattern signals the start of the downtrend. This can be used in both ways; as a reversal pattern or a continuous pattern. When an inverted cup and handle pattern is formed during a downtrend. Then, it is an indication that the downtrend can be continued. Whereas, when an inverted cup and handle pattern is formed in an uptrend, it is an indication of a trend reversal. After the formation of the pattern, the breakout point often leads to a downtrend in such situations. Traders use this opportunity to short-sell.
What Does a Cup and Handle Pattern Indicate?
From the above analysis, it is crystal clear that the cup and handle pattern acts as an excellent bullish reversal signal. But now let’s understand why it is considered a bullish reversal or continuation of an uptrend. When we closely analyze the candlestick pattern of the cup and handle pattern, we can see price is finding it difficult to steep down from a certain point. In the round bottom of the cup pattern, prices consolidate for a while, here it can be interpreted that buyers are fighting hard to overpower sellers. Hence, the downtrend is losing its momentum.
In the handle, the price again tries to go down, but buyers end the slight downtrend by bringing the price up at an increased pace. Now, if we think logically, it is clear that buyers are trying hard to end the downtrend. This is enough to interpret that a good upmove is about to come.
Remember, analyzing these patterns is keeping track of institutional behavior. If you use this with advanced technical analysis supported by demand and supply. Then there is no one stopping you from becoming a profitable trader.
What Timeframes Work Best for the Cup and Handle Pattern?

| Timeframe | Reliability | Pattern Quality | Best For | Key Notes |
| Weekly | Very high | Clear and braid price base | Long term position trader and investors | Strong moves, but need patience |
| Daily | high | Clear structure, less noise | Position and swing trading | Most popular and dependable timeframes |
| 1-Hour/4-Hour | Moderate | Okay, but filled with price fluctuations | Short term swing trader | Require strong volume confirmation |
| 1-min/5-min/15-min | Low | Noisy, fast patterns | Experienced intraday traders | Risky setups, calls for less risk exposure |
Key Insights- Bigger timeframes generally leads to more powerful breakouts
How Does Volume Confirm the Cup and Handle Breakout?

Volume plays an essential role in confirming whether a cup and handle breakout is real or likely to fail. Here’s how volume confirms each stage:
- During the Cup Formation
- Volume decrease because price goes down (left side of the cup)
- Volume remains low when the price is forming at the bottom of the cup.
- It indicates that sellers are losing control and investors start buying.
- During the Handle
- Volume becomes even lower
- The handle is a small shakeout/pullback before breakout.
Here, low volume signals:
- No aggressive selling
- Unconfident holders sell their position
- Selling pressure is fading
- At the Bottom Point
This is the most crucial volume signal. For a valid breakout:
- Many traders want to see volume as its strongest levels in weeks.
- Volume should increase rapidly compared to the handle.
- Preferably 50%-100% higher than average volume.
High volume= conviction
- Low Volume Breakout= Warning
If price breakout but price is weak:
- Breakouts may be unreal and inconsistent.
- Price may pause or pull back into the handle.
- Can lead to false breakout.
Weak volume= lack of real buyer
- Post-Breakout Action
After breakout:
- The price could pullback and touch breakout again.
- When price rises, volume picks up and when price falls, volume should dip.
- This confirms continuous demand
Simple Rule to Remember:
No volume= No conviction
No conviction= High volume risk
How to Avoid False Breakouts in Cup and Handle Trading?
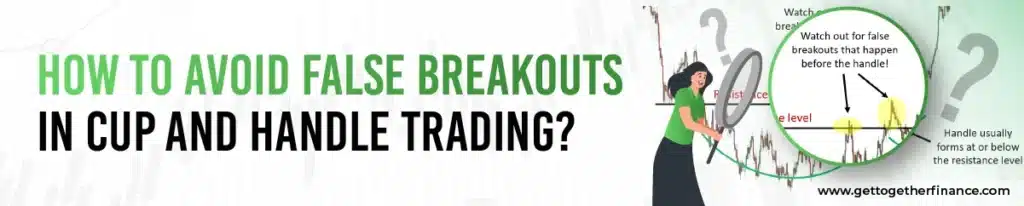
In a cup and handle stock patterns, avoiding false breakout is all about managing risk, waiting for confirmation and removing weak signals. Here’s a proper guide:
- Demand strong volume
A real breakout should have:
- High volume, mainly 50%-100% before average.
- A distinct increase compared to the handle’s volume.
- Use Multi-Timeframe Confirmation
- Mark pattern on daily chart
- Confirms the overall trend on weekly
- Use the 1-H or 4-H to get a more precise entry point
- If every timeframe agrees with the trend, the chances of false signals decreases.
- Utilize a Breakout Retest
- Sometimes price pullback to the breakout levels
- If it support or hold on low volume, it’s a positive indication
- If it break back below, pattern may fail
- Ensure Pattern that Shape
Avoid patterns that:
- Looks like a “V” rather than rounded shape.
- Have an upward sloping handle instead of downward sloping.
- Too hasty or small
Imperfect shapes= higher noise= more traps
- Check handle Depth
A healthy handle:
- The pullback should be small, not deep (not more than 8%-12% pullback in stronger markets).
- Deep handles result in weak breakouts.
Deep handles = higher chance of failure
- Don’t Enter before the Breakouts
- A valid breakout needs a closing price above the handle’s resistance zone.
- Temporary moves or upper wicks don’t confirm anything.
- Look for Institutional Sign
Clues:
- Volume surge
- Strong uptrend before the base
- Small price fluctuations
- Placed a stop-loss
Typical stop-loss:
- Below the handle low
- Or below the retest breakout level
- Check the market trend
Cup and handle pattern works well in:
- Bullish sector
- Positive market sentiment
- Uptrending stocks
- Avoid breakout near Big Resistance Zone
If:
- Previous swing high
- A major supply zone
- Trendline resistance
“When merging with support/resistant levels or volume, the cup and handle chart pattern give a relatively reliable signals”–Fintokei.com
What Indicators Work Best With the Cup and Handle Pattern?

The cup and handle stock pattern is mainly a price-volume pattern but connecting it with the right indicator lowers false breakout and improves accuracy. Here’s are the most efficacious tools to utilize:
- Moving Averages (Trend Confirmation)
Top choice:
- 50-day Moving Averages (50 MA)
- 200-day Moving Averages (200 MA)
How they assist:
- Patterns perform well above increasing MAs.
- Many become support level during pullbacks
- Confirms bullish trend
- Volume
Why it assist:
- Conforms the breakout and real buying interest
- Helps in spotting false move
What to look for:
- Volume jump sharply as price breakout
- Light volume in cup and handle
- MACD (Momentum Confirmation)
Look for:
- MACD increase during breakout
- Histogram turning positive
- The MACD line cuts over the signal line
Why it assist:
- Signals the stocks is moving out of consolidation into strong trend
- Volume by Price/VPVR (Supply Zones)
Motive: Present where major volume has treated
Why helpful: Assist in identifying nearby supply zones that could block the move.
- Relative Strength (RS) Line or RS rating
Why it matters:
- Best breakout happens when the stock is outperforming the market.
- Increasing the RS line during the handle= strong leadership
- ATR (Average True Range) for Stop-Loss
How it helps:
- It assists in placing a sensible stop-loss below the handle
- Avoid placing stop too close to the entry
- Adapt to market volatility
- Relative Strength Index (RSI)
Motive: Measure momentum
How to utilise it:
- During the handle, RSI have to hold above 40-45
- On breakout, RSI should rise above 60-70
- Fibonacci Retracement (Handle Depth Check)
Direction: A normal handle dip is around 25-35% of the cup’s overall depth.
“The Cup and Handle is a bullish continuation patterns indicates potential buying opportunities when a stock breaks out above the handle” –William J. O’Neil
How to Trade in Cup and Handle Pattern?
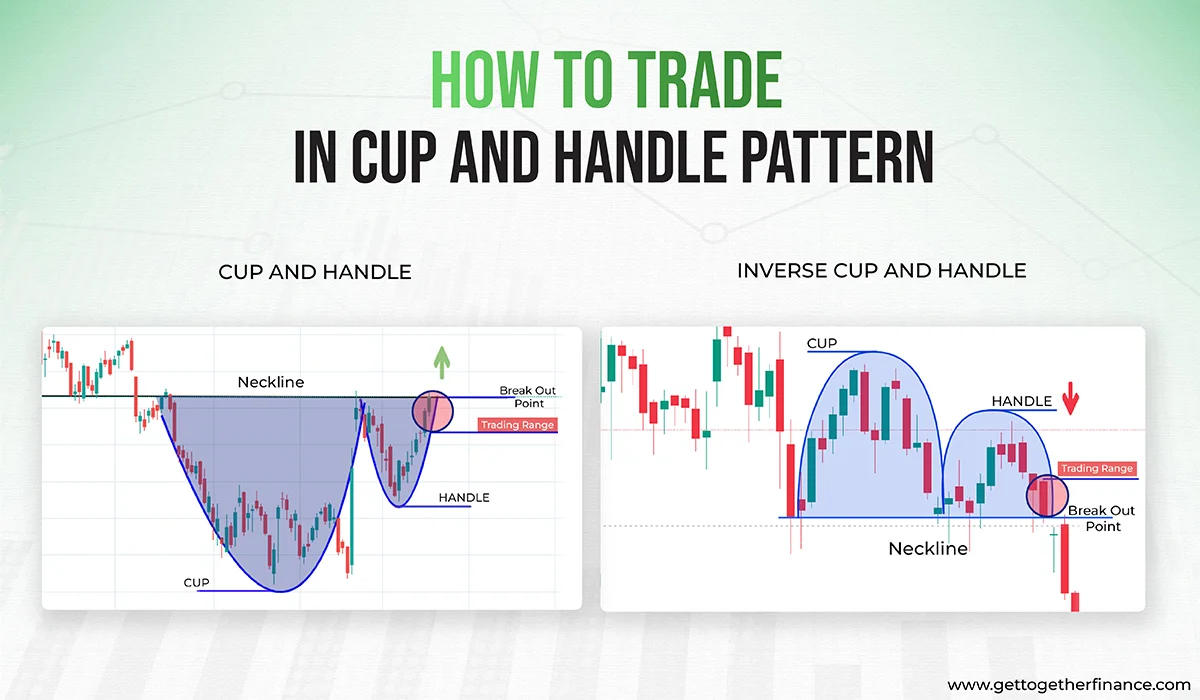
Traders need advanced knowledge of technical analysis to know the entry and exit points in cups and handle patterns. In both, the cup and handle pattern and the inverted cup and handle pattern, the entry is taken at the breakout point.
1. Entry Point:
The entry point in both the patterns, is at the breakout point.
2. Stoploss:
The stop loss in both patterns should be placed below the handle pattern. In the case of the inverted cup and handle pattern, it should be placed at the high of the handle.
3. Target:
In both patterns, the target should be the opposite of the cup range. If the cup is formed between the range of 90-100, then the uptrend target should be near to 110. Whereas in the case of the inverted cup and handle if the cup is formed between the 100-90, then the target of the downtrend should be near 80.
Example of Trading in Cup and Handle Pattern
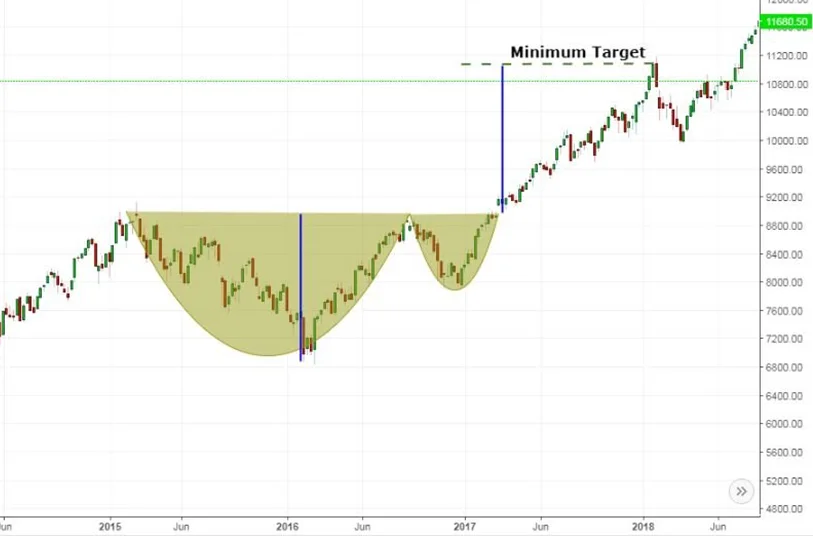
In the above example, the cup and handle pattern is easily traceable. Now after recognizing the pattern, you need to learn how to trade in this. Here, you need to take entry at the breakout point that comes after the completion of the handle pattern at the neckline (near 8800). The neckline is the resistance point from where the price tries to go downwards in the pattern.
The entry should be taken at the neckline after completion of the pattern as now the upmove is expected and the range is anticipated to break.
The stop loss should be placed below the trough or bottom of the handle pattern (between 7600 and 800). At last, here the target should be exactly the downfall percentage in the opposite direction (between 10800). In the above example, the target is set in the exact percentage of downfall that occurred in the cup pattern. Hence, you are hoping for a good up move equal to the downfall.
How Reliable is the Cup and Handle Pattern for Traders?

The cup and handle chart pattern is considered as the most dependable bullish continuation pattern within technical analysis. But, like any pattern, its reliability depends on particular conditions being met. Here’s an overview of its reliability and its effect on success:
- Overall Reliability (High)
Within a strong market, the cup and handle stock pattern has a solid performance rate, mainly when paired with trend alignment and volume confirmation. Analysts and traders view it as the most credible breakout pattern because it shows healthy market psychology.
- Short Consolidation (handle)
- Accumulation (cup formation)
- Renewed buying pressure (breakout)
- Factors that Boost Reliability
- Patterns Form Above Key Moving Averages
- If the stock is trading above the 50-day to 200-day MAs, the breakout has higher credibility.
- This shows that the overall trend is bullish, which is an essential condition for patterns to work.
- MACD, RSI, or Momentum Indicator Support the Breakout
- MACD crossing bullish
- RSI increasing towards 60-70
- Rising momentum
- Strong Volume on Breakout
- A breakout with higher volume indicates higher chances of sustained upside and real buying interest.
- Handle Depth is not Too Weak
- Handles that pull back less than 38% of the cup are seen as strong and stable.
- A poorly or large formed handle lowered the pattern strength and made it less credible.
- Low Overhead Supply
- When the area above resistance is not crowded with past trading activity, the breakout is more likely to sustain momentum.
Pro Tip- The Cup and Handle stock pattern works more reliably in high quality and stable stocks instead of noisy and manipulative ones.
What is the Target for Cup and Handle Pattern
In the easiest words, the target in a cup and handle pattern is equivalent to the depth of the cup. If the cup had the depth that brought a 2% downfall in the price. Then, the trader should target a 2% up move in the price from the breakout point at the neckline.
Limitations of Cup and Handle Pattern in technical analysis

However, it can be considered an excellent signal to spot trend reversal and trend continuation. With the growing popularity, it has started trapping traders. The biggest limitation of the pattern is that it is not highly reliable when used alone. It should always be used with knowledge of technical analysis.
As said earlier, the false signal is always in there to trap the traders. You need to have advanced knowledge about technical analysis of trading to filter the false signals from the reliable ones. Many traders get driven by their emotions and make a hurry to enter the trade before the pattern has fully formed. In this pattern always wait until the pattern has been completed before making any move.
These patterns are quite common in the candlestick charts. But, using them with the advance technical knowledge like demand and supply forces makes it a high-probability setup.
- Cup and handle pattern can be spotted frequently on candlestick charts but using it in accordance with demand or support area makes it a high probability setup with less chances of failure.
- The same thing happens in the inverted cup and handle pattern can be spotted frequently on candlestick charts but using it in accordance with supply or resistance area makes it a high probability setup with less chances of failure.
Traders need in-depth knowledge of technical analysis to identify the demand and supply zones in the candlestick chart along with the patterns. If the knowledge of patterns is supported by in-depth technical analysis then it gets easier for traders to predict the movement of the stock. To learn about advance technical analysis, enroll in our Trading in the Zone course today and get free lifetime support too.
Difference between Cup and Handle and Inverted Cup and Handle
| Cup and Handle Pattern | Inverted Cup and Handle Pattern |
| Resembles a teacup with a handle | Resembles a flipped tea cup with a handle |
| Indicates the trend reversal from a downtrend to an uptrend. (bullish indicator) | Indicates the trend reversal from uptrend to downtrend. (bearish indicator) |
| Can also act as a continuation pattern in an uptrend after the breakout point | Continuation after the breakout point is less common compared to cup and handle |
| The breakout point is at the resistance zone | The breakout point is at the support zones |
Conclusion
In the trading world, patterns may be a game changer. The cup and handle pattern, like the teacup, indicates future changes or continuations. The Inverted cup and handle, on the other hand, provide traders with a unique perspective to the traders on the flip side. Both patterns give traders a risk mitigation area, as well as specified zones and starting points. This helps traders in making informed trading decisions and helps them avoid losses.
FAQs
1. Is Cup and Handle Pattern Bullish?
A cup and handle is a bullish indicator that extends an uptrend and is used to identify opportunities to buy the stock.
2. What does the cup and handle pattern look like?
The cup resembles a "u" or a bowl with a rounded bottom that occurs following a price rally, and the handle is a trading range that develops on the cup’s right side. The pattern is complete when the price breaks out of the trading range of the handle, signaling the continuation of the previous rally or breakout of the trend.
3. How to do the cup and handle form?
Suppose the price of stock declined from 70 to 40 in the first week. This downtrend forms the left side of the cup. When the price recovers to 40 in the next week, the right side of the cup is completed. Following, the price takes a new dip, this time to 55, and then if it recovers again to 70. This leads to the formation of the cup and handle pattern.
4. What is a cup and handle pattern in stock chart analysis?
The cup and handle pattern in stock chart analysis is a breakout trading pattern. It helps traders keep an eye on the candlestick chart pattern that resembles a U shape followed by a small handle-type structure that is comparatively smaller U shape.
5. How do I identify cup and handle patterns on a price chart?
In this pattern, the cup part is similar to the U shape and followed by a smaller U or V shape pattern, known as a handle. The handle should be smaller than the cup and the neckline of both should be at even level.
6. What does a cup phase represent in the cup and handle pattern ?
The cup phase is formed when the price faces a downtrend but also recovers equally after consolidating a bit at the bottom. This consolidation makes the rounded bottom in the cup pattern. And the consolidation indicates that buyers are significantly overpowering the sellers.
7. Can you explain the significance of the handle phase?
The handle phase represents that after the recovery of price in the cup pattern, the sellers tried to drag the price down again. But the buying pressure stopped and recovered it with significant face before letting the price steep down to the level of the cup.
8. What are the key characteristics of a valid cup and handle pattern?
The cup and handle pattern should have a visible structure of the cup and handle. Where the handle is almost ⅓ the size of the cup. Also, the resistance that makes the neckline of the pattern should be at the same level.
9. How is the cup and handle pattern used for trading and investment?
In trading and investment, this pattern helps in knowing when the up move in the price is about to come. If the pattern is formed per its set structure and demand and supply, then there are chances that upmove can come.
10. Are there variations of different types of cup and handle patterns?
There are two types of cup and handle patterns, the first one is a traditional cup and handle, and the second is an inverted cup and handle. The former signals an uptrend or continuation of an uptrend. Whereas the latter represents the downtrend or continuation of a downtrend.
11. What are some common mistakes to avoid when trading in cup and handle pattern?
Cup and handle pattern is hard to spot, as there are many false signals in the candlestick chart. It’s easy to form the cup part, but finding an adequate handle pattern with the cup is tough. One should check that the neckline is at a resistance level and that the handle pattern is recovered quickly compared to the cup pattern.
12. How reliable is the cup and handle pattern in predicting price movements?
The cup and handle pattern is a widely used pattern by conventional traders. With widespread usage, its reliability has decreased as the false signals have increased significantly. For high probability trade set up with a cup and handle pattern, one should use it in accordance with demand and supply theory followed by price action.
13. Can you provide some examples of successful trade using cup and handle patterns?
For example, if the distance between the bottom of the cup and the handle breakout level is 20 points, a profit goal is set 20 points above the handle of the pattern. Depending on the trader’s risk tolerance and market volatility, stop-loss orders can be placed either below the handle or below the cup.


