Head and Shoulder Pattern
- Updated on : March 27, 2026
- 3313 Views
- by Arun Singh Tanwar

 Facebook
 Instagram
 Youtube
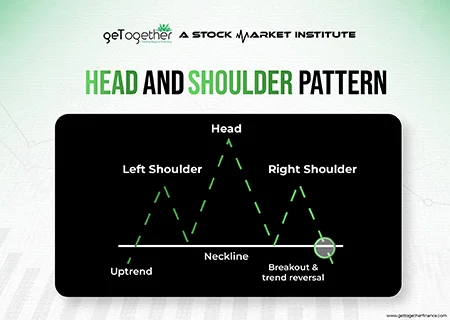
Introduction
Ever invested in the stock market and heard of the Head and Shoulder pattern? No! It’s not about fashionable clothing – it’s a powerful pattern that can help you on the bustling streets of the stock market Well! Just like reading a map before an adventure, understanding certain breakout trading strategies can be your true guide to spotting potential trend changes.
Let’s take the first step toward more – more knowledge, more money, more understanding, more profit and on..
What is Head and Shoulder Pattern
It’s time to dig deeper in the stock market! Think of this as the stock market’s whisper – a secret language between traders. In layman’s terms, the Head and Shoulder pattern is a special shape that appears on stock charts and gives an impression of a person’s Head and Shoulder. You can often spot this pattern when the price of the stock is going up for a while. Let us go in the details a little more:
- Left Shoulder: The first bump on the left side. It’s like a small hill in the stock’s price.
- Head: The big bump in the middle, that looks like the top of a hill. It’s often the highest point, similar to the head of a person.
- Right Shoulder: The last bump on the right side, similar to the left shoulder but usually a bit lower.
All these bumps are interlinked by a line at the bottom, creating a shape of “neckline.” When the price of a stock drops below this line, it could indicate that the uptrend is changing, and the price might start dropping more. This is a conventional market strategy that traders use among other share market strategies to interpret the market.
For instance, imagine this – you’re at a family gathering, and there’s one tall cousin (the head) surrounded by two shorter cousins (the shoulders) on each side. It’s like a classic Bollywood trio, right? Well, in the stock market, it’s like a story that stocks tell us – three peaks forming a pattern that gives us a sneak peek into their next moves. It’s like eavesdropping on their secret chai sessions!
Head and Shoulder Pattern Examples:
Well! Everyone has a different learning style, and let me tell you, I really like examples when it comes to understanding a pattern. Here, you’re looking at a graph of a long bullish rally in the price of Bajaj Finance stock. Between August 16 and August 31, 2021, the price went up a lot, from Rs. 6,115.80 to Rs. 7,608.60. Then, it went down a bit and formed a pattern that looks like a Head and Shoulder.
Here’s what you noticed:
- Left Shoulder – Rs. 7,988.05.
- Head – Rs. 8,037.80.
- Right Shoulder – 7,745.45.
You can also see the difference in height between the lowest point of the head and a line that connects the two shoulders. That difference was about 7.42%.
Based on this, you made a guess that if the stock price goes below a certain level (the neckline), it might start going down. You thought the price might reach around Rs. 6,915.05.
Guess what? Your guess turned out to be pretty good! On November 26, 2021, the stock price went down and reached as low as Rs. 6,775.10. Hence, the price went even lower than what you expected.
Looking at these patterns can give you an idea about where the market might go, but it’s like predicting the weather – not always right. Lots of stuff, like how a country’s doing and what people think about a company, can affect a stock’s price. So, you better be extra careful and look at different factors that can affect the market before you determine if you want to buy or sell a stock.
Since Head and Shoulder pattern is a common strategy to detect the stock price change. Another thing to keep in mind is how demand and supply patterns work. Just like the Head and Shoulder patterns reveal trend changes, understanding demand and supply patterns can help you spot those changes earlier than the H & S pattern.
When you look at patterns and know how supply and demand candles work, you could get a better idea of where the market might go. It’s like putting more pieces of the puzzle together to make smarter choices about trading.
Understanding the Head and Shoulder Pattern:
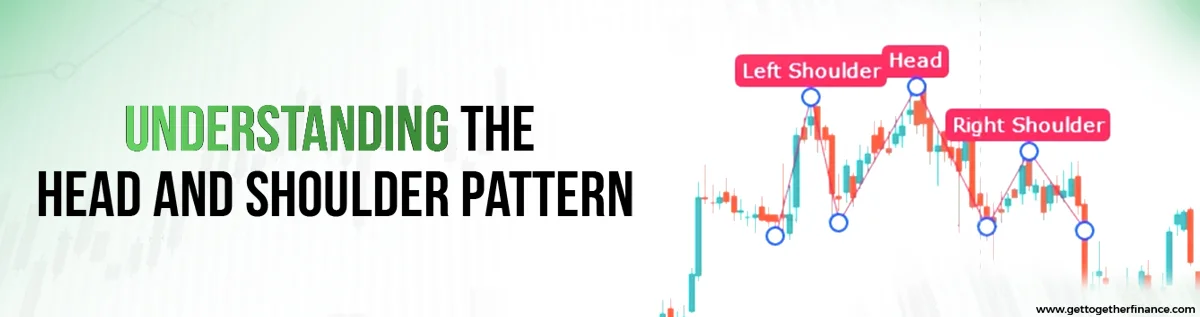
We have heard the buzz about the Head and Shoulder pattern, right? Well, get ready to unlock the secrets of this powerful tool in technical analysis. It’s like having a crystal ball for spotting potential trend changes.
Head and Shoulder Top Pattern: A Sneak Peek
This pattern is a bit like a dance routine on the stock chart. Imagine it like this:
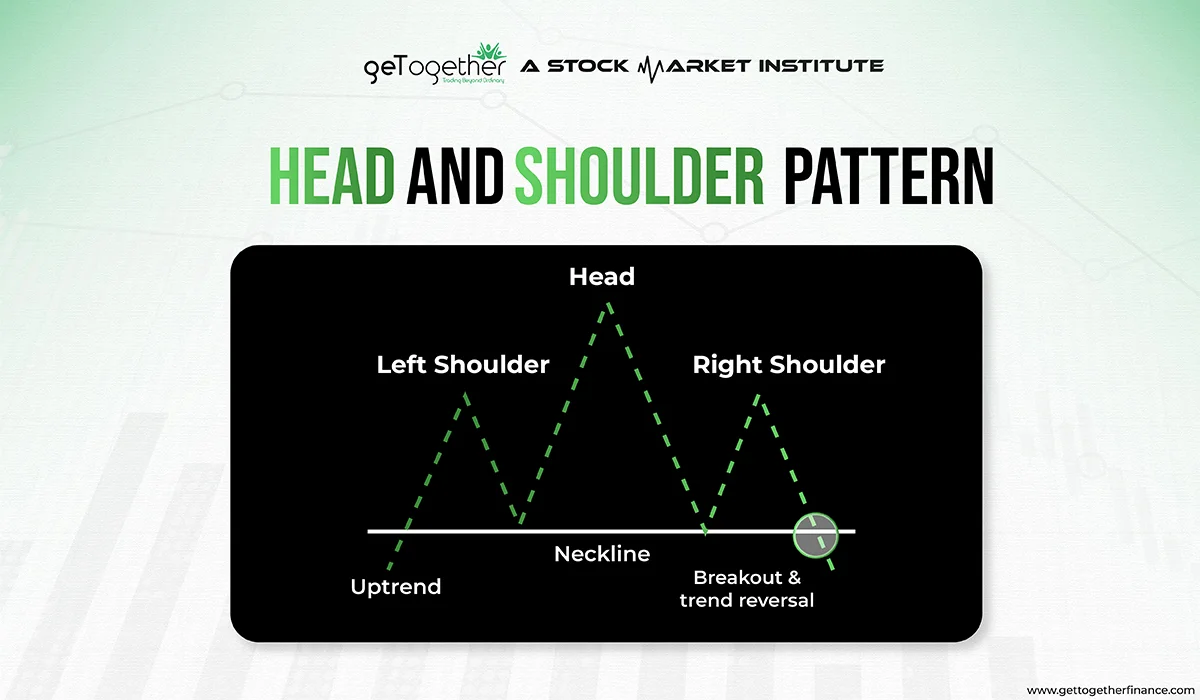
- Left Shoulder: The market’s on a high, reaching a peak.
- Head: A higher peak – the star of the show, in the middle.
- Right Shoulder: Another peak, like a backup dancer.
Connecting the valleys between these peaks creates the neckline. It’s like drawing the outline of the dance floor.
Now, here’s where the story gets interesting. When the price breaks below the neckline, it’s like the music changing. This pattern suggests the trend might flip – from up to down. Pay attention to the little details, or you might miss the huge change coming further.
But Wait, There’s More – Inverse Head and Shoulder
Flip the script, and you’ve got the Inverse Head and Shoulder pattern. This one’s like a twin – the same steps, but in reverse. When the price breaks above the neckline, it signals a potential shift from a downtrend to an uptrend.
Why It’s a Big Deal
The Head and Shoulder pattern isn’t just any old trick. It’s got some serious street cred:
- Trend Reversal: It’s like a market whisperer, hinting at trend changes before they happen. A signal that the party might be taking a new direction.
- Historical Proven: Think of it like a classic movie that never gets old. Traders have seen this pattern play out time and again, making it a reliable tool.
- Entry and Exit Moves: When the neckline breaks, it’s like a starting gun. Traders jump in near this break, setting stop-loss orders for safety. Exit strategies come into play as the price hits target or shows signs of turning.
- Price Targets: Traders use math magic to estimate potential price targets. They measure the pattern’s height from the neckline break, giving a hint of how far the price might move.
But remember, while the Head and Shoulder pattern is a star player, it’s not the whole show. Combine it with other tools and analysis for a complete trading strategy. So there you have it – the Head and Shoulder pattern, your VIP pass to understanding trend changes like a pro.
Inverted Head and Shoulder Pattern:
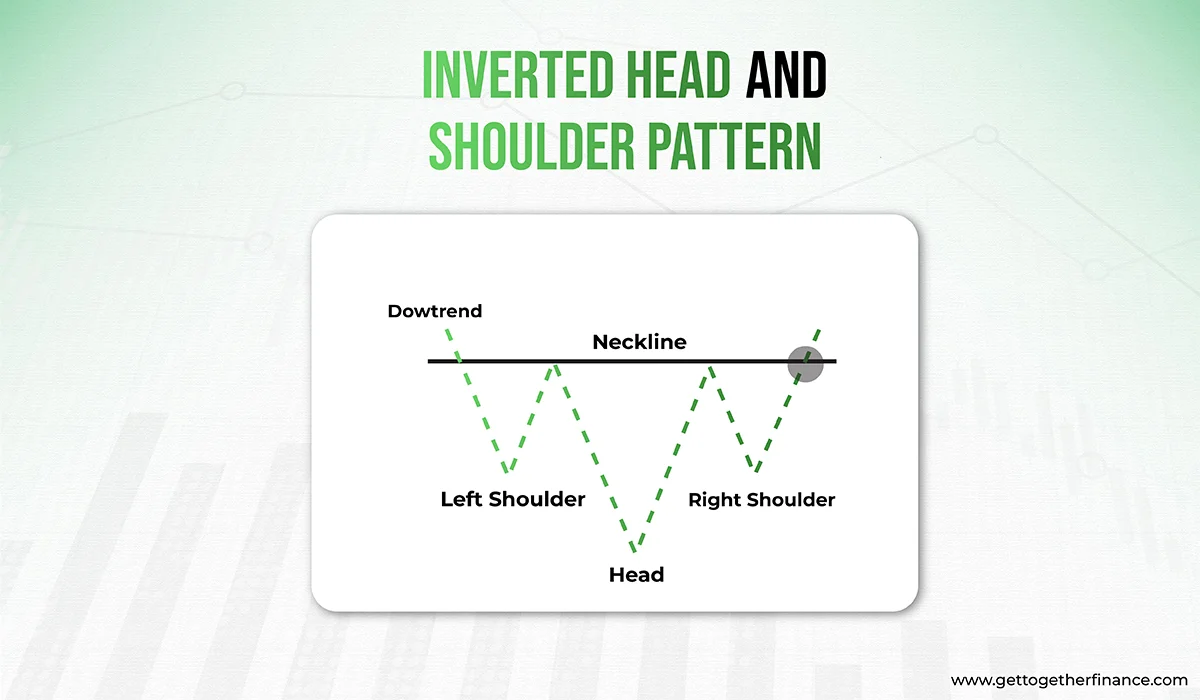
Wait, we’ve got a surprise twist – the Inverse Head and Shoulder Pattern! Let’s put more light onto this. Think of it as the “good news” cousin which is the opposite of the Head and Shoulder pattern. Also known as a bearish reversal pattern, the inverse Head and Shoulder pattern is a special shape that can appear on stock charts. It’s like a cousin of the regular Head and Shoulder pattern, but it shows up in a different situation.
Here’s how it works:
- Left Shoulder: Just like before, there’s a bump on the left side. It’s a small hill in the stock’s price, but this time it’s at the bottom.
- Head: In the middle, there’s a bigger bump that’s the lowest point. Imagine it like a valley.
- Right Shoulder: On the right side, there’s another bump, similar to the left shoulder but a bit higher.
These bumps are linked by a line at the bottom, kind of like a “necklace.” And wait! there is more. When the price of any stock hits higher than this line, it could mean that the market is changing, and the price might start rising up.
In a regular H & S pattern, it might signal that the price could go down, but the Inverse H&S pattern hints that the price might go up after a bit of falling.
Think of it like flipping a regular picture – it’s like the stock saying, “Hey, I’ve been going down, but I might be getting ready to go up.”
But remember, just like with the regular pattern, the Inverse Head and Shoulder pattern is one tool that traders use. They combine it with other tools and information to make smart decisions about buying or selling stocks.
Also Read: Bearish Candlestick Patterns
How to use Head and Shoulder Pattern to Trade?
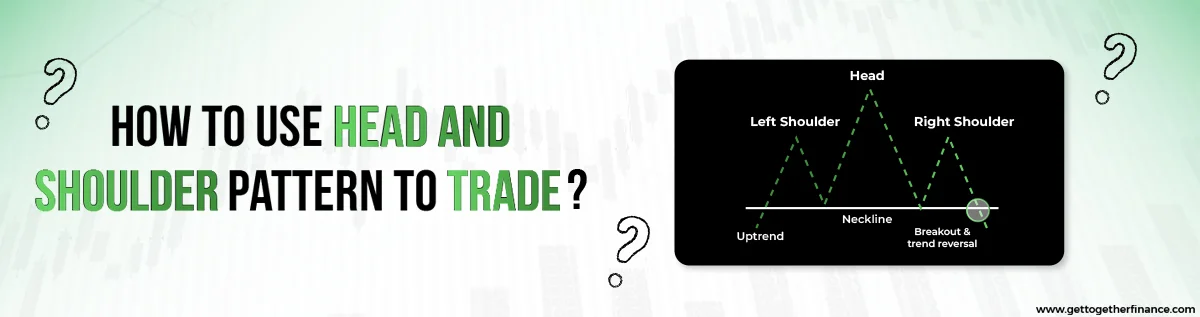
Using the Head and Shoulder pattern to trade is like having a secret map to navigate the stock market. Here’s a step-by-step guide on how to make the most of this pattern:
Confirming a Trend Turnaround (Entry Game)
When the pattern is all set and sealed with a neckline break, you’re looking at a pretty solid sign of a trend about to flip. This is when traders decide to gracefully step out of their current positions – it’s like catching the last train before it switches tracks.
Entry and Exit Points (Safety Nets)
Picture this: traders hop on board right after the neckline break – it’s like grabbing a front-row seat for a show. To keep risks in check, they set up a safety net with stop-loss orders. For those betting the price goes down (short positions), the safety net hangs above the pattern’s highs. And for those thinking it’s going up (long positions), it’s below the pattern’s lows.
Quick-Tip: Traders might even exit if the market bounces back above the neckline (in a Head and Shoulder top) or dips below it (in a Head and Shoulder bottom) – it’s like knowing when to leave the party early.
Aiming for the Bullseye (Price Target Math)
Time for a little math magic: traders start measuring the pattern’s height from where the neckline breaks – kinda like measuring from a diving board to the pool. This gives us a clue about how much the prices might go up or down. But wait, there’s more to it. Traders mix in some other tools and market vibes to make their predictions even better. It’s like adding different ingredients to cook up a tasty recipe for success.
Remember, the Head and Shoulder pattern is like a single puzzle piece. To get the full picture, you need to blend it with other analysis methods and tools. The market can be unpredictable, with conditions shifting unexpectedly. So, it’s smart to stay in the know and be adaptable with your trading choices. Patience, practice, and continuous learning are key to succeed in this pattern and become a successful trader.
What Does the Head and Shoulder Pattern Tell You?
The Head and Shoulder chart is like a map that traders use to predict changes in trends. It’s like a signal that tells us when a trend might be ending and a new one could start. This pattern is known for its reliability in showing when a trend is about to switch directions.
When you see a Head and Shoulder pattern, it’s like the market saying, “Hey, the good times might be coming to an end.” But how does it work, let’s find out:
- Suppose the stock price begins going up and hits a point, let’s say RS 100. This is like the first stop of stock.
- But then, the price goes down a bit to a certain level, like RS 80. This is like a rest stop for the stock.
- The price bounces back up and goes above RS 100 again, but it can’t go much higher. It’s like the stock is struggling to keep moving up.
- The price goes down to the rest stop again, at RS 80. But now, it’s going to be like the stock is taking a breather.
- Now, the price tries to rise up to RS 100 again, but it can’t go beyond that point. Like it’s hitting a wall.
So, what does this mean? Well! Those charts are dropping hints that the good times might be wrapping up. The big momentum that lifted the price is slowing down. This could be a sign that the upward trend is getting ready to switch gears.
And surprisingly, there’s a cousin of this pattern “inverse Head and Shoulder.” is just like the mirror image of H&S Pattern. If you see a reverse pattern, it’s a good omen telling you that the bad time is about to turn around. It’s like a hint that the downward trend might be losing steam.
Note: These patterns are just tools. Traders use them along with other tricks to make smart decisions. It’s like having a secret code to help understand what the market is trying to say.
Why the Head and Shoulder Pattern Works
Imagine a classic hit song that never loses its charm – the Head and Shoulder pattern is like that in the trading world. And as the pattern forms, it’s like the rhythm of the market changing. Let’s explore the mystery and understand why this pattern is a reliable sidekick in the world of trading:
- Trend Decoder: Like translating market signals into plain English.
- Change Predictor: Waves a flag before trends do a U-turn.
- Crowd Wisdom: It’s the cool kid everyone follows, making it more reliable.
- Visual Clarity: Clears the market noise, highlighting trend shifts.
- Trader’s Instinct: Appeals to gut feelings and smart moves.
- Repeat Performer: Like a chart superstar, nailing predictions time and again.
Imagine having a market whisperer, trend predictor, and chart superstar all rolled into one pattern – that’s the magic of the Head and Shoulder!
The Pitfalls of Trading Head and Shoulder

Perfection is a myth and like every other thing in the world, the H&S pattern is also not perfect. We have listed some limitations and downsides to understand the market flaws that may cause you major loss if not considered:
- False Alarms: Sometimes, the pattern plays coy and then changes its mind.
- Crowded Party: Since many traders watch, false signals can spread like wildfire.
- Early Birds Get Burned: Jumping the gun can lead to losses if the pattern isn’t fully formed.
- Market Curveballs: Unexpected news or events can disrupt the pattern’s prediction.
Think of it like navigating a maze – there are twists and turns you didn’t see coming. The Head and Shoulder pattern is a cool tool, but like any superhero, it has its kryptonite moments too.
Advantages and Disadvantages of the Head and Shoulder Pattern
Every coin has two sides, just like the ‘Head and Shoulder’ pattern. While it’s a reliable companion, it’s not foolproof. Think of it as a Bollywood dance – graceful and entertaining, yet requiring additional moves to make it perfect. Understanding what are the pros and cons (downsides) of Head and Shoulder pattern is as important in the stock market as investing wisely is to grow your wealth. Here’s a snapshot of the pattern’s advantages and disadvantages:
| Advantages | Disadvantages |
| Predicts potential trend reversal | Not foolproof |
| Offers insights into market mood | False signals possible |
| Based on historical success | Requires complementary analysis |
| Widely recognized among traders | May not apply to all situations |
It doesn’t have to be a complex and lengthy process to spot a pattern. Just by observing the candlestick patterns of demand and supply, you can quickly predict changes. There are handy cool tools, like the GTF Indicator, that can help you identify these candlestick patterns based on stock demand and supply. With these tools, you’ll get a clearer grasp of the market’s movements and trends.
How Reliable Is a Head and Shoulder Pattern?
Think of the Head and Shoulder pattern as your trusty market compass – it usually points you in the right direction, but like any journey, there can be surprises along the way. This pattern has a solid track record of signaling trend reversals, and traders often depend on its insights to make informed decisions. It’s like that friend who’s usually right about predicting which way the wind’s gonna blow, but hey again, nobody’s perfect, right?
The reliability of the Head and Shoulder pattern rest on a few factors;
- First, the pattern’s formation needs to align closely with the classic structure – the head flanked by two shoulders and a neckline.
- Secondly, the confirmation of a trend reversal comes with a neckline break. Yet, even when these stars align, external forces like sudden news, market sentiment shifts, or unexpected events can throw a curveball into the mix.
It’s like using a GPS for a road trip – it’s a fantastic tool, but road closures or diversions might still pop up. Traders often complement the pattern’s insights with other technical analysis tools, trend confirmation signals, and their market experience. This layered approach helps them navigate potential false alarms and ensures a well-rounded strategy.
So, it’s like having a weather app that’s usually right but might miss the mark during a surprise rainstorm. Traders use their gut, other tools, and a sprinkle of market wisdom to double-check the pattern’s hunch. It’s all about having a balanced approach – like tossing an umbrella in your bag, just in case.
Can Head and Shoulder Turn Bullish?
Absolutely! Just like a chameleon changing colors, the Head and Shoulder pattern can switch sides and turn all bullish on us.
Here’s the scoop: while the classic Head and Shoulder pattern often points to a trend reversal from bullish to bearish, its cousin – the Inverse Head and Shoulder – flips the script. This pattern is like a market magician, suggesting that a bearish trend might be ready to transform into a bullish one.
Imagine this: Instead of those three peaks and valleys, you’ve got three dips and bumps. The middle one is lower, while the flanking ones stand taller, like two friends lifting you up. Link these higher points with a neckline, and when the price dashes above it, ta-da! The pattern is shouting, “Hey, it’s bullish time!”
In Conclusion
Head and Shoulder Pattern is like having a cool treasure map and serves as a valuable tool in your trading arsenal.. Think of it like your market GPS, guiding you through twists and turns, never trust it blindly or you might end up at a dead end. Blend it with other tools, throw in a dash of your gut feeling, and boom – you’re on your way to becoming a trading rockstar. Remember, successful trading is a blend of strategy, stock market knowledge, and adaptability.
FAQs
Q: How reliable is a Head and Shoulder Pattern?
A: Like a weather forecast, the Head and Shoulder pattern isn’t 100% foolproof. While it often hits the mark, unexpected market shifts can play spoiler. It’s a smart tool, but keeping a watchful eye on other signals is like having an umbrella handy – just in case.
Q: How often does the Head and Shoulder Pattern occur?
A: The pattern is like a market guest – it shows up when it’s ready. While it’s not an everyday occurrence, keeping an eye out for its distinctive shape can help you spot potential trend shifts.
Q: How do I spot false signals from the Head and Shoulder Pattern?
A: False signals are like sneaky tricksters in the market. Keeping an eye on volume, confirming with other indicators, and ensuring that the pattern is fully formed before making a move can help you avoid falling for their pranks.
Q: Are there variations of the Head and Shoulder Pattern?
A: Indeed! The pattern has a creative side, with variations like the Inverse Head and Shoulder and the Reverse Head and Shoulder. These cousins offer different insights into potential trend changes, adding more arrows to your trading quiver.
Q: Is the Head and Shoulder Pattern a guaranteed trend reversal signal?
A: No tool is foolproof, and the same goes for the pattern. While it’s a reliable indicator, combining it with other analytical techniques can provide a more comprehensive view of market trends.


