Bearish Candlestick Patterns: Key Identification Factors, Advantages & Challenges
- Updated on : May 25, 2026
- 10146 Views
- by Arun Singh Tanwar

 Facebook
 Instagram
 Youtube
Overview
Candlestick chart patterns have been long used by traders and investors and there are several types of candlestick patterns, but on the wide view, they are categorized into two types: bearish candlestick patterns and bullish candlestick patterns. In the past few decades, stock market trading has seen many advancements. One of the major advancements or learning that people have witnessed is candlestick chart analysis. The candlestick chart analysis helps in identifying market sentiments at the current time for the particular stock. It helps in making the right move in the trade at the right time.
What are Bearish Candlestick Patterns?
The patterns that indicate the price of the stock is forecasted to go down are called bearish candlestick patterns. In the stock market, there are two types of investors or traders. The first is bulls of the market always aim to buy the stock at a low price and further sell it at a higher price. On the other hand, bears of the market always aim to sell the stock at a high price and buy it later at a low price. This concept is also known as short selling. When the bears are successful in bringing down the price of stock, a downtrend in the chart can be observed.
What Are the Key Factors When Identifying Bearish Candlestick Patterns?
Identifying bearish candlestick patterns correctly is important because not every pattern leads to a price decline. Traders should always evaluate the overall market context before acting on bearish candlestick patterns. Several factors help traders determine whether a bearish candlestick pattern is strong or weak.
Trend Direction
Most bearish candlestick patterns work best when they appear after a strong uptrend. When a pattern forms after a bullish rally, it often signals that buyers are losing strength and sellers may start dominating the market.
Location of the Pattern
The position of the bearish candlestick pattern on the chart plays a major role. These patterns tend to work better when they appear near important price zones such as:
- Resistance levels
- Supply zones
- Previous swing highs
These areas often attract selling pressure.
Confirmation Candle
Professional traders usually wait for confirmation before acting on bearish candlestick patterns. A follow-up red candle after the pattern suggests that selling pressure is increasing.
Volume Support
Volume also helps validate bearish candlestick patterns. When higher selling volume appears during the formation of the pattern, it increases the probability of a downward move.When these factors align together, bearish candlestick patterns become more reliable signals for trade
How to Trade Bearish Candlestick Pattern
In the simplest language, candlestick patterns are the technical analysis tool that displays the movement of the stock price over a certain time frame. By closely analyzing the candlestick patterns supported with advanced technical analysis, one can forecast future price movements of the stock.
There are two types of candlestick patterns, bullish candlestick patterns and bearish candlestick patterns. Here, we are going to talk about bearish candlestick patterns. The bearish candlestick patterns show that the price of the stock may decline in the coming time. This signifies a good time to short positions in the market. But, there are different bearish patterns, and one should know how to trade them.
While trading in bearish candlestick patterns one should look for quick price movements because short trade can only be executed within a day. Since there’s no option for carrying it forward, one should analyze it accordingly. Here’s what you can do:
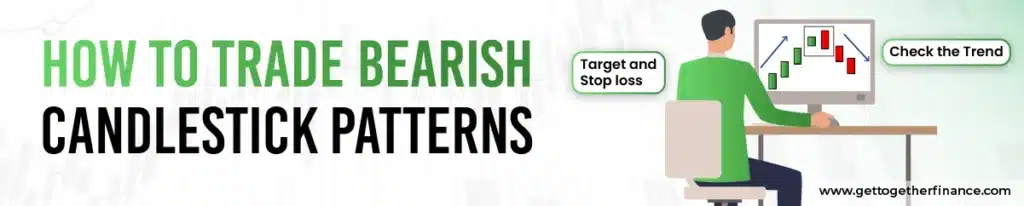
Check the Trend: The trend of the price chart should be downward when you decide to take a bearish trade. Otherwise, the price may go in an unfavorable direction.
Entry: Take entry at the point where you spot a bearish pattern supported by a strong supply zone (to know about demand and supply zones, click here).
Target and Stop loss: The target and Stop loss should be placed in the ratio of 1:2 from the entry point.
Trading a bearish pattern is risky when the overall trend isn’t in a favorable direction. Check all the aspects of the trade before entering in short trade. Further, we’ll discuss how to trade in individual bearish candlestick patterns.
How To Use Bearish Candlestick Patterns to buy/sell stocks?
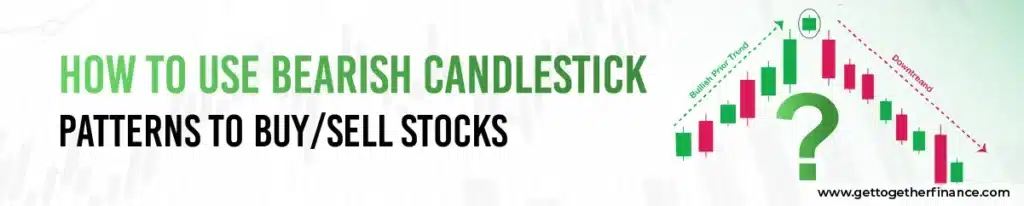
Bearish candlestick patterns should be used in selling the stock first and buying it later after it falls. Here’s how you buy and sell:
- Selling: When you have a strong bearish pattern forming in the chart, you sell the stock and aim for it to fall.
- Buying: After the stock falls to your target region, you buy it. The difference between the selling and buying price signifies your profit level.
The simple formula of buy low sell high is used in short trading. The catch is to use it in the reverse way.
Also Read: Bullish Candlestick Patterns
Which Candlestick Patterns are Bearish?
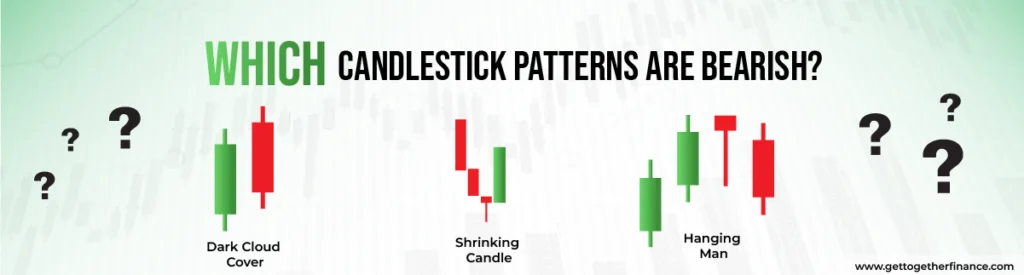
There are several bearish candlestick patterns. All the patterns signify that the price of the stock may fall after the pattern completion. But, one needs to check all the other aspects of the trade before trading in any of these patterns. Here are the most used bearish candlestick patterns:
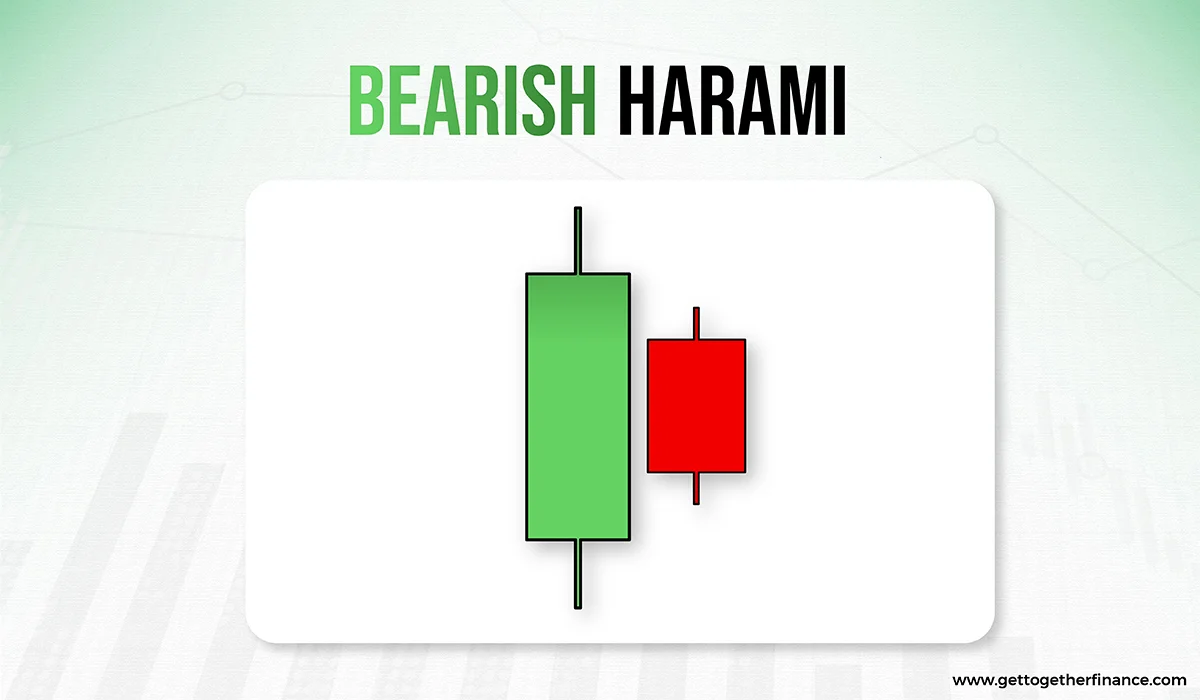
1. Bearish Harami
It is a candlestick pattern that indicates a reversal of a bullish trend. A red candle is formed after an uptrend. This red candle is smaller than the previous green candle, indicating the reversal trend in the stock movement. Bears take advantage of these bearish candlestick patterns and take entry into the trade, as the price is forecasted to go down after this pattern. Bears make a profit by selling the stock at the start of a downtrend and buying the stock at the end after making profits during the rally.
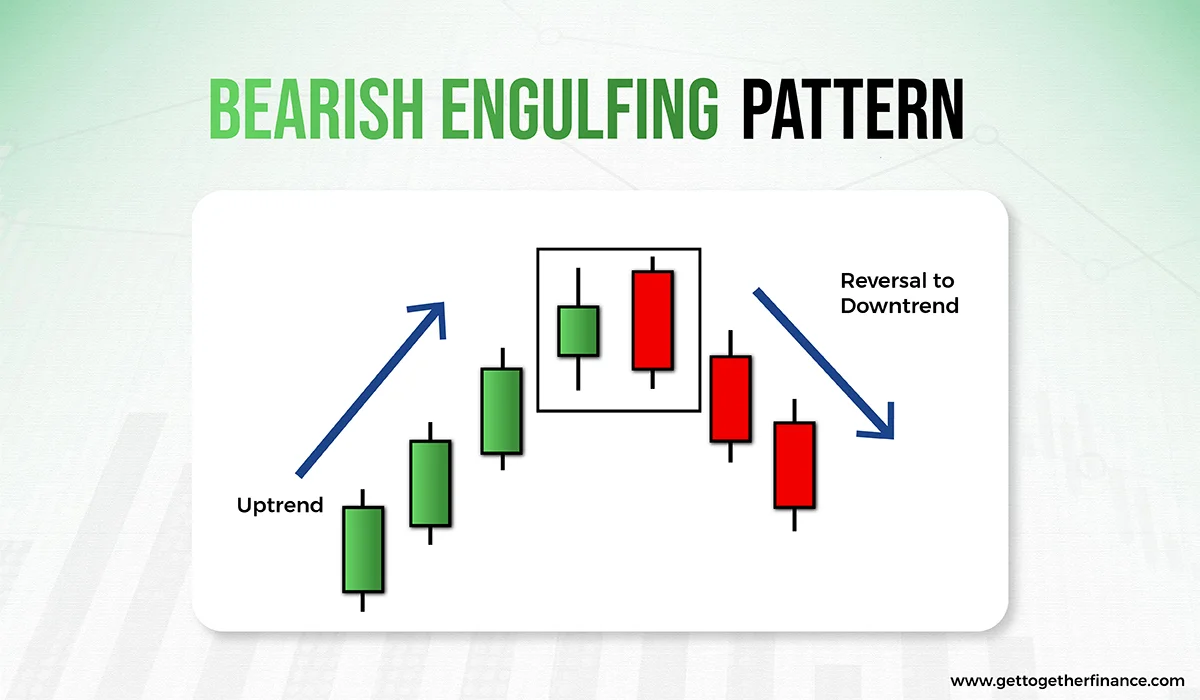
2. Bearish Engulfing
It is one of the most prominent and promising bearish candlestick patterns in technical analysis. It is formed when the red candle totally engulfs or covers the previous green candle from top to bottom. Usually, it is seen after consecutive green candles, and the formation of a bearish engulfing candle indicates the break in an uptrend and the start of a new downtrend. Traders or bears take entry at this point which surges the selling pressure, which in turn leads to the downward movement of stock.
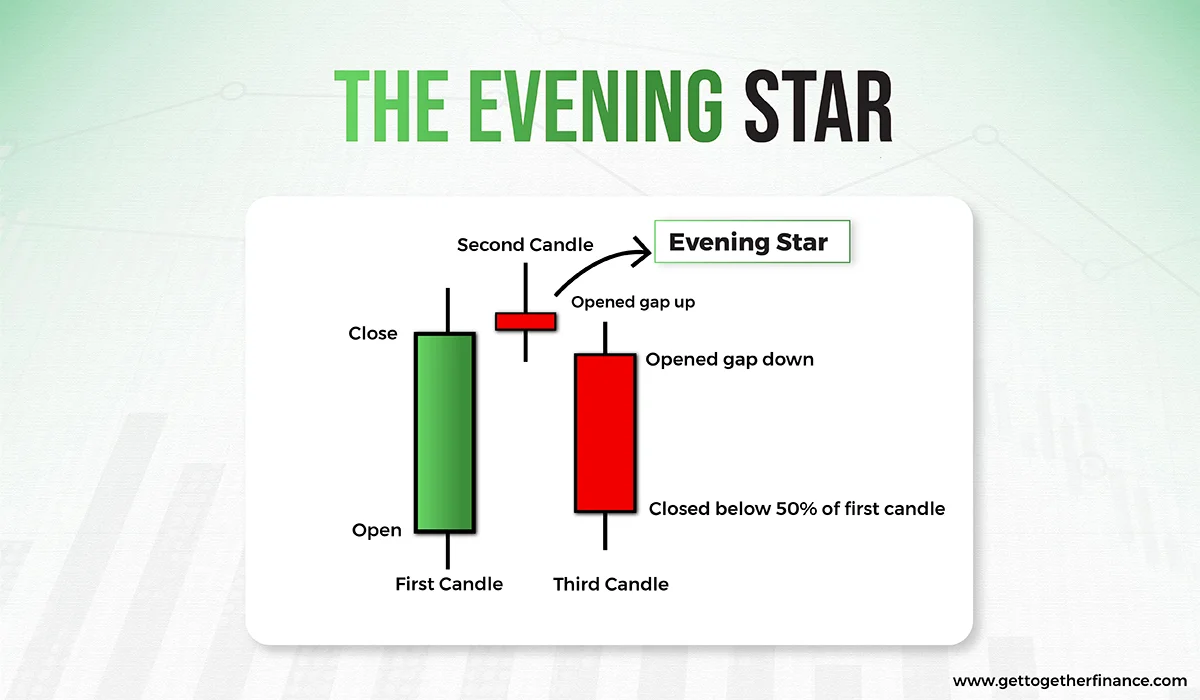
3. The Evening Star
This pattern comprises three candlesticks: a bullish candle, a base candle or doji, and a bearish candle. After consecutive green candles, when traders or bulls of the market get indecisive about buying the stock, a doji or base candle is formed at the resistance zone. After, doji, a new red candle is formed that signals the start of a downtrend. Collectively, these three candles form a pattern called the evening star. It indicates a new downward rally and signals the start of a downtrend in the market. Traders or bears usually take entry into the trade when this pattern appears at the resistance zone.
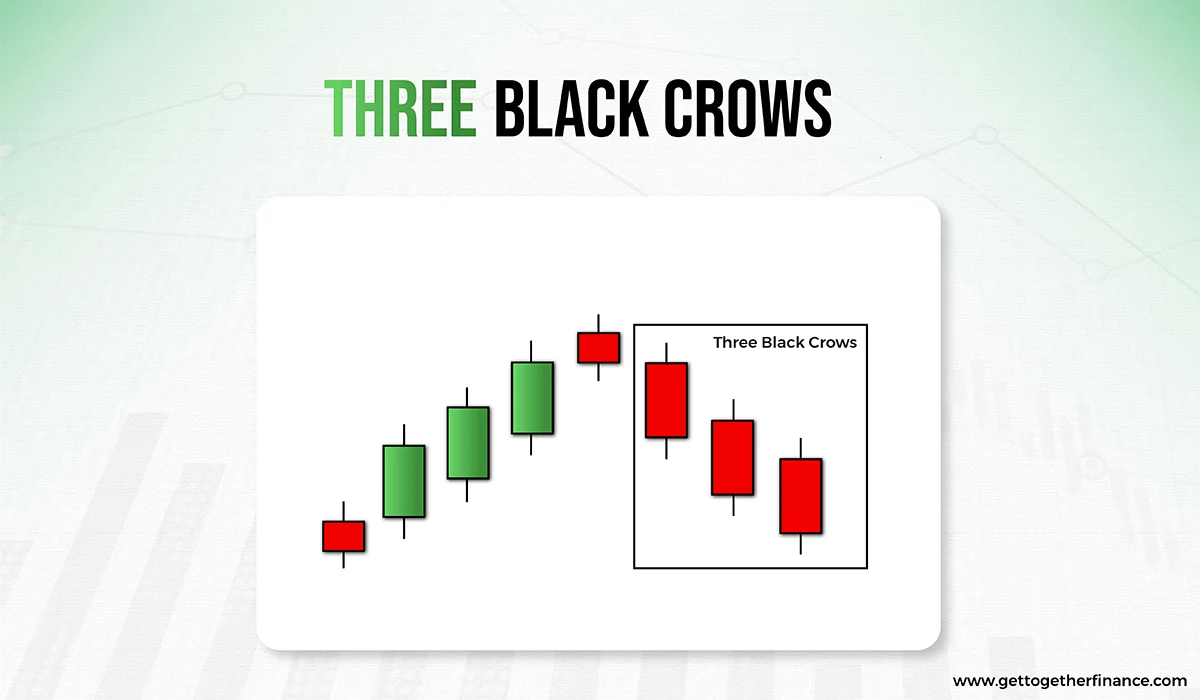
4. Three Black Crows
One of the most prevalent and easiest bearish candlestick patterns to understand is three black crows. A rally of three consecutive red candles after an uptrend can be seen in this pattern, this indicates the downtrend in the stock. These red candles do not have long wicks, instead have a long body indicating positive selling behavior. In this scenario, the bears overtake the bulls of the market, which leads to a decrease in stock price. After moving from the resistance zone, the formation of three black crows can increase the probability of successful short trading.
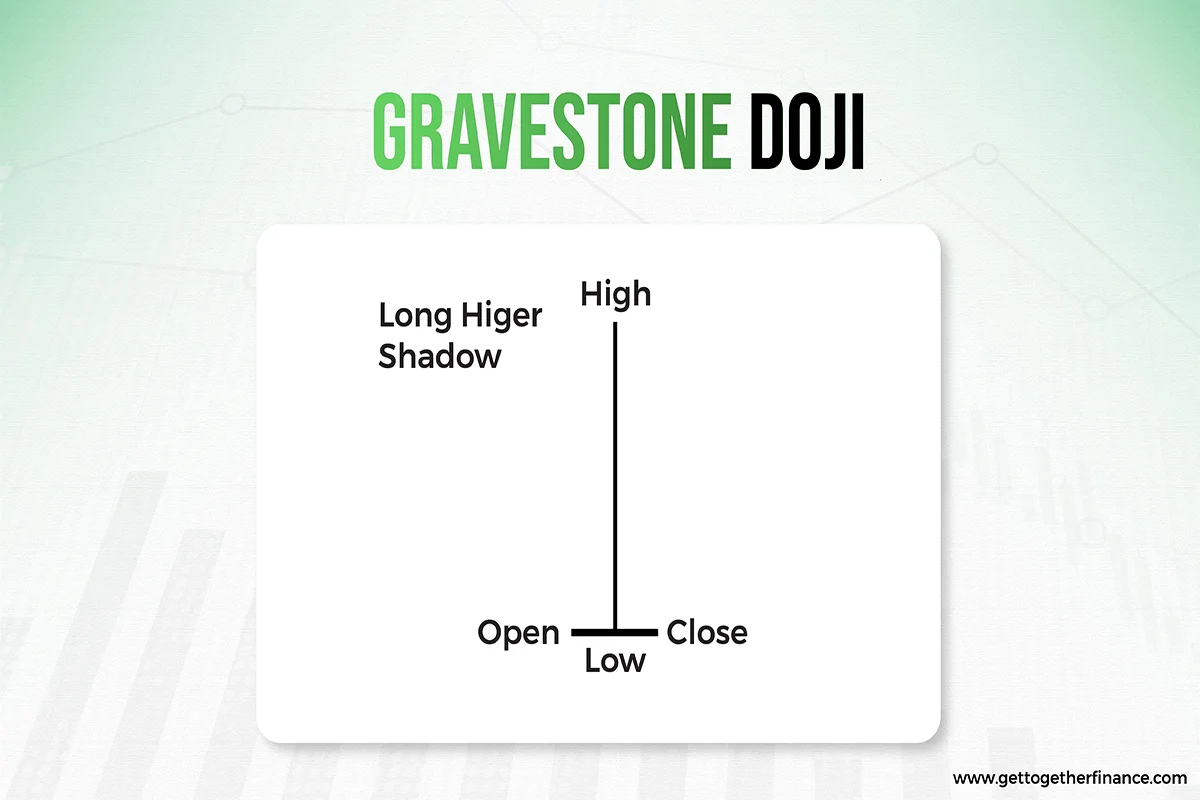
5. Gravestone Doji
This is one of the most uncommon and complex bearish candlestick patterns in the candlestick chart, and many people fail to recognize and use it. This pattern of candlesticks has a long wick on the upper side and a very small body at the end, indicating the nominal difference between the opening and closing price. A Gravestone doji candlestick is a price action pattern that can be found both on support and resistance zones and traded respectively. When the Gravestone doji pattern appears in the uptrend, the possible reversal of the trend is forecasted.
Whereas, when this pattern is formed in a downtrend, then the buyers are getting indecisive about buying the stock, often, continuation in the downtrend is seen. Hence, it is a complex pattern. The Gravestone doji pattern is less significant in non-trending markets as it creates indecision for the traders, as markets are not certain during these times.
6. Dark Cloud Cover
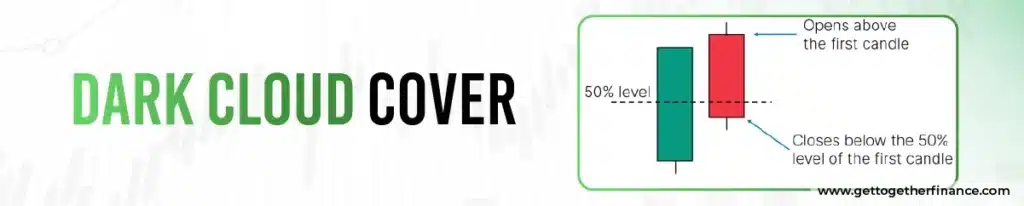
This pattern is formed when a strong red candle is formed after the green candle of an uptrend. This red candle is opened at a point a bit higher than the closing of the previous green candle. At the start, it may look like the trend is going to continue, but push by sellers brings the price down, resulting in making a red candle. This red candle is usually closed in the middle of the previous green candle. After this, a successive red candle is also formed, confirming a bearish movement or trend reversal.
There are certain criteria that you need to confirm before trading in dark cloud cover:
- Gap up opening brought down by sellers
- Strong red candle
- Strong uptrend
- The closing point of red candle is almost in the middle or below the previous green candle
- Follow up red candle
7. Shrinking Candle
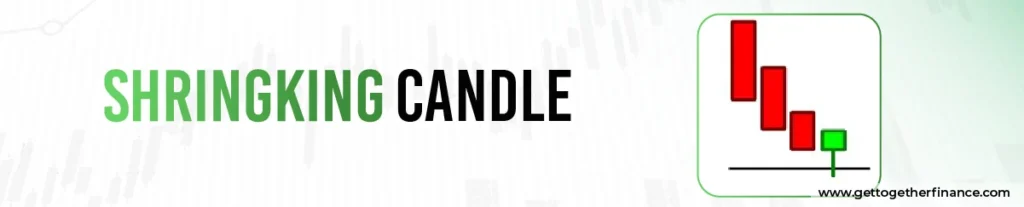
It is another excellent bearish pattern with logical conditioning of demand and supply. It is identified when an uptrend slows down with small candles. It includes multiple candles, where each candle is smaller than the previous candle. The shrink in candles is the result of a decrease in buyers and an increase in sellers for the stock or the asset. Resulting in a decline in the pace of the uptrend. By analyzing and combining it with bearish aspects, it can work as an excellent bearish trade indicator in every time frame.
8. Hanging Man

This is formed usually at the peak of an uptrend. After a strong uptrend when a red candle is formed similar to a hammer pattern, it is called a hanging man. It signifies that the price tried to continue the trend, but, the pressure created by sellers made it a hammer-type pattern. Here, the red candle with longer wick, shorter body or very little to negligible upper wick.
The hanging man pattern is not confirmed unless the price decreases in the following session or shortly thereafter. Following the hanging man, the price should not close above the hanging man candle, since this could imply further market rise. If the price of the next candle falls after the hanging man candle, the pattern is confirmed, and candlestick traders employ it to liquidate long holdings or enter short positions.
Use Other Tools With Bearish Reversal Patterns

A strong trade setup is the one that has confirmation from all aspects. The candlestick pattern should not be the only criterion for trading in bearish patterns. You need to look into others and take help of tools like:
- EMA: The 20-candle Exponential Moving Average should be taken into account while studying the pattern. This often works as a resistance to the price going in either direction.
- Demand and Supply Knowledge: Check where the quality supply zones are formed and whether your bearish pattern is falling in the same range for enhanced accuracy.
- RSI and Stochastic: These indicators are easily available in the candlestick chart tools. If the RSI is higher than usual, the bearish pattern may be correct. Further, convergence and divergence indicated by the stochastic indicator help in understanding the future price movement of the stock.
Advantages of Using Bearish Candlestick Patterns in Trading

Many traders rely on bearish candlestick patterns because they provide valuable insights into market sentiment and potential price reversals. One of the biggest advantages of bearish candlestick patterns is that they visually show when selling pressure starts increasing in the market.
Here are some key benefits of using bearish candlestick patterns in trading.
1. Early Signal of Market Reversal : Bearish candlestick patterns often appear near the end of an uptrend, helping traders detect a possible trend reversal before a major price drop happens.
2. Easy to Recognise: Most bearish candlestick patterns have clear visual structures, making them easier to identify on candlestick charts even for beginner traders.
3. Helps Identify Short-Selling Opportunities: Traders use bearish candlestick patterns to identify situations where they can sell first and buy later at a lower price.
4. Works Across Different Markets: Another advantage is that bearish candlestick patterns are not limited to stocks. Traders use them in several financial markets, including:
- Stock market
- Forex market
- Commodity market
- Cryptocurrency market
Can Be Combined With Other Indicators: The effectiveness of bearish candlestick patterns improves when they are combined with other technical tools such as:
- RSI indicator
- Moving averages (EMA)
- Supply and demand zones
Using multiple confirmations helps traders improve the accuracy of their trades.
Challenges of Using Bearish Candlestick Patterns and How Traders Can Overcome Them?
While bearish candlestick patterns are powerful tools in technical analysis, they are not always perfect. Traders may face certain challenges when relying only on candlestick patterns. Understanding these challenges can help traders use bearish candlestick patterns more effectively.
1. False Signals in Sideways Markets
Sometimes bearish candlestick patterns appear when the market is not trending. In such conditions, the pattern may fail and the price may continue moving sideways. To reduce this risk, traders should always check whether the market is in a clear uptrend before trading bearish patterns.
2. Entering the Trade Too Early
Another common mistake is entering a trade before the bearish candlestick pattern is fully confirmed.
A safer approach is to wait for:
- A confirmation candle
- Increased selling volume
- Additional technical indicators
3. Ignoring Important Price Levels
Trading bearish candlestick patterns without considering support or resistance levels can lead to inaccurate signals.
Traders often improve their success rate by combining bearish candlestick patterns with:
- Resistance levels
- Supply zones
- Trend analysis
4. Overtrading Every Pattern
Not every bearish candlestick pattern leads to a strong downward move. Entering trades on every pattern can increase risk.Instead, traders should focus on high-probability setups where multiple factors align. By understanding these limitations and applying proper confirmation methods, traders can use bearish candlestick patterns more confidently and effectively.
Difference Between Bearish and Bullish Candlesticks Patterns
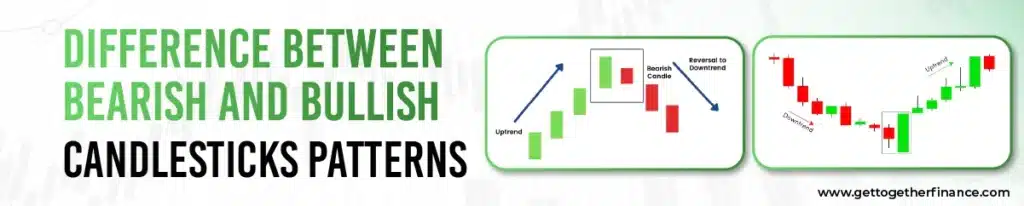
In candlestick chart analysis, traders commonly use both bearish candlestick patterns and bullish candlestick patterns to understand market direction. While the structure of the candles may look similar, the key difference lies in what they signal about price movement.
In simple terms:
- Bearish candlestick patterns signal that the price may fall.
- Bullish candlestick patterns signal that the price may rise.
Here are the main differences traders consider.
Market Sentiment
- Bearish candlestick patterns indicate that sellers are gaining control of the market.
- Bullish candlestick patterns indicate that buyers are dominating.
Trading Strategy
Traders interpret these patterns differently depending on their market view:
- Bearish candlestick patterns are often used for short-selling opportunities.
- Bullish candlestick patterns are used to identify buying opportunities.
Expected Market Direction
Another clear difference is the expected trend movement:
- Bearish candlestick patterns often appear near the top of an uptrend and signal a potential downtrend.
- Bullish candlestick patterns typically appear near the bottom of a downtrend and signal a potential upward move.
Understanding both patterns helps traders make better trading decisions and avoid entering trades in the wrong direction.
Bottom Line
Bearish candlestick patterns help in detecting the downtrend in the stock. It helps the bears of the market in short sell their stocks at a high price and again buy it at low prices. Though candlestick chart patterns play a great role in technical analysis, traders need to learn them thoroughly. There are times when traders make sudden moves in the market when the pattern has not completely formed. This can lead to losses if the pattern is not formed as predicted. Therefore, it is important to study technical analysis well with the help of expert instructors.
FAQ
What is the 3 candle rule in trading?
How can you tell if a candle is bearish?
What are some of the key bearish reversal patterns and how many candlesticks do they require?
Bearish Engulfing Pattern: This pattern involves two candlesticks, with the body of the second candle(should be red) engulfing the whole body of the previous bullish candle(should be green).
Evening Star: This is a three-candlestick pattern. It begins with a giant bullish candle, then a smaller candle with a short body, and finally a bearish candle with a body that covers the previous candle’s body.
Dark Cloud Cover: This takes two candlesticks, with the second candle opening higher than the preceding bullish candle but closing below its midpoint, indicating a possible reversal.
What conditions should be met for a pattern to be considered a bearish reversal?
Prior Uptrend: The pattern should appear following a strong upward price trend.
Confirmation of Pattern Formation: Confirmation occurs when the pattern completes according to its entailed structure.
Help of indicators: Additional technical indicators, such as RSI or MACD, that align with the reversal signal increase its reliability.
Price Confirmation: Subsequent price action that matches the reversal pattern strengthens the possibility of a negative trend.
What other technical analysis methods can be incorporated to increase the robustness of bearish reversal patterns?
Levels of Support and Resistance: Confirming the pattern’s occurrence around important support/resistance levels increases its importance.
Divergence in Oscillators: Bearish reversal patterns that coincide with bearish divergence in oscillators such as RSI or MACD provide additional corroboration.
Convergence and Divergence: Convergence of patterns with trendlines or breakouts validates the potential reversal.
How do volume-based indicators help in confirming reversals?


