Moving Averages : A Comprehensive Guide to Predicting Price Trends
- Updated on : May 23, 2026
- 4020 Views
- by Arun Singh Tanwar

 Facebook
 Instagram
 Youtube
Overview
You know what’s funny in the world of trading and investing? Moving averages! They are like those sacred cows. Traders totally swear by them, investors rely on them, and financial gurus can’t help but talk about how great they are. But hey, let’s chill for a moment, have a real talk about these moving averages, and see are they really the cash cows of the financial world like everyone says.
What is a Moving Averages (MA)?
Just imagine, you have a jar of candies, and every day, you add one more candy to the jar. You want to know, on average, how many candies you’ve been adding each day for the past week. So, you take the total number of candies and divide it by the number of days. That’s your moving averages. Easy, right?
Simply, moving average is like a helpful stock indicator used for technical analysis. They show the estimated price over a certain time, like the past 10 days or 50 days. In trading, it helps folks decide whether to buy or sell something based on how its price has been changing.
In layman terms, MAs are like detective tools, used to figure out which way a stock is moving (direction). It helps spot where its price might stop going up or down for a bit. They are called “lagging” because they rely on past prices to give us these clues. It’s a bit like looking at yesterday’s weather to guess what today’s weather might be like.
Moving Averages is a general word used for different averages which is later classified into Simple Moving Averages and Exponential Moving Averages. It should be applied on execution time frame only.
What is a Lagging Indicator? – A Brief Note
A “lagging indicator” is a term used in finance and economics to describe an indicator or measurement that reacts to changes in economic conditions after they have occurred. In simpler terms, it’s like looking in the rearview mirror to see where you’ve been rather than looking ahead to where you’re going.
For instance, if you’re using a lagging indicator in the stock market, it would provide information based on past price movements or trends. It’s useful to review historical trends and confirm a trend that has already started. But, it may not be as helpful for predicting future market movements because it depends on historical data.
Interesting Fact: Moving averages are like time travelers in the stock market. Categorized as a lagging indicator, they are based on historical data. MAs give buy and sell signals based on the past, but remember, they’re a step behind the current market action!
Also Read: Golden Crossover and Death Crossover
Purpose/Importance of Moving Averages
So, imagine you’re a detective, but instead of solving mysteries, you’re trying to figure out where the stock market is heading. That’s where moving averages (MAs) come into play. Here’s what these market detectives do:
Spotting Trends:
Think of MAs as trend trackers. MAs look at the ups and downs of stock prices and draw a smooth line to show if the market is going up, down, or just chilling out.
Finding Stopping Points:
MAs are also like traffic signals. When a car (or stock price) gets close to them, it might slow down or stop. In the stock world, these are called support and resistance levels. MAs help us spot these levels where prices might take a pause.
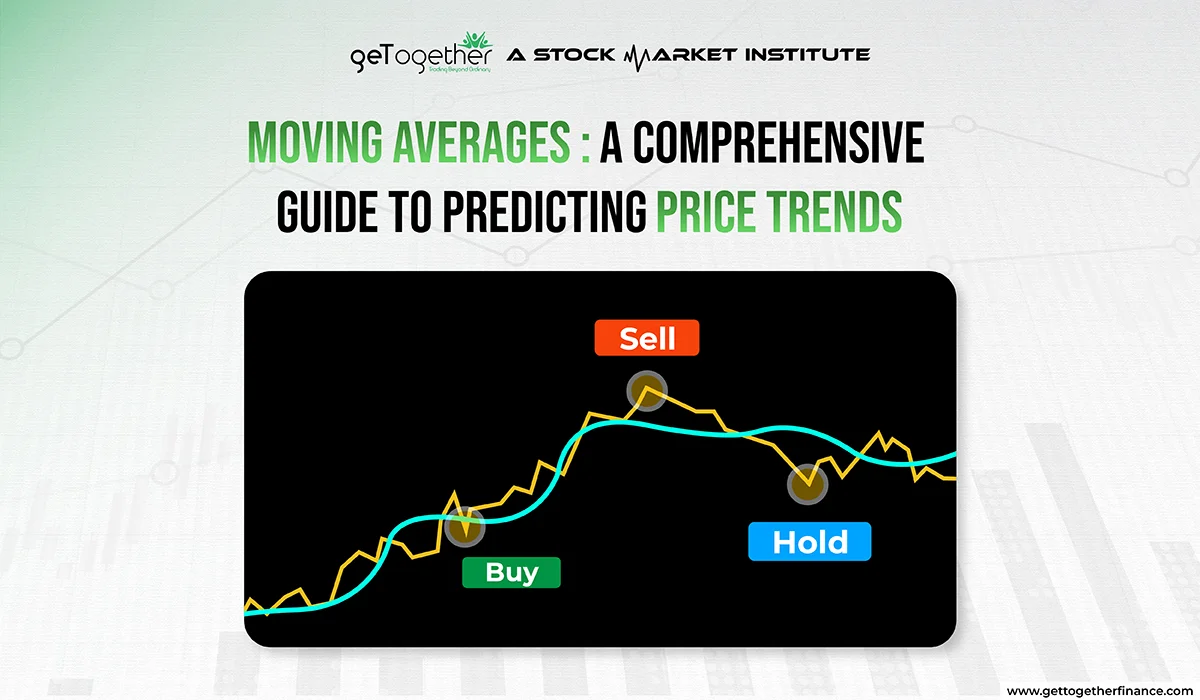
Giving Buy and Sell Hints:
When the price of a stock crosses above an MA, it’s like a hint to consider buying because it might be going up. When it crosses below, it’s like a hint to think about selling because it might be going down.
Measuring Speed:
MAs can also tell us how fast a trend is moving. Is it racing like a sports car or crawling like a turtle? This helps us understand if the trend is strong or weak.
Silencing Noise:
In the trading world, there’s a lot of noisy chatter from people buying and selling. MAs act like noise-canceling headphones. They smooth out the noise and let us focus on the important stuff.
Simply put,the key purpose of moving averages is to help traders by showing them where the market might be going, where it might slow down, when to buy, when to sell, how fast things are moving, and by quieting down all the market noise. They’re like trusty sidekicks for anyone trying to conquer the stock market.
What Does a Moving Averages Indicate?
A Moving Averages is like a trend tracker. It’s a statistic that looks at the reasoning behind how a stock’s price changes over time. In finance, folks use it to see if a stock’s price is going up or down. If the Moving Averages points up, it’s like a green light, showing the price is rising. But if it points down, it’s like a red light, signaling a price drop.
Note: MAs smooth price data by constantly updating an average over time.
Example of Moving Averages
Depending on the type of Moving Averages (SMA or EMA), the calculation is done differently. But here discussing an example gives a better view, so let’s talk about it:
Stock Castrol India Ltd for the previous five trading days from 31 Aug, 2023. Let’s calculate the Moving Averages based on the given numbers.
Solution
Use the following data for calculation:

You can also use the following formula for estimation:
=SUM(B1+B2+B3….BN)/N

Let’s apply for the formula for SMA:
=SUM(B2:B6)/B9
Here is the Moving Averages of last five days:

147.05
Now, to calculate the 6th day’s MA, we need to exclude 144.75 and include 159.65. And the new moving averages is:

150.03
Note: Experts suggest that SMA 50, EMA 50, and SMA 20 are the top choices for moving averages, providing reliable and effective results.
Pros & Cons of Moving Averages
Advantages always come with some disadvantages, and like every other thing in the world, moving averages have its pros and cons too. Here let’s swim deeper without wasting a jiffy:
Pros:
- Trend Identification: Moving averages are fantastic at showing whether a stock is on the rise (bullish) or headed downward (bearish). It’s like having a compass to navigate the market.
- Reducing Noise: They act like noise-canceling headphones in a chaotic market, helping traders focus on the bigger picture by smoothing out those pesky price fluctuations.
- Support and Resistance: Moving averages are like road signs, indicating potential stopping points for stock prices. They’re great for setting up entry and exit strategies.
- Buy and Sell Signals: When a stock price crosses a moving average, it can trigger buy or sell signals, providing traders with actionable insights.
Cons:
- Lagging Indicator: Moving averages are a bit slow on the uptake. They rely on past data, so they might not catch sudden market changes or reversals in real-time.
- False Signals: Sometimes, moving averages can give misleading signals, especially in choppy or sideways markets, leading to poor trading decisions.
- Not One-Size-Fits-All: Different timeframes for moving averages work better for different stocks or markets. What works for one might not work for another, making it a bit tricky.
- Can Be Confusing: For beginners, all the different types of moving averages and strategies can be overwhelming. It’s like having too many tools in your toolbox.
| Pros of Moving Averages | Cons of Moving Averages |
| Excellent for trend identification. | Can be a lagging indicator. |
| Reduces noise in volatile markets. | May provide false signals, especially in choppy markets. |
| Helps identify support and resistance levels. | Not one-size-fits-all; different timeframes work better for different situations. |
| Generates buy and sell signals. | Can be confusing, especially for beginners. |
In a nutshell, moving averages are handy for spotting trends, reducing market noise, and providing support and resistance levels, but they can lag behind real-time data, give false signals, and require some skill to use effectively. They’re like a versatile tool in the world of trading, but they’re not without their quirks.
What are The Moving Averages Used For?
People use moving averages to make sense of the technical stuff of the stock market. It’s like having a detective tool to spot when a stock’s momentum is changing, just like when you feel your bike slowing down. These moving averages help confirm if something is changing in the securities or stock indices, sort of like a friend saying, “I told you so!” So, they’re handy for understanding and making money from how stock prices move. On the flip side, it also address your doubts about possible changes that might undergo.
Types of Moving Averages (SMA & EMA)
Just as the name suggests, all moving averages select a specified number of previous data points, but each type acts and puts weight on those data points differently. Let’s look at two big types of moving averages, as highlighted by demand-supply pattern experts:
Simple Moving Averages (SMA)
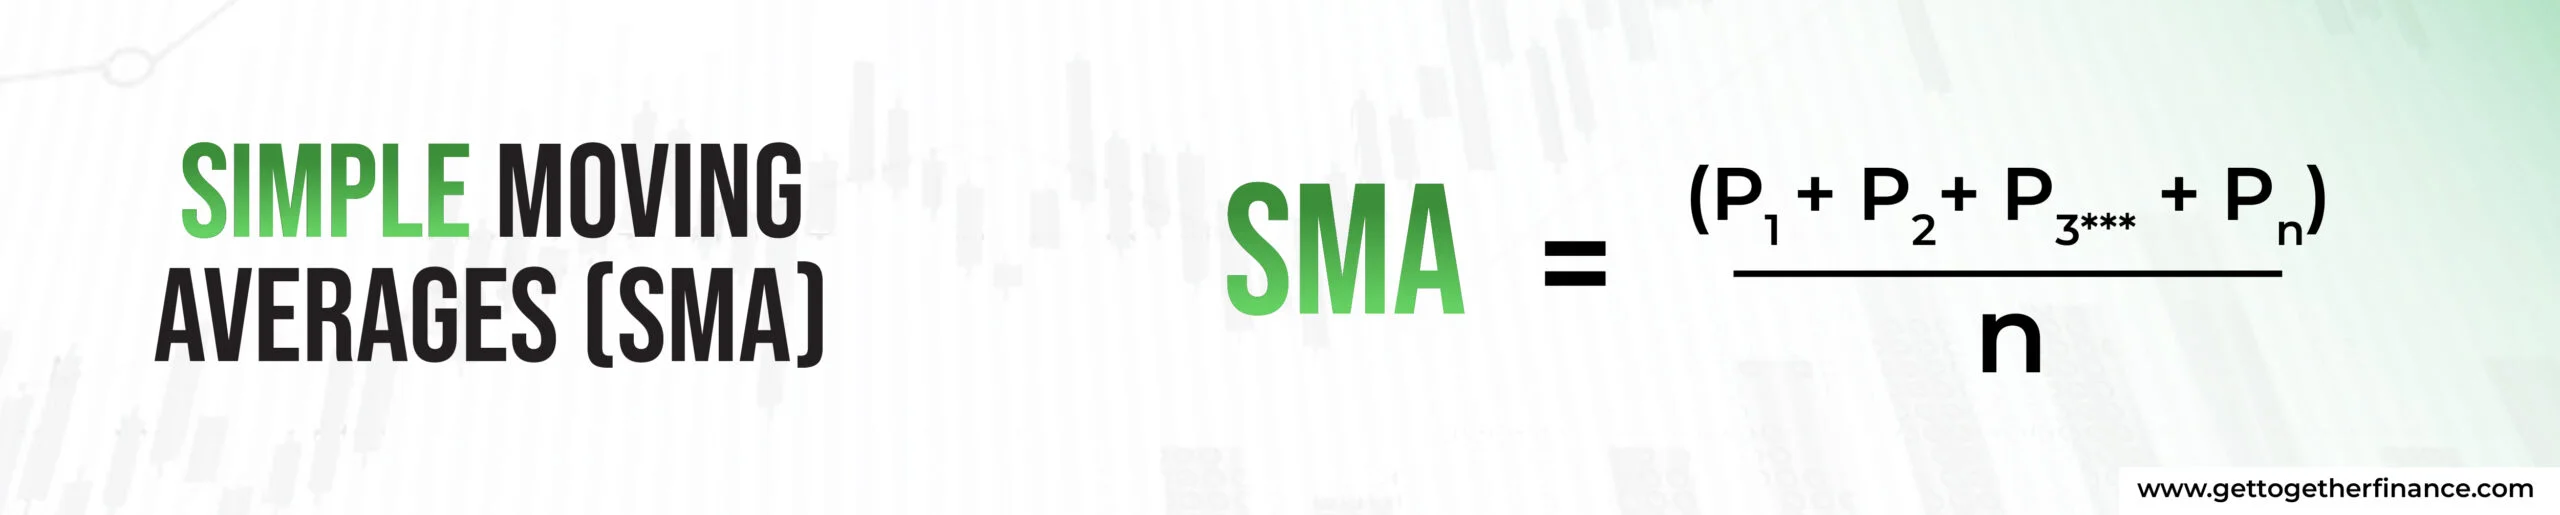
Imagine you want to know the average temperature for the past five days. You add up the temperatures of those days and divide by five. That’s your simple Moving Averages for the temperature. Simply, using arithmetic methods, you can calculate SMA of the set value of a specific period of time. It treats every data point, or in our case, price, equally.
Key Insights:
- SMA helps traders by showing them when to buy or sell a stock.
- It looks at past prices over a specific time, including the opening, lowest, highest, and closing prices.
- Traders also use SMA to find levels where stocks often stop going up or down, kind of like speed bumps in the market.
Now, if your question is how to calculate Simple Moving Averages (SMA), we got your back-
In trading, we often use SMA 50 to understand the average price of a stock over a specific period. It helps us spot trends and make decisions.
Exponential Moving Averages (EMA)
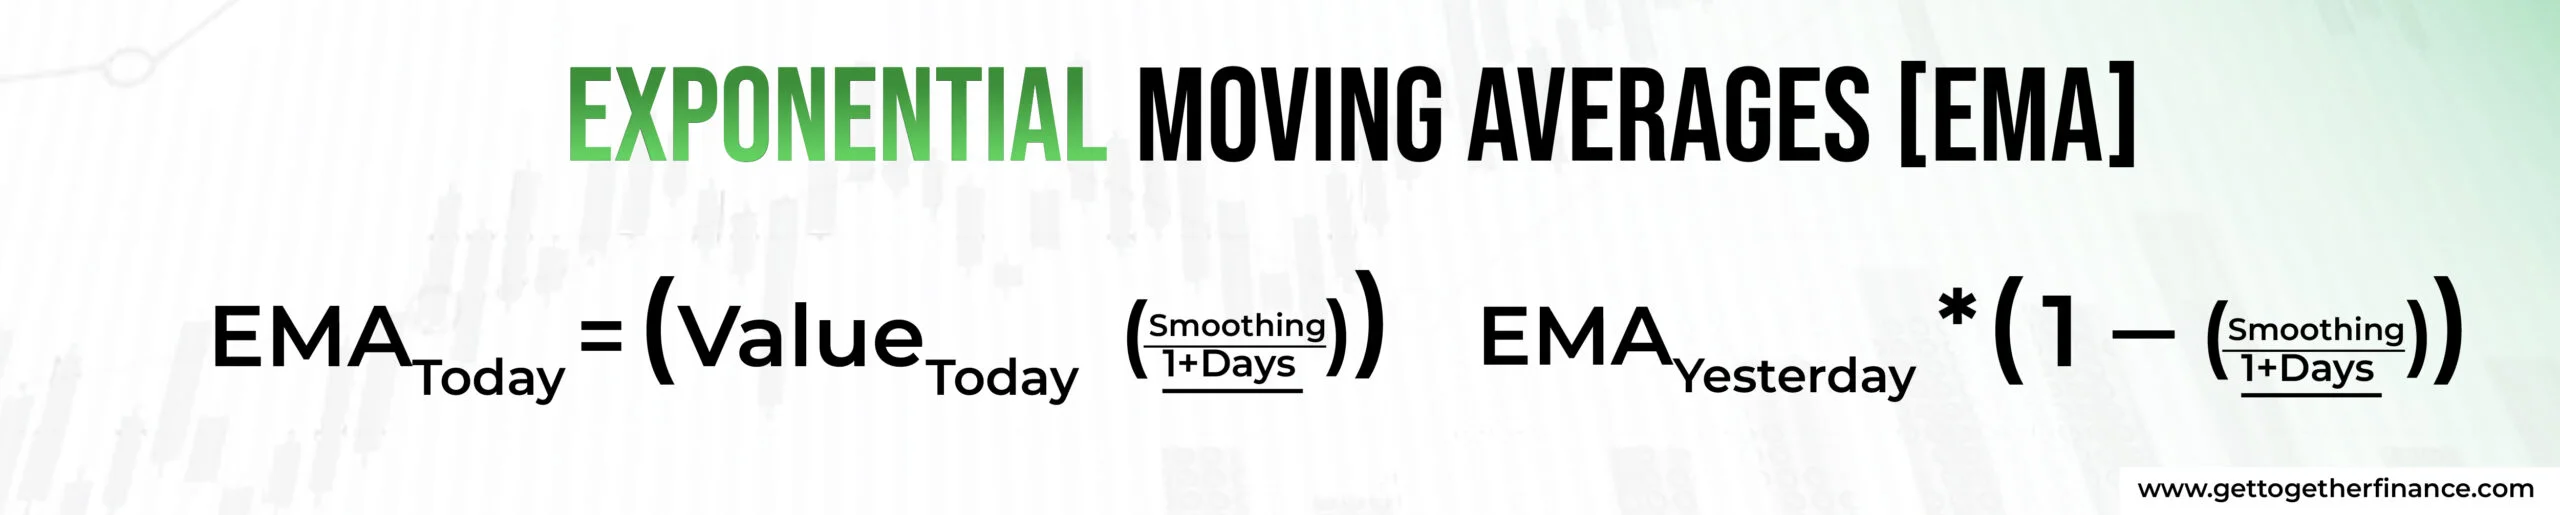
An Exponential Moving Averages (EMA) is a fancy term in finance that helps traders stay on top of what’s happening in the markets. It’s a bit like having a radar that pays extra attention to what’s happening right now. See, while some tools look at all the information equally, the EMA says, “Hey, the recent stuff is more important!” So, if you want to catch the latest trends in trading, the EMA is like having a super-responsive radar that helps you make smart decisions.
While the SMA assigns equal weight to all data points, the EMA gives more importance to recent data. This means that the EMA reacts faster to price changes, making it a favorite among traders who want to capture trends as they develop.
Key Insights:
- So, you’ve got these short-term EMAs, the 12 and 25-day ones. They’re like the sprinters of the group, helping calculate things like MACD and PPO.
- Then there are the long-term EMAs, the 50 and 200-day ones. They’re more like the marathon runners, showing you the big trends in the market.
Again if the question is how you can calculate exponential moving average, let’s break it for you:
Many traders rely on the 50 EMA and 30 EMA technique as it is considered one of the most reliable ways to complement your demand-supply dynamics.
Simple Moving Averages (SMA) vs. Exponential Moving Averages (EMA)
So, what makes Simple Moving Averages (SMA) and Exponential Moving Averages (EMA) different? Like the judge of the court, SMA focuses on all the values, and EMA is highly inclined towards recent prices. This sensitivity towards market change establishes the key change between them.
Sensitivity: EMA is like a speedster; it pays more attention to recent data, while SMA treats all data equally.
Reaction Time: EMA reacts faster to the latest changes in prices, while SMA takes its time.
Both SMAs and EMAs are like those tools you use to smooth out wobbles in your bike ride (price fluctuations in trading). But EMAs are like the ones with extra spring; they bounce back quicker. That’s why many traders prefer EMAs for their timely insights.
| Aspect | Simple Moving Averages (SMA) | Exponential Moving Averages (EMA) |
| Calculation | Takes the average of a set of prices. | Gives more weight to recent prices. |
| Smoothing | Smooths out price data over a period. | Reacts faster to recent price changes. |
| Sensitivity | Less sensitive to short-term changes. | More responsive to recent market moves. |
| Weighting | All prices are equally weighted. | Recent prices have more influence. |
| Best for Trends | Good for spotting long-term trends. | Useful for short-term trend analysis. |
| Lagging or Leading | Can be lagging in reacting to changes. | Tends to be more leading in trend changes. |
So, in simple terms, SMA is like a patient observer, while EMA is more like a quick responder in the world of moving averages. Each has its strengths, and it depends on your trading style and goals which one you might prefer.
Most Common Days Used in Moving Average
You know those lines you often see on a trader’s or analyst’s charts? Well, the 50-day, 100-day, and 200-day moving averages are like the usual suspects there. They’re kind of a big deal in the trading world. These MAs act like markers, showing us where the market might slow down or change direction. It’s like they’re saying, “Hey, something interesting might happen here! These are like the time periods we use to understand how prices are moving. But hey, here are few most recommended time frames used by the market experts:
- SMA 50: It’s like taking a nice, steady look back over the past couple of months. This helps us see the big picture and find trends that aren’t too rushed.
- EMA 20: This one’s a bit more in the here and now, like checking out what’s happened over the last few weeks. It’s great for catching those mid-term trends.
- EMA 50: Similar to the SMA 50, but with a bit more zing. It’s like looking back over a few months, but with a bit more focus on recent action. This helps us get a clearer view of trends.
So, depending on the situation, we pick one of these timeframes to get a good read on where the market might be headed.
What is MACD?
MACD, which stands for Moving Averages Convergence Divergence, is like a handy tool for people who buy and sell stocks. It helps them figure out if it’s a good time to buy or sell. MACD looks at the prices of a stock over different time periods and compares them. When it sees something interesting happening, it gives a signal to traders. So, in simple terms, it’s like a traffic light for traders, telling them when to go, slow down, or stop.
MACD is one of the commonly known technical indicators used in investing and trading. It is often used to detect buying and selling zones, as well as to identify the direction of a trend in a security.
What is a Golden Cross Over?
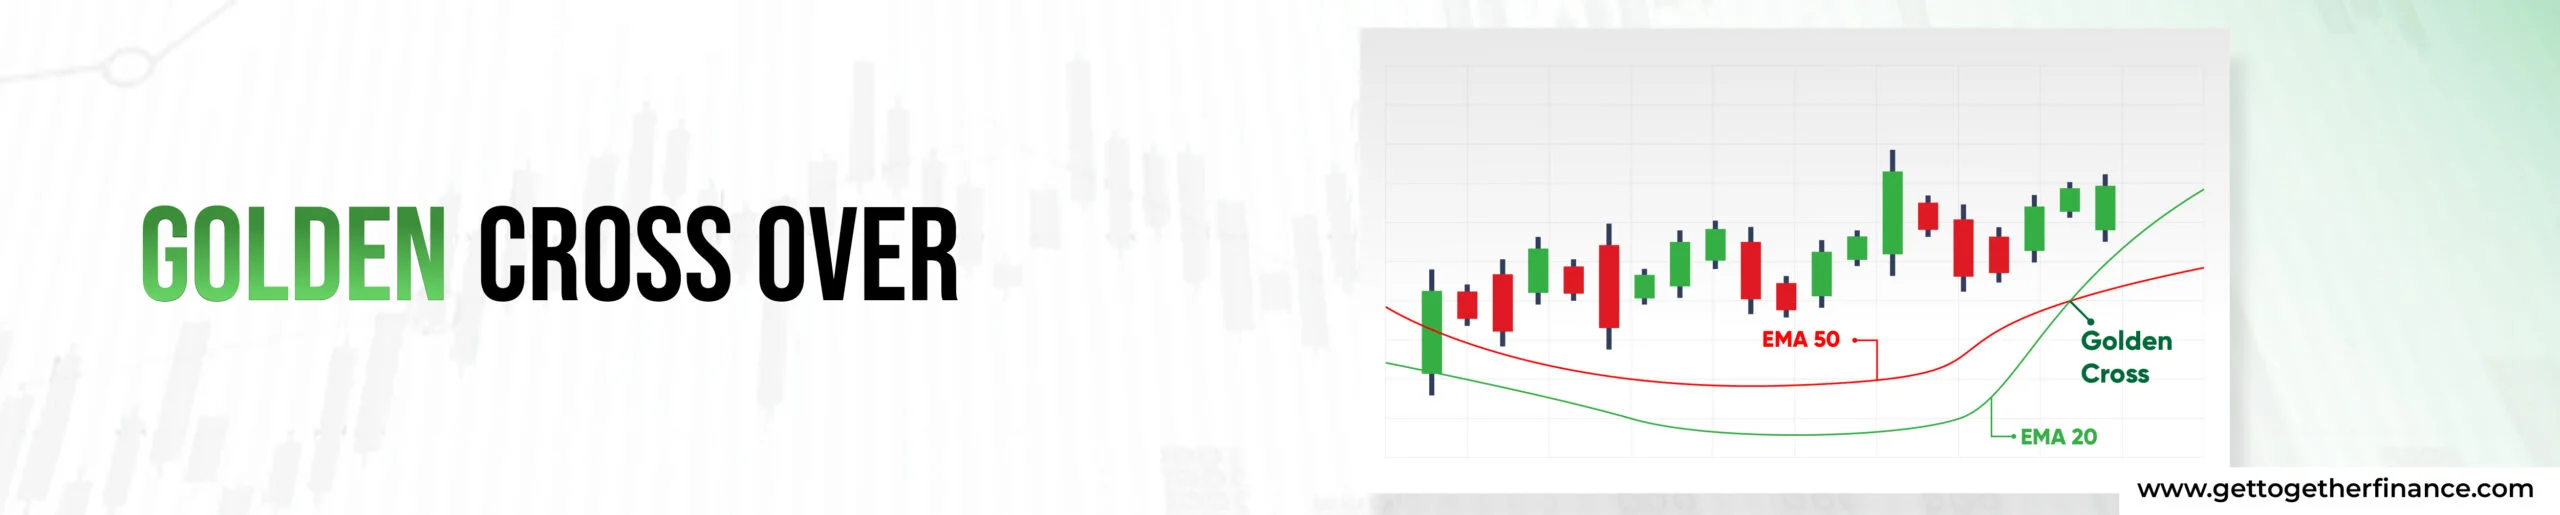
A Golden Cross Over is like a good sign for traders. It happens when a shorter Moving Averages (like a 30-day average) crosses above a longer Moving Averages (like a 50-day average) in an upward direction. It’s a bit like when a green light tells you it’s safe to go ahead.
Golden Cross Over acts bullish in the stock market and can create a strong demand zone.
What is Death Cross Over?
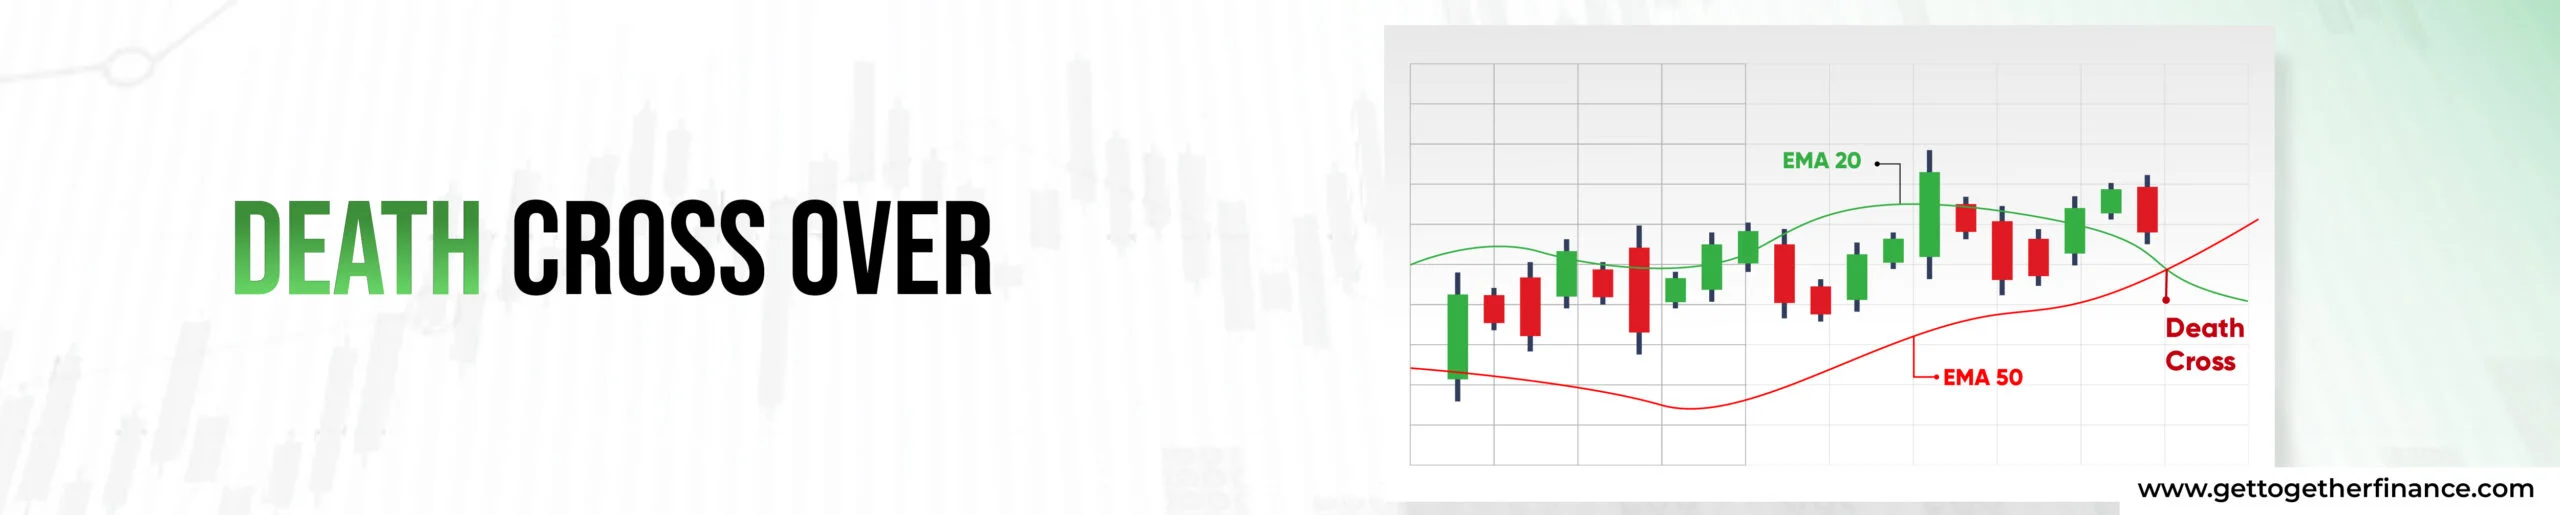
Death Cross Over is not so great. It’s when the shorter Moving Averages crosses below the longer one in a downward direction. It’s a bit like a red light warning you to stop. This cross over creates a supply zone and acts bearish in the stock market.
What Do Critics Say
Moving averages are a popular tool in the world of finance and statistics, but not everyone is a fan. Let’s take a look at what critics have to say in simple terms:
- Lagging Indicator: Critics generally call moving averages “lagging” because it depends on past data. It’s like driving while looking in the rearview mirror – you see where you’ve been, but it doesn’t show you what’s coming up ahead.
- Smoothing Out Too Much: Some critics argue that moving averages smooth out data too much. It’s like trying to listen to a song through a fuzzy radio station. You might miss the important details.
- Slow to React: Moving averages are like slow turtles when it comes to reacting to sudden market changes. Imagine trying to catch a fast-moving train with a turtle – it’s not easy!
- Not Always Accurate: Critics say that moving averages can sometimes give false signals. It’s like your weather app predicting sunshine when it’s actually about to rain – not very helpful!
- Limited in Volatile Markets: In very up-and-down markets, moving averages might not work well. It’s a bit like using an umbrella in a hurricane – it won’t do much good.
- Overused: Some critics believe that people rely on moving averages too much. It’s like eating the same food every day – it gets boring, and you miss out on trying new things.
Remember, not all experts agree with the critics. Some find moving averages very useful. It’s a bit like how some people love pizza, while others prefer burgers. It’s a matter of taste and what works for you!
Let’s Brief It
In the world of finance, folks really dig moving averages. They’re like the tortoises of the stock market – slow and steady. But, here’s the deal, they’re not lightning-fast. So, while moving averages are handy, they’re not miracle workers. To play it safe in the stock market, mix them with other tricks and keep an eye on everything. It’s like solving a big puzzle with lots of pieces, after all.
FAQs
1. Is Moving Averages only a technical indicator?
A. Is Moving Averages just a technical thing? Yep, it is! Moving averages look at past prices to spot trends. But here’s the catch: they don’t care about the important stuff like economic growth, inflation, or central bank decisions for currencies, and things like industry demand, competition, or company management for stocks. So, they’re handy, but not the whole story!
2. What is the 4-point moving average?
A. The 4-point moving average? It’s like a data smoother. Here’s the deal: it takes the average of four data points in a row. Why? Well, it drowns out the noise and helps us see the real trends in the data, kind of like putting on glasses for your numbers. By reducing noise, it can help create stock market patterns more visible and help detect data’s overall direction.
3. What Are the Limitations of a Moving Average?
A. Moving averages, like any historical data-based indicators, can’t predict the future; they’re like looking in the rearview mirror of the stock market. Plus, when the market goes on a rollercoaster, it’s tough to ride that wave with short-term trading strategies.
4. How Accurate is the EMA?
A. Let’s talk about accuracy. When it comes to the Exponential Moving Average (EMA), the more data you use, the more accurate it gets. Imagine you’re making a recipe, and you want it to be just right. If you had every ingredient the dish ever had, from the first time it was cooked, your recipe would be spot on. But in the real world, you can’t always have that many ingredients. So, the EMA tries to make do with what it has.


