Golden Crossover and Death Crossover: Navigating Market Volatility
- Updated on : March 27, 2026
- 1374 Views
- by Arun Singh Tanwar

 Facebook
 Instagram
 Youtube
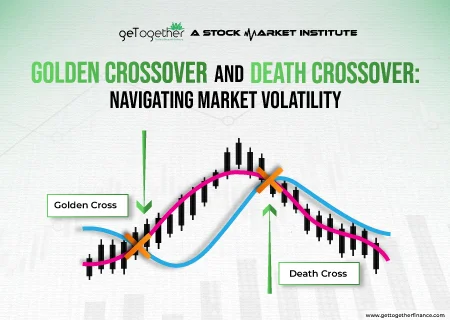
Overview
Did you know that in the world of finance, two simple terms – the “Golden Crossover” and the “Death Crossover” – can either make or break your investments? It might sound impossible, but these ordinary combinations of words mean a whole instance in the world of the stock market. This might lead you feeling curious or a bit skeptical, but now you are here – let us tell you – this is the right path. This blog reveals the mysteries of the fascinating world of crossovers and by the end of this blog you will be armed with its basic knowledge and significance. Let’s get started without wasting a jiffy.
What is Golden Crossover
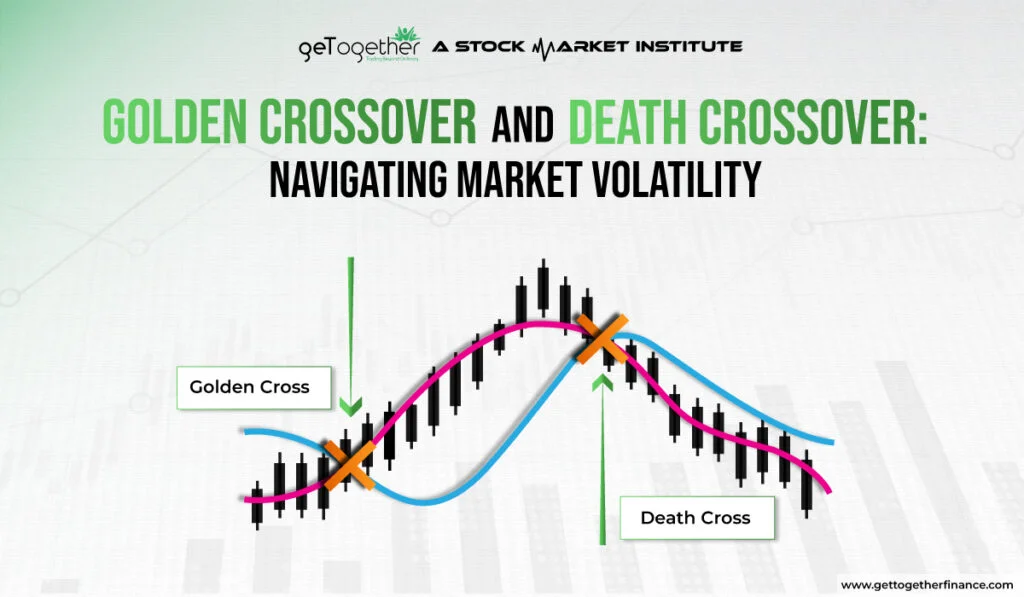
In the world of trading, we generally use moving averages to help us make decisions. The Golden Crossover is one such tool. Often considered as a significant event, it happens when a short-term moving average (like the EMA 20) crosses over a long-term moving average (like the EMA 50). If simplified, when the 20 EMA crosses above the 50 EMA, it’s a golden crossover.
The event is named “Golden” because it shows the bullish trend reversal in the asset’s price. In layman’s terms, it’s like a green light for investors and traders. They prefer to closely oversee Golden Crossover for a positive signal in the price surge. It is a significant indicator for those who are seeking for a positive sign in the charts. Although its results come with caution, GTF traders use this tool as the back-up to support their demand-supply theory. Traders are recommended to opt for preferable trading strategies as crossovers are not foolproof and can deceive a trader’s confidence.
Now here is the interesting part – : not everyone agrees on the best moving averages to use. While expert traders love the EMA 20 and 50 combo, others prefer the EMA 50, 100, and 200. It’s like choosing the right tool for the job, and in this case, the job is making the best trading decisions.
What Does A Golden Crossover Tell You?
A Golden Crossover is like a thumbs-up from the market, showing a potential buying opportunity. In simpler terms, it’s the market’s way of saying, “Hey, things are looking up!” This indicates that the recent price movements are stronger than the longer-term ones. It acts like a potential bullish trend and traders see it as a chance to buy or hold onto their positions, expecting further price rise.
However, it’s crucial to remember that a Golden Crossover doesn’t mean a guaranteed success. Market is unpredictable, and sometimes this signal may not play out as expected. That’s why it’s wise to use the Golden Crossover alongside other trading strategies and tools to make well-informed trading decisions.
As our expert trader and stock market wiz, Mr Sooraj Singh Gurjar quoted, “Golden Crossover is a reliable tool but history is evident that it has betrayed traders several times”. It is best to believe the demand-supply concept or other personalized strategy as the primary research method and keep the findings of EMA to support your conclusion.
Spotting Golden Crossover

Spotting a Golden Crossover is a critical moment for traders using moving averages. A Golden Crossover is popular as a significant buy signal in technical analysis. It uses a 20-day and a 50-day Exponential Moving Averages (EMAs). Although, it is prominent among traders to validate the results using other additional concepts (demand-supply dynamics) and indicators such as Relative Strength Index (RSI). Golden Crossover is spotted after the rise of the market; hence it is dependable. Due to the latency, it’s hard to tell if a signal is incorrect until after the event.
Example of Golden Crossover
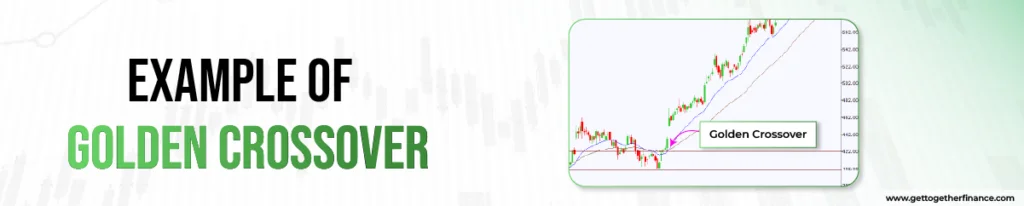
Here, let’s take an example of a “Golden Crossover” using EMA 20 and EMA 50 for Tata Motors Ltd (TATAMOTORS):
Date: 6th April, 2023
Price: The stock was trading at approximately INR 437.65.
Chart Movement: On this date, the shorter-term Exponential Moving Average (EMA 20) crossed above the longer-term Exponential Moving Average (EMA 50). This crossover shows a positive shift in the stock’s trend from a bearish phase to a potentially bullish one. After the crossover, the price went upward, showing a positive sentiment among traders.
Note: As for the time frame, this example was based on daily charts. But traders can pick different time frames based on their trading style and goals. Some like it short-term, with hourly or 15-minute charts, while others take the long view with weekly or monthly charts for their investments. It’s all about what suits your trading strategy.
How Do You Calculate a Golden Cross?
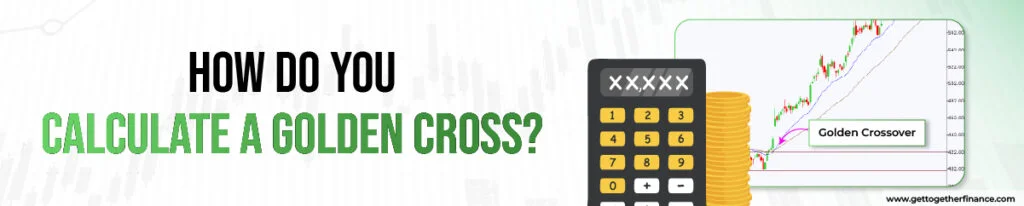
As studied earlier, the golden crossover is an excellent bullish signal that indicates a shoot up in price. It occurs when a short-term moving average that is EMA 20 crosses above a long-term moving average SMA 50. To calculate it, follow these steps:
- With the help of indicators, add SMA 50 to your charts and see its trajectory
- With the help of indicators, add EMA 20 to your charts and see its trajectory
- Observe the crossover: a Golden Cross happens when the short-term average (EMA 20) rises above the long-term average (SMA 50).
This crossover suggests increased buying interest and potential market gains.
Also Read: Iron Condor Strategy
What is Death Crossover
Known as the counterpart to the “Golden Crossover”, Death Crossover is another crucial concept in technical analysis, especially for traders and investors. Contrary to the bullish nature of golden crossover, the Death Crossover shows potential bearish signs in the financial markets.
The Death Crossover happens when the shorter-term intersects below the longer-term EMA. In simple terms, when the 20 EMA crosses below the 50 EMA, it’s a death crossover. This whole event shows a change in the stock price from a bullish phase to a potential bearish one. It is a sign to use a cautious approach, showing a down move in the asset’s price.
Just like the Golden Crossover, the Death Crossover isn’t a guarantee of market movement. GTF traders often use it in conjunction with their demand-supply findings to make well-informed decisions about their investments. The choice between using a Golden Crossover or a Death Crossover depends on the trader’s strategy and market conditions.
What Does the Death Crossover Tell You?
The Death Cross is a bearish signal in technical analysis that shows a potential shift from a bullish to a bearish trend. It happens when a shorter-term moving average crosses below a longer-term moving average. The whole event suggests weakening price momentum and prompting traders to be cautious and consider risk management strategies. Experts and stock market gurus suggest using this tool with other strategies and market analysis techniques to assess market conditions. A complete reliance on this tool is not highly recommended as it has created fake alerts of price drops several times before.
Spotting Death Crossover

Spotting a Death Crossover involves watching for a specific event in a stock’s price chart. It occurs when a shorter-term moving average, such as EMA 20, crosses below a longer-term moving average, like EMA 50, on a price chart. Traders look for this event as it can be a signal to consider selling or shorting the stock. However, it’s essential to use other tools and analysis to confirm the trend change and make well-informed trading decisions. A trader should use a risk-management strategy (Stop-Loss) and consider other factors such as demand-supply dynamics before considering the confirmation of the Death Crossover.
Example of Death Crossover
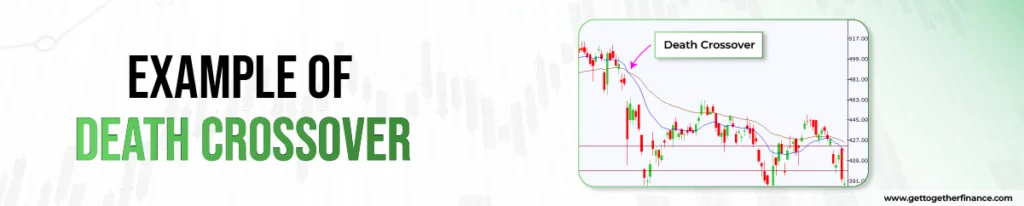
Let’s consider an example of a “Death Crossover” using EMA 20 and EMA 50 for Tata Motors Ltd (TATAMOTORS):
Date: 24 Feb, 2022
Price: The stock was trading at approximately INR 427.95.
Chart Movement: On this date, the shorter-term Exponential Moving Average (EMA 20) crossed the longer-term Exponential Moving Average (EMA 50) from the above. This Death Crossover suggested a shift in the stock’s trend from a bullish phase to a potentially bearish one. After the crossover, the stock’s price showed an uptrend in its course, indicating a negative sentiment among traders.
Note: This is a simplified example for illustrative purposes. However, in real-world, trading decisions should involve a more comprehensive technical analysis of the stock market.
How Do You Calculate a Death Cross?
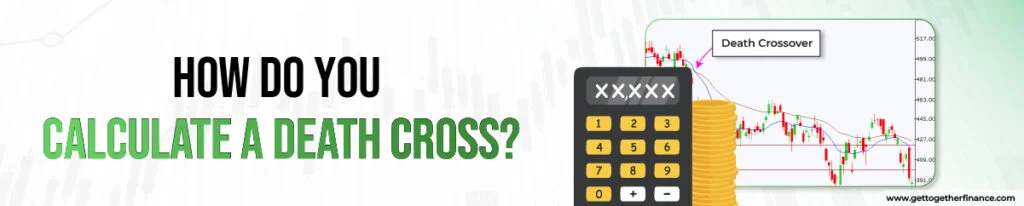
As studied earlier, the death crossover is an excellent bearish signal that indicates a downfall in price. It occurs when a short-term moving average that is EMA 20 crosses the long-term moving average SMA 50 from the downside, resulting in falling prices. To calculate it, follow these steps:
- With the help of indicators, add SMA 50 to your charts and see its trajectory
- With the help of indicators, add EMA 20 to your charts and see its trajectory
- Observe the crossover: a Death Cross happens when the short-term average (EMA 20) falls below the long-term average (SMA 50).
This crossover suggests increased selling interest and short opportunities.
Golden Crossover v/s Death Crossover

Although both terms sound similar, Golden Cross acts bullish in nature, whereas Death Cross acts bearish, influencing the stock prices in the specific direction. But there is more to it – let’s find out:
| Aspect | Golden Crossover | Death Crossover |
| Definition | Short-term EMA crosses above long-term EMA | Short-term EMA crosses below long-term EMA |
| Bullish/Bearish Signal | Bullish signal indicating a potential uptrend | Bearish signal indicating a potential downtrend |
| Positive Market Sentiment | Suggests positive sentiment among traders | Suggests negative sentiment among traders |
| Example | EMA 20 crossing above EMA 50 | EMA 20 crossing below EMA 50, 100 |
Best Timeframe for a Golden Cross

Trading is done in different time frames based on the risk appetite and the goal the trader is setting. Swing trades usually exit within a week by capitalizing on short-term movement. For them, golden crossover on daily and hourly time frames can be highly beneficial.
Whereas long-term traders who aim to capitalize on movements of months can consider golden crossover on weekly and monthly time frames, resulting in more safe and secure trades.
At least, for short-term or intraday traders, short time frames like 15 minutes or five minutes can work best. Golden crossover on either of them can help in capturing the sudden movements and making profits out of them.
Death Cross – A Good Time to Buy

Death cover occurs when the selling pressure is seen in the past candles, it indicates that heavy selling pressure may come seeing the past averages. But, the death crossover not only brings the opportunity to sell heavily, instead, it also brings the opportunity to buy significantly in the dips.
If you start short selling with help death crossover then look for the nearest strong demand zone. The selling pressure may get reversed from there, and that may be the dip you’re looking for.
Limitation of Using Golden and Death Crossover
While Golden and Death Crossovers can provide valuable insights, they also come with limitations that traders and investors should consider. Here are some of the key limitations of using these crossover strategies:
- Whipsaw Effect: Crossovers can result in false signals and losses.
- Lagging Indicators: They rely on past data and may lead to missed opportunities.
- Market Volatility: Less reliable in choppy, volatile markets.
- Parameter Sensitivity: Effectiveness depends on chosen parameters.
- No Guarantee of Success: Crossovers do not ensure profits.
- Emotional Impact: Can lead to impulsive decisions.
- Backtesting vs. Real-Time: Historical performance may not reflect real-time results.
- False Signals: Common in shorter time frames, requiring signal filtering.
- Not Suitable for All Assets: Effectiveness varies by asset type.
In summary, Golden and Death Crossovers are helpful but have limitations, so use them within a broader strategy.
Final Words
Though, Golden Crossover and Death Crossover offer valuable insights into market trends, but they’re not infallible. As Warren Buffett wisely pointed out, “The stock market is designed to transfer money from the Active to the Patient.” So, while these indicators can certainly guide your investment decisions, remember that patience, a diversified portfolio, and a long-term perspective remain key to your financial success. Or if you complement this Demand-Supply theory, it strengthens your research and offers you a more reliable outcome than any other strategies. Happy investing!
FAQs
Q1. How Do You Calculate a Golden Cross?
Calculating a Golden Cross is like mixing the right ingredients for a financial recipe. You take a shorter-term moving average (usually the 20-day) and a longer-term moving average (often the 50-day). Then, you mix in the average closing prices of a stock over these different time periods. When the shorter-term average rises above the longer-term one, you’ve got yourself a Golden Cross.
Q2. Is a Death Crossover a Good Time to Buy?
Well! A Death Crossover might sound ominous, but it can be an opportunity to snag a deal. It happens when the shorter-term moving average drops below the longer-term one. This could be a good time to buy if you’re looking for a more wallet-friendly entry point. But remember, it’s not a solo act; pair it up with other theories and do your homework before diving in.
Q3. What Timeframe Is Best for a Golden Crossover?
Think of the Golden Crossover timeframe like choosing the right outfit for an occasion. If you’re a short-term trader, you might rock the 20-day and 50-day moving averages. Long-term investors could opt for the 50-day and 200-day moving averages. The key is to match the timeframe with your trading style and goals.
Q4. Is the Golden Crossover a Good Indicator?
The Golden Crossover is like the thumbs-up from your favorite food critic. It’s a strong bullish indicator, hinting at potential upward movement for a stock. However, don’t put all your eggs in this one basket. Spice it up with other technical analysis tools, and don’t forget to consider what’s cooking in the broader market.
Q5. Is the Golden Crossover SMA or EMA?
The Golden Crossover doesn’t discriminate between Simple Moving Averages (SMA) and Exponential Moving Averages (EMA). It’s like choosing between grandma’s traditional recipe (SMA) and a modern twist (EMA). SMAs give equal love to all data points, while EMAs focus more on recent prices. Your choice depends on your unique trading flavor and style.


