
Break-Even Analysis: Formula, Calculation & Examples for Businesses
- Updated on :
- 1452 Views
- by Suhani

 Instagram
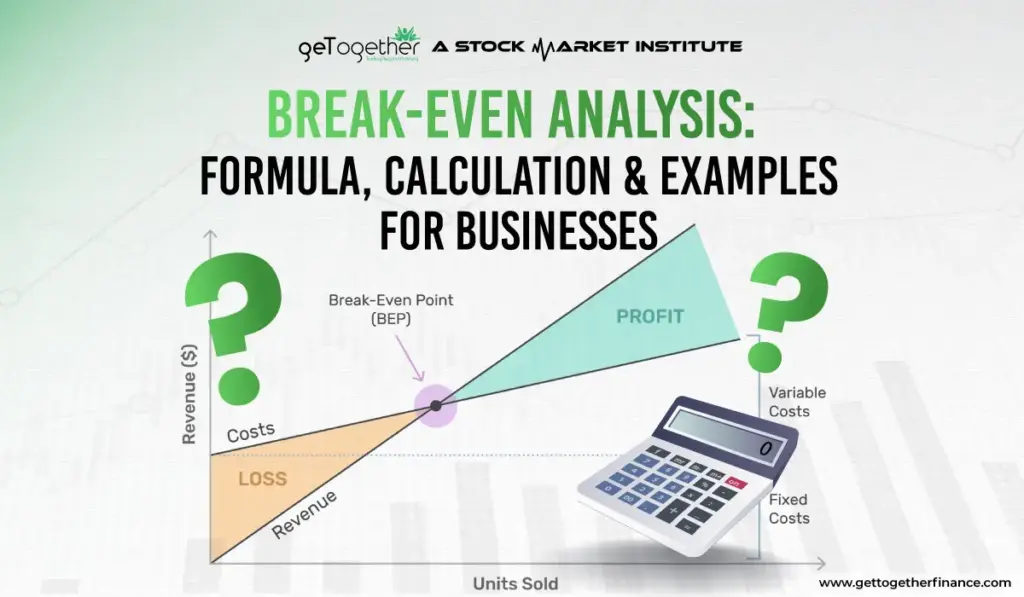
Costing or cost analysis is the most important component of any business, whether you are selling products or services. You must be aware of the two types of costs, namely, fixed costs and variable costs. The break-even point is essentially the price at which both these costs are covered by the revenue. This means a no-profit, no-loss situation.
Break-even analysis is the foundation stone of your pricing strategy, whether you are launching a new business, a startup, or even expanding an existing business. It empowers the management to make informed pricing decisions.
Usually, the viability or feasibility of a business idea is judged by the time it takes to break even. In this blog, we explore how you can conduct break-even analysis for your business. You will also learn how to apply the break-even point formula and the key metrics like profitability, contribution margin, etc.
What is Break-Even Analysis?
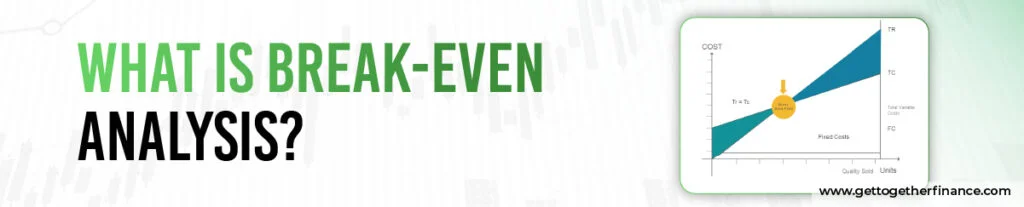
Let’s dive right in and try to understand what break-even analysis is. At its core, the idea of the break-even point is the point at which the Total Revenue of a business is equal to the total cost. Hence, the name break-even. At this point, the profit and loss are both “0”.
If the revenue of the business grows beyond the break-even point, the business starts to turn profitable, and the excess revenue beyond this point is purely the profit margin.
But why do businesses need break-even analysis? Here’s why it is essential:
- For setting realistic sales targets.
- To develop a pricing strategy using key metrics like contribution margin and profitability.
- Planning financial budgets, business expansions, etc.
- Assessing the inherent risk and feasibility of business ventures.
Fixed Costs vs Variable Costs: Key Concepts in Break-Even Analysis

Before calculating the break-even point, it is important to understand the two main types of costs that influence business profitability: fixed costs and variable costs. These cost categories form the foundation of break-even analysis and help businesses determine the sales volume required to cover expenses.
Fixed Costs
Fixed costs remain constant regardless of production or sales levels. These expenses do not change as output increases or decreases within a certain operating range.
Examples of Fixed Costs:
- Rent
- Salaries
- Insurance
- Office expenses
Key Characteristics:
- Remain unchanged with production volume.
- Must be paid even when sales are low.
- May increase only when the business expands significantly.
Variable Costs
Variable costs change directly with the level of output or sales. As production increases, these costs rise. When production decreases, they fall accordingly.
Examples of Variable Costs:
- Raw materials
- Packaging
- Sales commissions
- Sales incentives
Key Characteristics:
- Fluctuate based on production activity.
- Increase as more units are produced.
- Directly impact the cost of each unit sold.
Semi-Variable Costs
Semi-variable costs contain both fixed and variable components. Up to a certain level, these costs remain fixed, but beyond that threshold, they vary according to usage or production.
Examples of Semi-Variable Costs:
- Electricity charges (fixed base charge plus usage costs)
- Labour costs with overtime payments
Cost Comparison at a Glance
| Type of Cost | Description | Examples |
| Fixed Costs | Remain constant regardless of output or sales volume. | Rent, Salaries, Insurance, Office Expenses |
| Semi-Variable Costs | Include both fixed and variable elements. | Electricity, Labour Costs |
| Variable Costs | Change according to production or sales volume. | Raw Materials, Packaging, Commissions |
Role of Costs in Break-Even Analysis
For break-even analysis, semi-variable costs are typically divided into fixed and variable portions. The fixed component is added to fixed costs, while the variable component is added to variable costs. This classification enables businesses to calculate the break-even point more accurately and understand how changes in production levels affect profitability.
Understanding the distinction between fixed costs and variable costs is the first step toward mastering break-even analysis and making informed business decisions.
Break-Even Point Formula: How to Calculate It (With Examples)
Now that you understand fixed costs, variable costs, and contribution margin, it is time to learn how to calculate the break-even point. The break-even point formula helps businesses determine the minimum sales required to cover all costs without making a profit or incurring a loss.
How Is the Break-Even Formula Derived?

The break-even point occurs when:
Total Revenue = Total Costs
Since:
- Total Revenue = Selling Price × Number of Units
- Total Costs = Fixed Costs + Variable Costs
We can write:
Selling Price × Number of Units = Fixed Costs + (Variable Cost per Unit × Number of Units)
Rearranging the equation:
Number of Units × (Selling Price − Variable Cost per Unit) = Fixed Costs
Therefore:
Break-Even Point (Units) = Fixed Costs ÷ (Selling Price − Variable Cost per Unit)
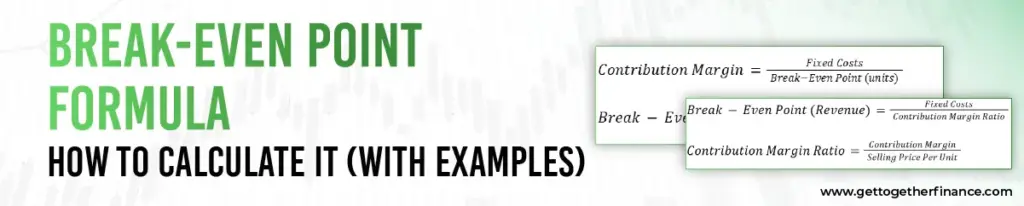
The difference between the selling price and the variable cost per unit is known as the “contribution margin.”
Contribution Margin = Selling Price − Variable Cost per Unit
Substituting this into the formula gives:
Break-Even Point (Units) = Fixed Costs ÷ Contribution Margin
This is the most commonly used formula for calculating the break-even point in units.
Unit-Based vs Revenue-Based Break-Even Point: Why Both Matter
Businesses can calculate the break-even point either in units sold or in revenue generated. Both approaches provide valuable insights and are useful in different situations.
Break-Even Point in Units
The unit-based break-even point shows the number of units a business must sell to cover all fixed and variable costs.
Formula:
Break-Even Point (Units) = Fixed Costs ÷ Contribution Margin
This method is particularly useful for businesses that sell a single product or want to establish specific sales targets.
Break-Even Point in Revenue
The revenue-based break-even point indicates the amount of sales revenue required to cover all costs.
Formula:
Break-Even Point (Revenue) = Fixed Costs ÷ Contribution Margin Ratio
Where:
Contribution Margin Ratio = Contribution Margin ÷ Selling Price per Unit
This method is useful when businesses offer multiple products or focus on overall revenue targets rather than unit sales.
Example of a Break-Even Point Calculation
Assume a business has:
- Fixed Costs = ₹50,000
- Selling Price per Unit = ₹500
- Variable Cost per Unit = ₹300
Contribution Margin = ₹500 − ₹300 = ₹200
Using the formula:
Break-Even Point (Units) = ₹50,000 ÷ ₹200 = 250 units
This means the business must sell 250 units to recover all costs and reach the break-even point.
Key Takeaway: Understanding both unit-based and revenue-based break-even calculations helps businesses evaluate performance, set realistic sales goals, and make informed pricing decisions. By using the appropriate break-even formula, businesses can better plan for profitability and long-term growth.
How to Calculate Break-Even Point: Step-by-Step

Now, let’s answer the burning query, “How to calculate break-even point,” in a step-by-step manner:
Step 1: Determine Fixed Costs
The first step is to determine the fixed costs. Suppose Company A has to pay the following fixed costs:
Rent – Rs. 5 lakhs
Salaries—Rs. 3 lakhs
So the total fixed cost is Rs. 8 lakhs.
Step 2: Calculate Variable Cost Per Unit
Suppose Company A incurs the following variable costs:
Raw material – Rs. 10,000 per unit
Packing cost is Rs. 2,000 per unit
The total variable cost per unit for Company A comes to Rs. 12,000.
Step 3: Set Selling Price Per Unit
The third step is to set the selling price for your product. You already know that the selling price should cover the variable cost and leave room for the contribution margin. So, let’s assume Company A sets the selling price at Rs. 20,000 per unit.
Step 4: Compute Break-Even Point in Units and Revenue
In the fourth and final step, you actually apply the break-even point formula to get both the unit-based and revenue-based break-even point.
Real-Life Example of Break-Even Analysis

Real-Life Break-Even Analysis Examples (Business & Trading Scenarios)
Understanding the break-even point becomes much easier when applied to real-world situations. Whether you run a business or participate in financial markets, break-even analysis helps determine the minimum level of performance required to recover costs and avoid losses.
Business Scenario: Product-Based Company
Imagine a business that sells a product for ₹500 per unit.
Cost Structure:
- Fixed Costs = ₹50,000
- Variable Cost per Unit = ₹300
- Selling Price per Unit = ₹500
Step 1: Calculate Contribution Margin
Contribution Margin = Selling Price − Variable Cost
= ₹500 − ₹300
= ₹200 per unit
Step 2: Calculate the Break-Even Point
Break-Even Point (Units) = Fixed Costs ÷ Contribution Margin
= ₹50,000 ÷ ₹200
= 250 Units
Interpretation
The company must sell 250 units before it starts generating profit. Any sales beyond this point contribute directly to earnings.
Trading Scenario: Recovering Trading Costs
Break-even analysis is equally useful in trading. Traders often need to determine the price level at which they recover transaction-related costs such as brokerage charges, commissions, taxes, and fees.
Example
Suppose a trader purchases a stock at ₹1,000 per share and incurs additional trading costs.
To reach the break-even point, the stock price must rise enough to cover these expenses. Only after crossing that level does the trader begin earning a net profit.
Why It Matters
Break-even analysis helps traders:
- Evaluate risk before entering a trade.
- Set realistic profit targets.
- Understand the impact of transaction costs.
- Improve decision-making and capital management.
So, whether used in business planning or trading decisions, break-even analysis provides a clear benchmark for measuring performance. By knowing the point at which costs are fully recovered, businesses and traders can make more informed decisions and focus on achieving sustainable profitability.
How to Interpret Your Break-Even Results: What the Numbers Mean

This means Company A has to sell more than 100 units or generate a revenue above Rs. 20 lakhs to maintain its business profitability.
Now, suppose Company A thinks that the product can be sold at a price higher than Rs. 20,000 a piece, but it cannot sell 100 units. So, Company A raises the selling price to Rs. 28,000 per unit. Now, the new break-even analysis will be:
Contribution Margin = Rs. 28,000 – Rs. 12,000 = Rs. 16,000
Break-Even Point (Units) = Rs. 800,000 / Rs. 16,000 = 50 units
Now, if the actual sales are more than the breakeven point, let’s say 100 units, Company A makes a profit. If the sales figures drop below the break-even point, Company A makes a loss.
From the above example, you have learned how Company A can use the break-even analysis to determine the following:
- Set realistic targets.
- Understand where the profit potential lies.
- Use a margin of safety to safeguard the business’s profitability.
- Plan to expand or restructure the cost.
Break-Even Analysis for Different Business Models

Is the break-even point formula the same for every type of industry, or do the components differ for various business models? Let’s see how different business models can draw value from the break-even analysis:
| Business Models | Key Considerations |
| Product-Based | Material, production, and packaging costs are the key. The business’s profitability depends purely on the volume or the number of units sold. |
| Service-Based | The inputs in service-based businesses are man-hours, session length, i.e., time-based. While the equipment can be a fixed cost, the variable costs usually include hourly wages, tools, etc. |
| SaaS or Subscription-Based | The fixed cost is for servers, whereas the variable costs can include customer acquisition cost (CAC), churn rates, etc. The major revenue sources for such businesses are monthly recurring fees, AMCs, etc. |
| E-commerce | For an e-commerce business, the key costs include marketing, ads, logistics, transaction fees, and losses due to returns. The product revenue is directly related to the number of units sold. |
Benefits of Break-Even Analysis for Business Decision-Making

Break-even analysis is more than just a calculation tool. It helps businesses evaluate profitability, manage costs, set realistic sales targets, and make informed strategic decisions. By understanding the break-even point, business owners and managers can plan more effectively and reduce financial uncertainty.
Strategic Pricing Decisions
To achieve profitability, products and services must be priced appropriately. Break-even analysis helps businesses determine whether their pricing strategy can cover costs while remaining competitive in the market.
Improved Financial Planning
Knowing the break-even point makes it easier to budget expenses, forecast revenue, and establish achievable sales targets. This allows businesses to plan their finances with greater confidence.
Better Cost Management
Break-even analysis highlights the relationship between costs and revenue. As a result, businesses can identify unnecessary expenses, improve operational efficiency, and strengthen profit margins.
Smarter Business Decisions
Business owners can use break-even data to support important decisions such as:
- Expanding operations
- Launching new products
- Hiring additional employees
- Investing in equipment
- Implementing cost-reduction strategies
With a clear understanding of the break-even point, decision-making becomes more data-driven and less reliant on assumptions.
Increased Investor Confidence
Regularly performing break-even and cost-volume-profit analysis demonstrates a strong understanding of business performance. This can improve investor confidence by showing that management has a clear plan for achieving profitability and managing risk.
Limitations of Break-Even Analysis: What It Cannot Tell You

Break-even analysis is a valuable tool for understanding costs, pricing, and profitability. However, like any financial model, it has limitations. While it helps estimate the sales required to cover costs, it does not account for every factor that can influence business performance.
Understanding these limitations can help businesses use break-even analysis more effectively and avoid relying on it as the sole basis for decision-making.
Assumes Costs Remain Constant
Break-even analysis generally assumes that fixed costs and variable costs remain unchanged over a specific period.
In reality, costs can fluctuate due to factors such as:
- Inflation
- Supplier price changes
- Wage increases
- Operational expansion
As costs change, the break-even point must be recalculated to maintain accuracy.
Does Not Account for Changes in Demand
One of the biggest limitations of break-even analysis is that it focuses on costs and revenue without considering market demand.
The model does not account for:
- Changes in customer preferences
- Economic conditions
- Seasonal fluctuations
- Market trends
As a result, reaching the calculated break-even sales volume may not always be realistic.
Ignores Competition and Business Risk
Break-even analysis assumes that products can be sold at the expected price and volume.
However, it does not consider external factors such as the following:
- Competitive pricing pressure
- New market entrants
- Industry disruptions
- Operational risks
These factors can significantly affect profitability even when the break-even target is achieved.
Provides a Static View of Business Performance
The break-even point offers a snapshot based on a specific set of assumptions. Businesses operate in dynamic environments where costs, pricing, and demand frequently change. As a result, break-even analysis should be viewed as a planning tool rather than a complete representation of business performance.
Should Be Used Alongside Other Financial Tools
While break-even analysis helps assess profitability thresholds, it is most effective when combined with other financial and strategic analyses.
Businesses often use it alongside the following:
- Cost-volume-profit (CVP) analysis
- Budget forecasting
- Cash flow analysis
- Market research
This provides a more comprehensive understanding of business performance and future opportunities.
Break-Even Analysis in Stock Market Trading

While break-even analysis is commonly associated with business planning and cost management, it also plays an important role in stock market trading. In simple terms, a trader’s break-even point is the price at which a position neither generates a profit nor incurs a loss after accounting for all trading-related costs. These costs may include brokerage fees, exchange charges, taxes, and other transaction expenses that impact the final return on a trade.
Understanding the break-even point helps traders evaluate the minimum price movement required to recover their costs before a position becomes profitable. This is particularly useful when setting profit targets and assessing whether a trade offers a favourable risk-to-reward ratio. By knowing their break-even level in advance, traders can make more informed decisions and avoid entering positions where potential gains may not justify the associated costs.
The concept is especially relevant in options trading, where break-even calculations are frequently used to evaluate potential outcomes. Traders often calculate the price at which an option position begins generating profits at expiry, helping them better understand the relationship between risk, reward, and market expectations. As a result, break-even analysis serves as a practical tool for improving trade planning and risk management in financial markets.
Break-Even Point vs Margin of Safety: Key Differences

Although the break-even point and margin of safety are closely related, they measure different aspects of business performance and risk.
| Factor | Break-Even Point | Margin of Safety |
| Purpose | Identifies when total revenue equals total costs. | Measures how much sales can decline before losses occur. |
| Focus | Cost recovery. | Risk assessment. |
| Calculation | Based on fixed costs, variable costs, and contribution margin. | Based on current sales and break-even sales. |
| Decision-Making Use | Determines minimum sales required for profitability. | Evaluates the safety cushion above the break-even point. |
Why Does Margin of Safety Matter?
Once a business has calculated its break-even point, it can determine its margin of safety.
The margin of safety indicates how far actual sales exceed break-even sales. A larger margin of safety generally suggests lower business risk, while a smaller margin indicates that even a slight decline in sales could lead to losses.
Example
Suppose a business has:
- Actual Sales = ₹100,000
- Break-Even Sales = ₹80,000
Margin of Safety = ₹20,000
This means sales can decline by ₹20,000 before the business reaches its break-even point.
The break-even point tells you when a business stops losing money, while the margin of safety tells you how far away you are from that threshold. Together, these metrics provide a more complete picture of profitability and business risk.
Key Takeaways: Break-Even Analysis
If you want decision-making in your business to be simpler, you should regularly use break-even analysis. Whether you need a budget, want to set ideal pricing, improve your business profitability, or attract new investors, knowing the break-even point can help keep you on track.



