
GTF EYE for Intraday vs Swing Trading: How to Use the Same Scanner Differently
- Updated on :
- 1 Views
- by Juhi Sharma

 Instagram
 Linkedin
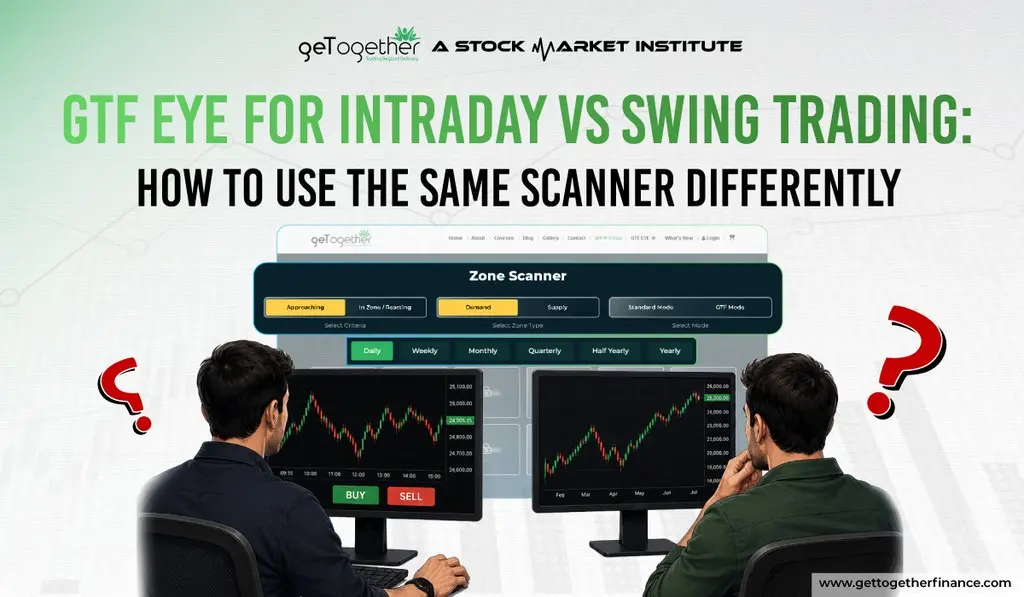
If you’ve started using GTF EYE, you’ve probably noticed something: it’s a single scanner, but it doesn’t trade for you, and it doesn’t tell you “this is an intraday setup” or “this is a swing setup.” That distinction comes from you, specifically, from which timeframe you choose to look at inside the human scanner.
This article breaks down exactly how intraday traders and swing traders should each be using GTF EYE, a human stock scanner, why the same zones can mean different things depending on your holding period, and how to avoid the most common mistake new users make, like scanning every timeframe at once and ending up with no clear setup at all.
One Scanner, Two Trading Styles: Why Your Approach to GTF EYE Should Change
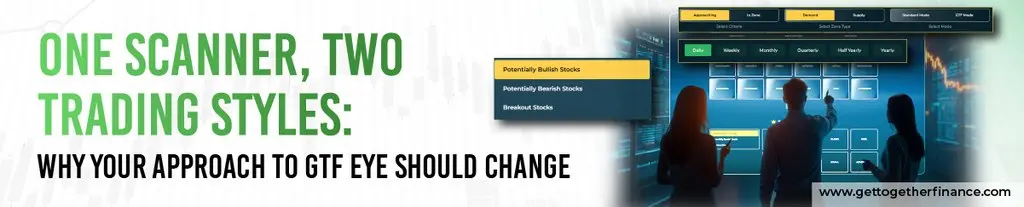
GTF EYE‘s stock scanner, created by GTF, covers a full range of timeframes like daily, weekly, monthly, quarterly, and yearly. The zones on the smaller timeframes (daily and weekly) tend to react on the same day they’re tested, which makes them useful for intraday trading.
Whereas the zones on the bigger timeframes (weekly, monthly, and quarterly) play out over a longer stretch, typically anywhere from a week to 10–15 days, which makes them more suited to swing trading.
In other words, GTF EYE doesn’t change based on your trading style. You change which part of it you’re looking at. An intraday trader and a swing trader can open the exact same scanner and walk away with completely different trade ideas, simply because one is filtering by daily/weekly zones and the other is filtering by weekly/monthly/quarterly zones.
What GTF EYE Actually Does?
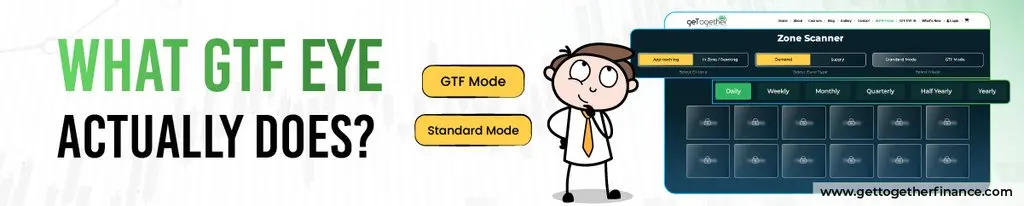
Before understanding how GTF EYE supports different trading styles, it is important to know what the scanner actually does. Rather than simply listing stocks, GTF EYE helps traders identify high-probability opportunities using the GTF Strategy. The following sections explain how the scanner works, what the dashboard offers, and how it helps uncover institutional activity.
How does GTF EYE scan for High-Probability Setups Using the GTF Strategy?
GTF EYE works on the idea of identifying high-probability zones rather than scanning for generic technical patterns. The scanner runs in two modes, Standard and GTF. According to GTF’s trading theory, the majority of genuinely high-probability zones fall under GTF mode, so the scanner is built to filter toward those zones specifically. The point of this filtering is straightforward: instead of you manually scrolling through charts looking for zones, GTF EYE narrows that list down for you, cutting out a large chunk of your research time.
One thing worth being clear about: GTF EYE’s zones aren’t generated by an automated algorithm scanning price action on its own. The zone levels are manually filled in on the backend by GTF mentors based on their analysis. So when you see a zone flagged in GTF EYE, you’re looking at a level that’s been identified and entered by a trader, not a formula running unattended.
Inside the GTF EYE Dashboard (Sectors, Filters, and Timeframes Explained)
The core of the dashboard is the zone scanner, which organises stocks by timeframe: daily, weekly, monthly, quarterly, half-yearly, and yearly. So you can see which stocks are currently approaching or sitting inside a Demand or Supply zone.
Beyond the zone scanner, GTF EYE includes premium filters built for options traders, specifically high IV (implied volatility) and low IV filters. These help option traders quickly separate stocks with rich premiums from ones with cheap premiums, depending on the kind of options strategy they’re running.
GTF EYE has had other filters in earlier versions (like a breakout stocks filter) that aren’t part of the current feature set, and the IV filters are expected to be joined by more premium filters over time.
How GTF EYE Tracks Institutional Buying and Selling Behaviour
This part of GTF EYE is built on the “Trading in the Zone” concept: when institutions accumulate or distribute a stock, that buying or selling activity leaves a visible footprint on the chart in the form of a zone. GTF EYE’s job is to identify where those zones have formed and surface them to you, so instead of trying to spot institutional activity yourself, you’re looking at zones that have already been flagged as places where significant buying or selling likely took place.
How Intraday Traders Use GTF EYE?
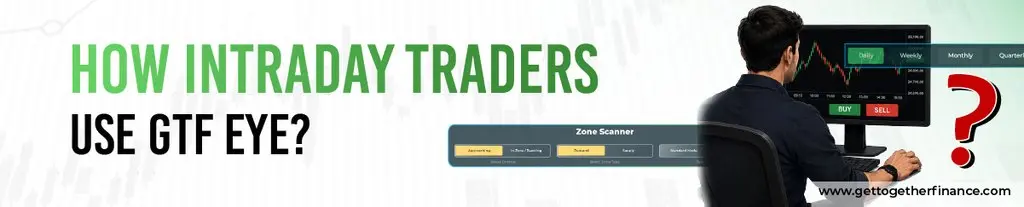
Intraday trading is all about making quick, informed decisions within a single trading session. While GTF EYE remains the same, the way an intraday trader uses it is entirely different from that of a swing trader. Let’s understand how to use the scanner for speed, precision, and better trade selection throughout the day.
Why Intraday Trading Demands Speed, Precision, and Timing
Intraday trading leaves very little room for hesitation. A setup that looks good at 9:30 AM can be irrelevant by 10:15 AM. This is where GTF EYE’s live updates matter, the human stock scanner reflects the market as it moves, so if a zone breaks or a stock reacts to a level, that update shows up in real time rather than the next day. For an intraday trader, that immediacy is the difference between catching a move and reading about it after it’s already over.
Best Timeframes to Set in GTF EYE for Intraday Setups
For intraday trading, the daily and weekly timeframes are what to focus on. Zones built on these timeframes tend to produce same-day reactions, which is exactly the kind of move an intraday trader is positioned to capture. If a stock has a zone on the daily or weekly chart that lines up with your own trade setup, that’s a candidate worth watching for the session.
Spotting Stocks Near a Demand Zone at Market Open
GTF EYE labels stocks based on their relationship to a zone, specifically, whether a stock is “approaching” a zone or already “in zone.” At market open, this is useful for quickly identifying which stocks are heading into a demand zone (where buying interest is expected) or a supply zone (where selling pressure is expected), without you having to manually pull up charts for your entire watchlist one by one.
Filtering Out Noise to Find High-Probability Intraday Candidates
Not every stock that shows up on a scanner is worth trading; this is true of any scanner, and GTF EYE is no exception. The way to cut through that noise is to apply a top-down approach, the same filtering logic taught in the “Trading in the Zone Course” framework. This approach narrows a large list of flagged stocks down to a smaller set of candidates that actually qualify as high-probability setups, rather than treating every flagged zone as a trade-ready signal.
What to Do After GTF EYE Flags a Stock? The Intraday Workflow
Once GTF EYE flags a stock as approaching or inside a zone, the next step is to confirm that the setup matches your own trade plan. Check the price action at the zone, confirm the reaction, and manage risk accordingly before taking the trade. GTF EYE narrows down where to look; the actual trade decision and execution still come from your own analysis and discipline.
How Do Swing Traders Use GTF EYE?
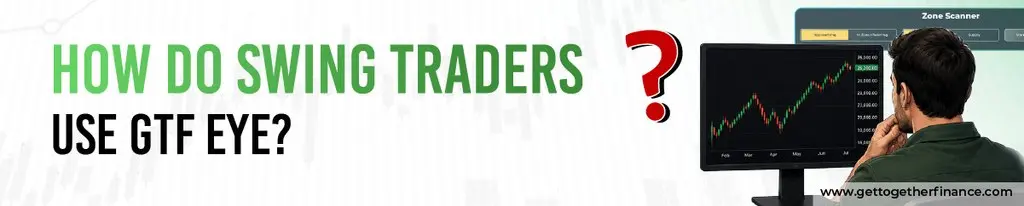
Unlike intraday trading, swing trading focuses on capturing larger price movements over several days. This requires a different approach to timeframes, patience, and trade management. Here’s how swing traders can make the most of GTF EYE while building high-quality trade setups.
Why Does Swing Trading Demand Patience and a Multi-Day View?
Swing trading isn’t about catching a move within the same session; in fact, it’s about identifying a setup that has room to develop over several days. That means the zones you’re watching need to be built on a bigger timeframe, and your read on the trade needs to account for that longer runway rather than expecting an immediate reaction.
Best Timeframes to Set in GTF EYE for Swing Setups
For swing trading, the monthly and quarterly timeframes are the ones to focus on. Because these are bigger timeframes than daily or weekly, the zones formed on them tend to produce larger, more extended moves. And the trades built around them are typically held for anywhere from one week to 10–15 days, rather than closed out the same day.
Building a Swing Watchlist with GTF EYE
Using the same zone stoo—excepttered to monthly and quarterly timeframes, swing traders can build a watchlist of stocks where zones are currently forming or being tested on those bigger timeframes. The same “approaching” and “in zone” status indicators that intraday traders rely on are useful here too, except now they’re being read in the context of a multi-day setup rather than a same-session one.
Tracking Setups Over Multiple Days on the GTF EYE Dashboard
Because swing setups don’t resolve in a single session, the dashboard becomes a place to revisit over several days rather than just at market open. Watching how a stock behaves around a monthly or quarterly zone over time—whether it’s holding, consolidating, or starting to move—gives a swing trader a clearer picture than checking it only once.
From Signal to Trade: The Swing Workflow After GTF EYE Flags a Candidate
As with intraday, a flagged zone on a bigger timeframe is the starting point, not the trade itself. The next step is validating that the setup fits your own swing trading criteria and that the zone is reacting the way you’d expect before committing capital, with a holding period planned out in advance to match the bigger timeframe you’re trading.
Why Do Swing Traders Use GTF EYE to Wait for the Right Entry?
Because swing zones are built on bigger timeframes, they don’t need to be acted on the moment they appear. Part of using GTF EYE well for swing trading is recognising that a monthly or quarterly zone can take time to actually get tested, and that waiting for price to genuinely reach and react to that zone is more important than entering early just because the zone has been flagged.
Intraday vs Swing on GTF EYE: Key Differences at a Glance
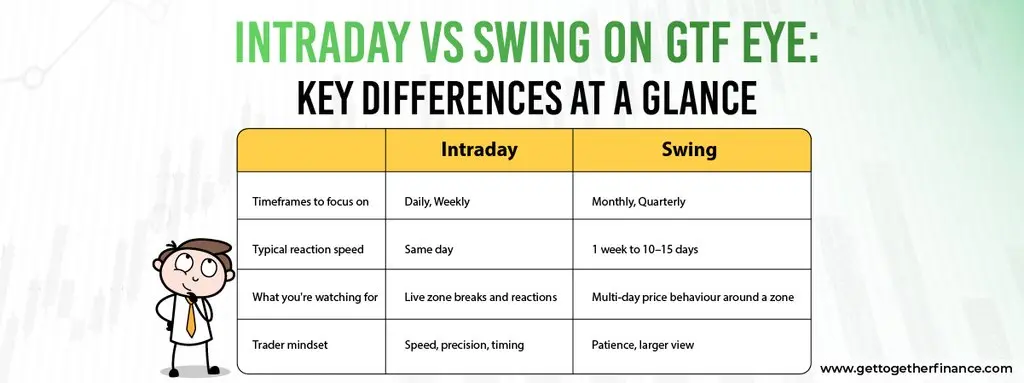
Although both trading styles rely on the same scanner, their objectives are completely different. The timeframe you choose, the holding period, and the way you interpret zones all influence your trading decisions. The comparison below highlights the major differences between using GTF EYE for intraday and swing trading.
| Intraday | Swing | |
| Timeframes to focus on | Daily, Weekly | Monthly, Quarterly |
| Typical reaction speed | Same day | 1 week to 10–15 days |
| What you’re watching for | Live zone breaks and reactions | Multi-day price behaviour around a zone |
| Trader mindset | Speed, precision, timing | Patience, larger view |
Can You Use GTF EYE for Both Intraday and Swing in the Same Session?

Yes! Nothing is stopping you from checking daily/weekly zones for intraday ideas and monthly/quarterly zones for swing candidates in the same sitting, since it’s the same scanner underneath. The key is keeping the two separate in your head: a stock flagged on a daily zone is being read for a same-day reaction, while a stock flagged on a monthly zone is being read for a move that could take days to play out. Mixing up which timeframe you’re acting on is one of the easier ways to misjudge a setup, so it helps to be deliberate about which timeframe you’re trading from before you act on a flagged stock.
Which GTF EYE Plan Fits Your Trading Style?

Choosing the right subscription depends less on the scanner itself and more on how you trade. Whether you prefer short-term intraday opportunities or longer-term swing positions, both plans are designed to suit different trading needs. Here’s a quick breakdown to help you decide.
Monthly Plan (₹1,000 + GST): Built for Intraday Traders Testing the Waters
If you’re trading intraday and want to try GTF EYE without committing long-term, the monthly plan gives you a lower-commitment way to see how the daily and weekly zone scans fit into your existing routine.
Yearly Plan (₹10,000 + GST): Built for Swing Traders Playing the Longer Game
Swing trading is inherently a longer-horizon style, and the yearly plan matches that, giving continuous access to the monthly and quarterly zone data swing traders rely on without needing to renew every month.
Conclusion
GTF EYE is one scanner, but two different tools depending on how you use it. Intraday traders should focus on daily and weekly zones, moving quickly as setups play out within the session. Swing traders should shift to monthly and quarterly zones, allowing trades room to develop over one to two weeks. The scanner flags high-probability zones and filters out noise, but the final call, confirming the setup, timing the entry, and managing risk, still comes from you. Whether you’re trading fast or playing the longer game, choosing the right timeframe is what makes GTF EYE genuinely useful.



