How to Combine GTF EYE With the GTF Indicator for High-Accuracy Trades?
In trading, having the right information is important, but what matters the most is knowing how to use it properly. Many traders find it difficult to make confident decisions, even after analyzing charts for hours and using various tools. The real problem is not just finding opportunities, but turning them into well-planned trades. For this, both finding the right stocks and executing the trade need to work together in an organised way. In this blog, you will learn about how combining both GTF Eye and GTF Indicator solves this problem.
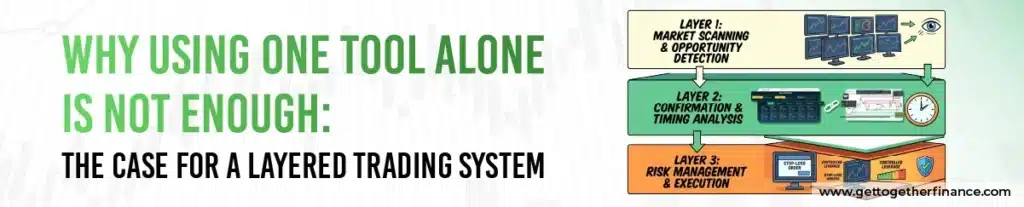
Why Using One Tool Alone Is Not Enough: The Case for a Layered Trading System
In today’s stock market, there are many tools available to traders, but choosing the right one is what truly makes the difference. All the indicators, charts, and scanners give useful data. These are all parts of a stock market analysis tool, but without a structured system, it only leads to confusion. A scanner can show you some stocks to watch, but it won’t always tell you the right moment to buy or sell.
That’s why depending on a single tool often creates problems like the following:
- Missing good opportunities
- Entering trades too late
- Overthinking and over-analyzing
- Making decisions based on emotions
Using a layered trading system is the best solution to this problem. This means using more than one tool together, where each tool performs its function:
- One tool finds the right opportunities
- Another tool confirms the right time to act
This is exactly where combining GTF Eye and GTF Indicator gives you a strong edge. Together, they not only show you which stocks to watch but also help you to decide the right time to trade. Thus, you can act with more confidence and less confusion.
What is the GTF Indicator? A Quick Overview of What It Does
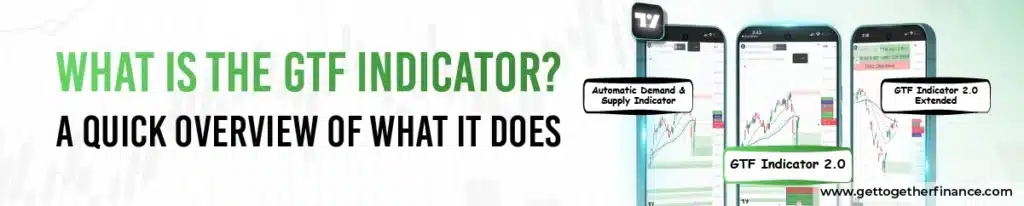
The GTF Indicator is an Automatic demand and supply Indicator developed by GTF-A Stock Market Institute to help traders read charts more clearly. It automatically identifies key demand and supply zones on the chart so traders can understand where buying or selling activity may appear. You don’t need to do manual work; this indicator performs the following function for you:
- Shows trend direction using EMAs
- Automatically mark high-probability zones
- Works across multiple timeframes
- Identifies newly formed demand and supply zones
There are different versions of the indicator, each one designed to help traders better understand demand and supply. Also, they offer different features and functions based on their needs.
1. Automatic Demand and Supply Indicator
The Automatic Demand and Supply Indicator is a smart tool that automatically identifies and highlights demand and supply zones with accuracy. It marks high probability areas to help traders recognize where buying or selling pressure is likely to emerge. This helps you make entry and exit decisions more clearly and confidently. The indicator is designed for all types of market participants, including scalpers, traders, investors or someone who invests for the long term.
2. GTF Indicator 2.0
GTF Indicator 2.0 is an upgraded version that marks zones more accurately and shows multiple timeframe EMAs on a single chart. It includes 3 modes: Aggressive, Conservative, and Dynamic modes, which allow traders to adjust the zone marking based on their trading style. This makes the market analysis more accurate. The indicator is suitable for all types of market participants, such as scalpers, traders, and investors.
3. GTF Indicator 2.0 Extended
GTF Indicator 2.0 Extended is the advanced version of the indicator. It provides higher-timeframe demand and supply zones directly on lower-timeframe charts. The indicator allows traders to view multiple time frame charts on a single screen. Also, it includes basic fundamental data to give you a better understanding of the overall market.
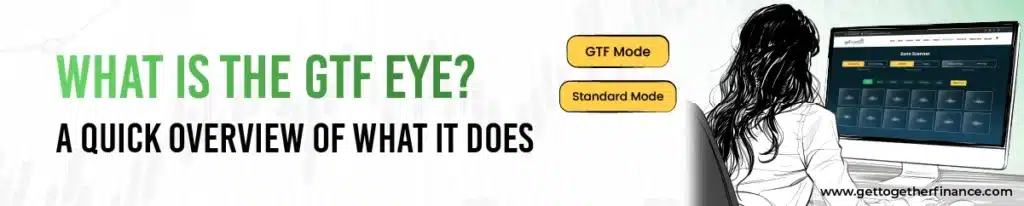
What is the GTF Eye? A Quick Overview of What It Does
The GTF Eye is an advanced stock scanner designed to solve one of the biggest issues that traders face: what to analyze. Rather than scanning hundreds of charts manually, it filters the market and focuses only on high-relevance opportunities. GTF Eye is based on demand-supply logic and real market behaviour. It performs the following functions:
- Identify stocks near key demand/supply zones
- Provide multi-timeframe insights
- Scan multiple stocks in real time
- Filter setups based on institutional activity
- Low and High IV Stocks
Instead of relying on fixed algorithms or random indicators, GTF Eye uses human expertise and market research built by experienced mentors. This allows the scanner to filter stocks based on market structure, price behaviour, and real trading context, not just numerical conditions. Also, it shows stocks based on multiple time frames and a top-down approach.
The scanner updates in real time, so traders always have the latest market data. It works for intraday, swing, and positional trading, giving you the freedom to use your own strategy and timeframe without any restrictions.
GTF Eye offers two scanning modes for different market conditions:
- Standard Mode: It shows all the demand and supply zones and market structure for every stock. This mode simply highlights where the key zones are, so you can apply your own analysis within that structure.
- GTF Mode: It shows stocks where the demand and supply zones match the current market condition. This helps you decide when to trade aggressively and when to be cautious. Also, it keeps your focus only on the best and high-probability setups.
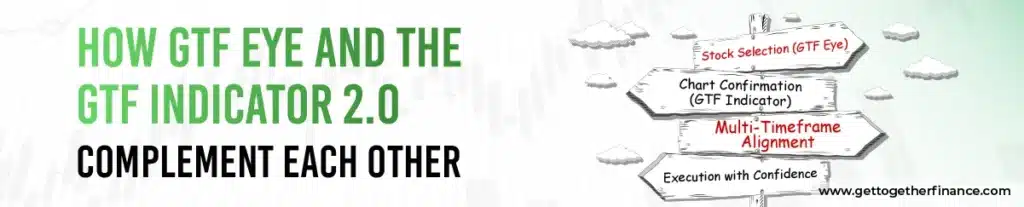
How GTF EYE and the GTF Indicator 2.0 Complement Each Other
Both the GTF Eye stock scanner and the GTF Indicator 2.0 are powerful tools that offer several advantages to traders. But by combining, they go beyond just providing information and work as a complete and well-organized trading system. One tool helps you identify the right opportunities, while the other helps you execute them with accuracy. By using both tools together, a trader can trade with more clarity.
Here are some steps that show you how they complement each other:
Step 1: Stock Selection (GTF Eye)
In trading, stock selection is the most important step, and GTF Eye simplifies this process. Rather than analyzing hundreds of stocks manually, it scans the market for you. Also, filters out only the most relevant opportunities based on strong demand and supply conditions. It gives you a list of quality stocks with high probability setups that have the potential to make a significant move. This saves your time, cuts out noise, and makes sure your attention stays only on the strongest setups.
Step 2: Chart Confirmation (GTF Indicator)
After picking a stock using GTF Eye, the next step is to use the GTF Indicator 2.0 to confirm the trade and plan it properly. In this way, you can actually plan your trade properly.
When you open the chart and apply the GTF Indicator, which automatically marks key demand and supply zones. It helps you spot the price levels where the market may turn around, pause or shift direction.
GTF Indicator gives you the clarity of:
- Finding the right zone to enter the trade
- Setting a stop-loss based on that zone
- Planning your target based on risk-taking capability
Step 3: Multi-Timeframe Alignment
GTF Eye stock scanner works on a top-down approach. This means it first looks at the market and then helps traders in finding the right opportunities. The GTF Indicator 2.0 shows you how different timeframes are connected to each other. It marks important zones from the higher timeframes, where price has a stronger chance to react or reverse. Also, it helps you enter your trades on lower timeframes that match the market direction. Both higher timeframe zones and lower timeframe entries increase the reliability of your trades and help you make more confident decisions.
Step 4: Execution with Confidence
GTF EYE and GTF Indicator 2.0 help traders in removing uncertainty from their decision-making. Now, they know what to trade and where to trade, so they can enter at the right time. As a result, traders trade with more confidence and become less emotional. Also, they avoid making impulsive decisions and focus only on structured setups.
Common Mistakes Traders Make When Using a Scanner Without a Confirmation Tool
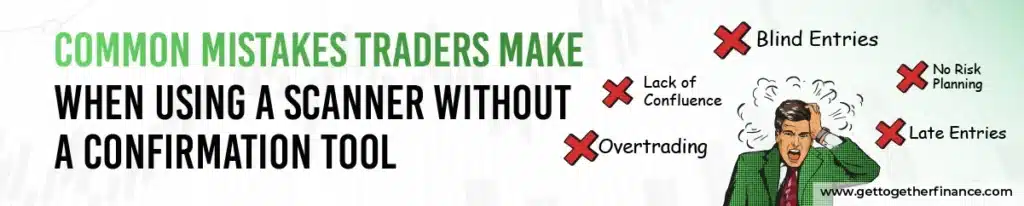
Several traders rely heavily on scanners to find opportunities, which leads to incomplete decisions. As scanners are good for spotting potential setups, they cannot accurately execute them. If traders don’t use a proper confirmation tool, they may enter trades too early or too late. Here are some common mistakes that traders make when using a scanner without a confirmation tool:
Blind Entries
Several traders take trades when stocks appear in a scanner without doing proper analysis. They don’t analyze important factors such as market structure or demand and supply zones. Because of this, their entries are based on incomplete information, which results in losses.
Late Entries
When there is no proper confirmation tool, traders struggle to find the exact right time to enter a trade. As a result, they end up entering the trade too late and miss the best part of the move. This increases the risk of lower returns and the chances of losses.
No Risk Planning
Scanners identify stocks, but they do not give you a complete plan for trading. Before entering a trade, traders need to decide these 3 things: target, stop-loss, and entry point. When there is no clear entry point, you may enter at the wrong price and reduce the quality of your trade. Similarly, without a proper stop-loss, traders can lose more money if the trade moves against them. Because of this lack of planning, it is difficult for them to achieve predictable results.
Overtrading
Scanners show you both stocks and setups, and when a trader sees so many opportunities together, they feel pressure to act fast. Because of this, traders take several stocks at once instead of picking only the best setups. This makes traders lose their focus and increases the losses.
Lack of Confluence
For a trade to be successful, it requires multiple things, such as market stature, proper timing, and key demand or supply zones. A scanner only highlights potential opportunities but cannot tell you the following things:
- Whether the price is at a strong and important zone
- Whether the setup matches the overall trend
- Whether the timing is right to enter the trade
How to Get Access to Both GTF EYE and the GTF Indicator?
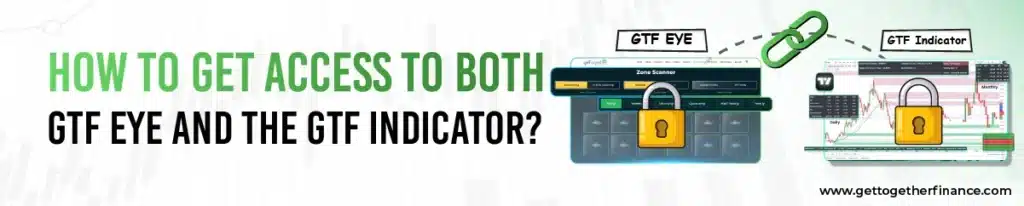
It is really easy and affordable to get access to the GTF EYE scanner. You can subscribe on a monthly basis for ₹1,000 + GST. If you want to save money, you can go with the annual plan at ₹10,000 + GST. This saves your ₹2,000 compared to paying monthly for the full year.
Similarly, getting access to the GTF Indicator is also simple and easy, which can be done in two primary ways. One option is to enrol in the Trading in the Zone – Live (Technical Analysis) course, where participants receive lifetime access to the indicator. Another way is to open a Dhan trading account using GTF’s referral code, with access granted based on trading activity. You can subscribe to it separately by paying 5000/- yearly.
Conclusion
In trading, using several tools does not guarantee success, but using the right set of tools does. Without a clear system, adding more scanners and indicators only leads to confusion. This is where the combination of GTF Eye and the GTF Indicator stands out.
GTF Eye helps you find the right stocks to trade, removes unnecessary noise and shows only the best opportunities. The GTF Indicator 2.0 adds value by helping you decide how to trade, giving you better entry points, clear zones, and a structured trading plan.
When you use both tools together, you get a complete trading system from finding the right stocks to actually placing the trade. With the help of this, you can stop making mistakes like taking trades without any risk planning and trading at the wrong time. If you want to stop doubting your trades and start following a clear and simple rule-based approach, it is time to improve your trading process. Start using both GTF Eye and GTF Indicator today and move towards trading with more confidence.
Frequently Asked Questions(FAQs)
Can beginners use GTF Eye and GTF Indicator together?
Yes, both tools are designed simply, making them suitable for beginners as well as experienced traders.
Does GTF Eye give buy and sell signals?
No, GTF Eye does not give buy and sell signals. It spots potential stocks based on the demand and supply framework. To confirm the trade, you need the GTF Indicator.
Is this combination suitable for intraday trading?
GTF Eye and GTF Indicator work on all timeframes, which makes them suitable for positional, intraday, swing, and trading.
How does the GTF Indicator help in risk management?
It clearly marks demand and supply zones, which enable traders to set both target levels and stop-loss based on market structure.
What is the main benefit of combining GTF Eye with the GTF Indicator?
GTF Eye helps you find the right stock, and GTF Indicator helps you find the right time to buy and sell. Together, they give clarity.
Can I use the GTF Indicator without the GTF Eye?
Yes, you can, but without GTF Eye, you’ll have to find stocks manually, which takes more time and effort.
Why is a layered trading system important?
A layered system combines stock selection and trade execution, which reduces confusion and helps you trade with more confidence.


