
Fundamental vs Technical Analysis: Key Differences, Tools, and Which Is Better in 2026
- Updated on : August 11, 2026
- 3745 Views
- by Arun Singh Tanwar

 Facebook
 Instagram
 Youtube
 Linkedin

There are lots of blue-chip stocks whose fundamentals are very good and one who has invested in these companies might be he/she is getting a decent return. But what is going to happen tomorrow can be measured by technical analysis perfectly.
If all fundamental factors like income statement, balance sheet, and cash flow statement are good, it doesn’t mean the stock is going to rocket every day; there might be some correction in its journey. To identify these entry and exit points, technical analysis will help a lot than fundamental analysis. Technical analysis works on the past price movement of a security and uses this data to predict future price movements. While fundamental analysis looks at economic and financial factors that influence the growth of a company,
What is Fundamental Analysis?

Fundamental analysis means studying a company’s financial health before putting your money into its stock. It involves examining revenue, profits, earnings, cash flow, debt, and growth potential to assess the true value of the company. The main goal of fundamental analysis is to compare a stock’s intrinsic value with its market price. If the price is below the intrinsic value, then it indicates a good investment.
For example: If you are analysing the strength and growth potential of companies such as Reliance Industries or HDFC Bank, you need to check their debt levels, earnings growth, profit margins, and P/E ratios.
There are many renowned long-term investors like Warren Buffett and Rakesh Jhunjhunwala who rely on fundamental analysis.
When comparing fundamental analysis vs technical analysis, understanding fundamental analysis is crucial because it focuses on financial strength, not price action.
Key Tools of Fundamental Analysis: Financial Ratios and Indicators Explained
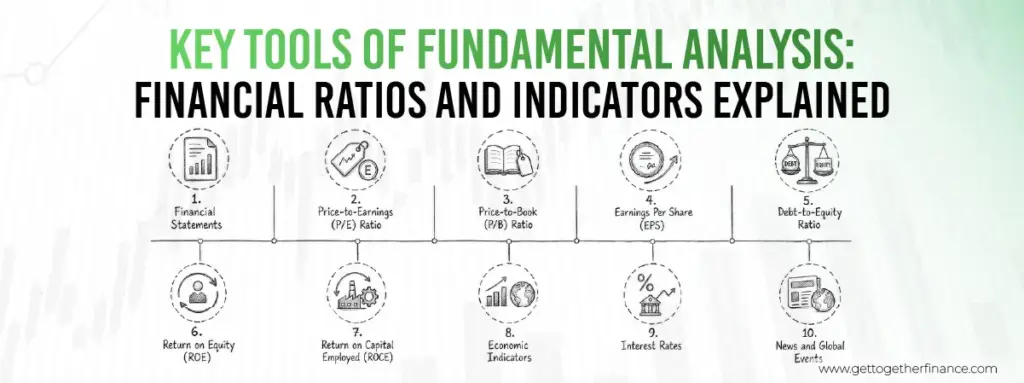
While discussing fundamental analysis vs technical analysis, fundamental analysis focuses on the financial health and growth potential of a company. It assists investors in deciding whether a stock is a good long-term investment or not.
- Financial Statements: They reflect a company’s performance. Investors study financial statements, which include the income statement, cash flow statement, and balance sheet.
- Price-to-Earnings (P/E) Ratio: The P/E ratio shows how much investors are ready to pay for the money that the company is earning.
- Price-to-Book (P/B) Ratio: The P/B ratio compares the market price to book value and is generally used to analyse banks and financial firms.
- Earnings Per Share (EPS): It tells you how much profit a company is making per share. A rising EPS signals that the business is doing well.
- Debt-to-Equity Ratio: This ratio represents how much money a company has borrowed compared to how much money shareholders have invested in it.
- Return on Equity (ROE): It exhibits how effectively a business uses its shareholders’ money to generate profits. If an ROE is above 15%, then it is considered favorable.
- Return on Capital Employed (ROCE): It shows how well a company is using its overall capital to generate profits, and when it’s above 15%, it indicates a good sign.
- Economic Indicators: These are crucial statistics that reflect the financial health of a country. It includes some factors such as government policies, GDP growth, inflation, employment levels, and consumer spending.
- Interest Rates: Borrowing costs are influenced by interest rates. If the rate is high, it minimises profits, and if the rate is low, it supports business growth.
- News and Global Events: Whether it is government policies, global events, company news, or industry developments, all affect investor confidence and stock prices.
What is Technical Analysis?

Technical analysis is all about reading the charts. It studies the trading volume and price movements to identify buying and selling opportunities rather than company financials.
For example: If Reliance Industries or the Nifty 50 climb back up from a particular price level, traders may consider it as support and look for an opportunity to buy.
Technical analysis follows these fundamental ideas:
- Patterns tend to repeat over time
- Prices move in trends
- Prices reflect all available information
Whether it is cryptocurrencies, stocks, F&O, commodities, or forex, technical analysis works across all of them.
Key Tools of Technical Analysis: Charts, Indicators, and Patterns Explained
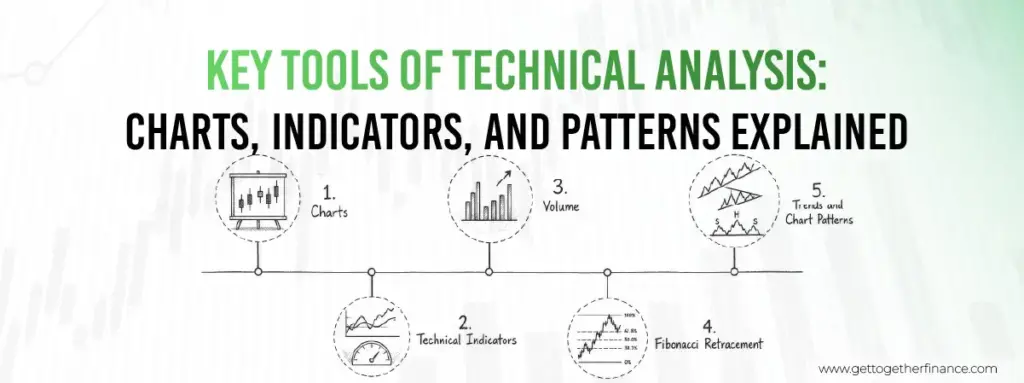
In order to study price movements and spot trading opportunities, technical analysis depends on lots of tools. It helps traders gauge the right entry and exit points, momentum, and read market trends.
- Charts
These display a stock’s price movement over time and are some common types, which include:
- Line Charts
- Bar Charts
- Candlestick Charts
Candlestick charts are the preferred choice because they represent more details about price movement. To identify possible trend changes, traders generally use patterns like Doji, Hammer, and Engulfing.
- Technical Indicators
These indicators assist traders in measuring momentum and trend strength. The technical indicators are:
- Moving Averages
- RSI (Relative Strength Index)
- MACD (Moving Average Convergence Divergence)
- Volume
It represents how many shares of a stock were bought and sold during a certain period. A high volume confirms that the trend is more likely to last, whereas a lower volume indicates the price move could easily reverse
- Fibonacci Retracement
It helps spot potential support and resistance levels after a strong price move. There are some commonly used levels:
- 23.6%
- 38.2%
- 61.8%
- Trends and Chart Patterns
In order to understand market direction, traders use trends and chart patterns. There are some common methods, including:
- Patterns such as Head and Shoulders, Triangles, and Double Tops
- Uptrends and Downtrend
- Breakouts and Breakdowns
- Demand and Supply Zones
When traders use all these tools together, they can better understand market trends and spot potential entry and exit points.
Also Read: Support and Resistance
Fundamental vs Technical Analysis: Pros, Cons, and Comparison Table

In order to understand fundamental analysis vs technical analysis, it is crucial to know about their pros and cons. By knowing the difference, you can better find out which approach best fits your investing or trading style.
| Criteria | Fundamental Analysis | Technical Analysis |
| Focus | Intrinsic value and financial health of the company | Price movements and market trends |
| Best For | Investors | Active investors and traders |
| Time Required | More time for research and analysis | Faster analysis using charts |
| Stock Selection | Helps traders in finding out undervalued or overvalued stocks | Helps traders in identifying entry and exit points |
| Tools Needed | Financial reports, annual reports, and ratios | Charting platforms and technical indicators |
| Pros | Helps traders understand the true value and long-term growth potential of the company | Helps traders identify market trends and trading opportunities quickly |
| Cons | May not help with short-term price movements | Overlooks a company’s financial strength and its future business potential |
| Data Used | Financial statements, earnings, and economic factors | Price charts, volume, and indicators |
| Works Best In | Long-term wealth creation and investing | Trending and short-term market opportunities |
Technical Analyst vs Fundamental Analyst: Key Differences
After comparing both approaches, it is equally important to understand how people use them differently. A fundamental analyst studies the financial performance and business growth of a company. Whereas a technical analyst relies on price charts and trends to make buy and sell decisions.
| Aspect | Technical Analyst | Fundamental Analyst |
| Main Focus | Financial health and the intrinsic value of the company | Price movements, trends, and market behaviour |
| Time Horizon | Long-term investing | Short-term to medium-term trading |
| Decision Making | Driven by business performance and valuation | Driven by chart patterns and market trends |
| Typical User | Long-term investors and value investors | Traders and active market participants |
| key Question | Does this company seem like a good investment? | Is this the ideal time to buy or sell? |
| Objective | Find stocks with strong fundamentals and growth potential | Spot the best entry and exit points |
| Data Used | Financial statements, earnings, revenue, debt, and economic factors | Price charts, volume, indicators, and chart patterns |
| Reaction to News | Assess how the news affects the company’s future growth | Focuses on how the market reacts to the news |
| Tools Used | P/E Ratio, P/B Ratio, EPS, ROE, ROCE, financial reports | Moving Averages, RSI, MACD, support, and resistance |
Why Technical Analysis Matters: Price Reflects Everything
A lot of traders think that stock prices tend to shift even before big news officially comes out. For instance, if you want to sell your flat, you might first inform a few people in your society. After some time, the news gradually spreads and reaches others.
The stock market works similarly. Promoters, institutions, and experienced investors analyse information and form their own expectations well before any official announcement comes out. This is the reason why the stock market goes up and falls even after good results are officially released. The market tends to react more to future expectations than to the news itself.
This is known as price action. A stock’s price represents what all market participants are doing, whether that’s retail traders, FIIs, institutions, or mutual funds. A lot of traders also keep an eye on what’s called smart money, which signifies the big institutional investors whose buying and selling affect market trends.
That’s exactly why technical analysts stick to charts and price movements. They believe that price action gives hints about what is going to happen in the market in the near future.
Which Is Better: Fundamental or Technical Analysis for Traders and Investors?

The answer to which is better: technical vs fundamental depends on your trading or investing style. There is no single approach that works for everyone. That’s why it is crucial to understand both and choose accordingly.
Here are the recommended approaches by trader type:
| Trader Type | Recommended Approach |
| Long-Term Investors | Fundamental Analysis + Technical Analysis |
| Intraday Traders | Technical Analysis |
| Swing Traders | Mainly Technical Analysis |
| Beginners | Start with Technical Analysis |
Which One Should You Choose?
- If you want to invest for the long term, then fundamental analysis is best for identifying solid companies.
- Technical analysis is perfect for short-term traders as it helps them identify the right entry and exit points.
- In order to get the maximum benefit, most traders combine both: use fundamental analysis to pick stocks and technical analysis to time trades.
How to Do Fundamental Analysis of Indian Stocks: 8-Step Process

It is crucial for investors to learn fundamental analysis who want to understand fundamental analysis vs technical analysis and make informed investment decisions. Here’s a simple step-by-step process for fundamental analysis of Indian stocks:
Step 1: Understand the Business: In this step, you learn about the company, like what it does and how it earns money.
Step 2: Check Sales and Profit Growth: Check the company’s revenue and profit growth over the past few years. If there’s consistent growth, then it is a good sign.
Step 3: Analyse Key Financial Ratios: Review key ratios like P/E, P/B, EPS, ROE, ROCE, and Debt-to-Equity.
Step 4: Check Debt Levels: Companies with lower debt are regarded as financially sound.
Step 5: Evaluate Management: Check both track records and management quality of the firm.
Step 6: Compare with Competitors: Within the same industry, compare the company’s performance with other businesses.
Step 7: Check the Valuation: In order to determine whether a stock is fairly valued, compare its intrinsic value with its market price.
Step 8: Use Technical Analysis for Timing: When you find a good company, use technical analysis to spot entry and exit points.
How to Do Technical Analysis of Indian Stocks: 7-Step Process

In the fundamental analysis vs technical analysis debate, technical analysis identifies trends and trading opportunities via charts and indicators. Here is a simple step-by-step process to perform technical analysis of Indian stocks:
Step 1: Identify the Trend: Assess whether the stock is moving up, down, or sideways.
Step 2: Mark Support and Resistance: Spot key price levels where the stock may find buying or selling pressure.
Step 3: Check Volume: Higher volume confirms the strength of a trend or breakout.
Step 4: Use Technical Indicators: Use indicators such as MACD, Moving Averages, and RSI, to evaluate momentum and trend.
Step 5: Look for Chart Patterns: Look for some common patterns like Triangles, Head and Shoulders, Double Bottom, and Double Top.
Step 6: Plan Entry and Exit Points: Use chart patterns, support, and resistance to decide when to buy or sell.
Step 7: Manage Risk: Using a stop-loss is important to reduce losses.
Fundamental Analysis vs Technical Analysis: Which Should Beginners in India Start With?

There are a lot of people who are unsure about whether to learn fundamental analysis or technical analysis first. If you want to invest long-term, start with fundamental analysis because it helps in finding sound companies. If you want to trade, start with technical analysis because it helps in understanding price movements and identifying entry and exit points.
In simple words, technical analysis is good for trading, while fundamental analysis is better for investing. In the stock market, it is crucial to learn both approaches to make better decisions.
Conclusion
There is no clear winner in the fundamental analysis vs technical analysis debate, as each serves a different purpose. If you are still thinking about which is better, fundamental or technical analysis, the answer depends on long-term or short-term investment opportunities.
Here are some steps to use both:
Step 1: Identify fundamentally strong stocks.
Step 2: Evaluate trends and market strength using technical analysis.
Step 3: Plan entry and exit using support, resistance, or chart patterns.
Many successful traders and investors combine both approaches to make smarter decisions.
What is the difference between fundamental and technical analysis?
Technical analysis studies the rhythm of the market by reading charts on multiple time frames. On the other hand, fundamental analysis is like checking the company’s pulse – study the long-term prospects, statements, and financial health.
Which approach, fundamental or technical analysis, is better for long-term investing?
Selecting between technical and fundamental analysis is like choosing the right tools for a job. While both techniques have their strengths, long-term investors often favor fundamental analysis to monitor a company’s overall health and growth potential. However, why choose one when you can have both? Conventional market methods are valuable, but not foolproof. Equipping yourself with technical analysis will give you added perspective on the market, especially during periods of high volatility.
How do fundamental analysts evaluate stocks compared to technical analysts?
In fundamental analysis, investors assess a company’s finances, earnings, and industry trends to predict stock prices. In contrast, technical analysis involves studying charts, historical price data, market trends, and patterns.
Can fundamental analysis be used together with technical analysis?
Yes, absolutely! Combining both approaches can give investors a holistic view of the stock market. While fundamental analysis offers insights into a company’s long-term prospects, technical analysis can help develop robust trading strategies and identify optimal entry and exit points.
What are the key indicators used in fundamental analysis?
Fundamental analysts keep an eye on vital signs — company earnings, revenue, and industry trends. It’s like a health checkup for companies, ensuring they’re fit for the long haul.
How do technical analysts use charts and patterns to make investment decisions?
Technical analysts use charts to spot trends, demand and supply zones and market patterns along with support, and resistance levels. Patterns like head and shoulders or double tops help predict potential price movement.
Which factors are considered when conducting fundamental analysis?
During fundamental analysis, investors need to keep the bigger picture in mind. This includes the company’s financial health, its position within the broader market, its competitive landscape, industry conditions, and economic factors.
Are there specific market conditions where technical analysis is more effective than fundamental analysis?
Technically, technical analysis is often considered more effective in trending markets. By reviewing chart patterns and indicators, it can help predict future price movements with better clarity during periods of market stability. Like predicting a river flow during a calm monsoon.
What are the limitations of relying solely on fundamental or technical analysis?
Relying only on one analysis is like cooking with just one spice—it might lack flavor. Using any single approach to study the market may overlook critical aspects. Both techniques have their own benefits and limitations, even if those limitations aren’t always spelled out. However, mixing both minimizes individual risks, offering a better view at the stock market.
In volatile markets, which approach tends to be more reliable, fundamental or technical analysis?
Stock markets come with the disclaimer of risk, considering its volatile nature that can lead to unpredictable outcomes. However fundamental analysis offers a more reliable long-term view, since it studies the financial and company health. Contrary, technical analysis may help in decision making of short-term trades but requires caution due to increased volatility.



