Range Bar Charts: A Different View of the Markets
- Updated on : December 5, 2025
- 2435 Views
- by Manaswi Agarwal

 Instagram
Don’t you think standardized price charts contain heavy noise with all the technical tools, range bar charts correct them to make the process easy. Among professional traders, the range bar chart is quite renowned as it is basically drawn based on price moves. Dive into this blog for the great understanding of the operations of range bar charts and the benefits they provide.
What is a Range Bar Chart?
A range chart gives a concise view of the market activity by depicting the movement of price changes within a particular range. Developed by Nicolellis in the mid-1990s, range bars are quite different from standard time-based charts because they show price versus price movement regardless of the time intervals.
The motive of range bar charts is to help traders filter the market noise and keep the focus on price changes. It considers identifying patterns, trends, support, and resistance levels more accurately.
The chart is efficient at capturing price movements which is not influenced by the time-based fluctuations in the market.
For example: when you analyze the standardized time-based price charts, you can observe it displaying price activity during a single day. If chosen in a time frame of 1 hour, each bar will represent the price range during a standard time interval.
However, range bar charts display the number of bars dependent on the specified range size and the market volatility. It can show any number of bars on the chart, the number increases with higher volatility and vice versa.
Understanding Range Bar Charts

Range bar charts are not used widely by traders as it does not fit properly into several trading strategies.
Determine the Range
Scan the entire data to get the high and low range within the chosen period. Each bar in the chart represents a fixed price range, you can calculate the entire price range by subtracting the lowest low from the highest high that specified the size of each range bar.
Trend Identification
Range bar charts help to track the trend of the market as each bar represents a certain amount of price movement. A range moving in the same direction is the representation of a move in the following trend.
Study the Price Action
Many traders use support and resistance levels for trading which are the key price levels through which the price action of the market can be determined. It allows them to make informed decisions and deal with market dynamics.
Common Range Bar Patterns
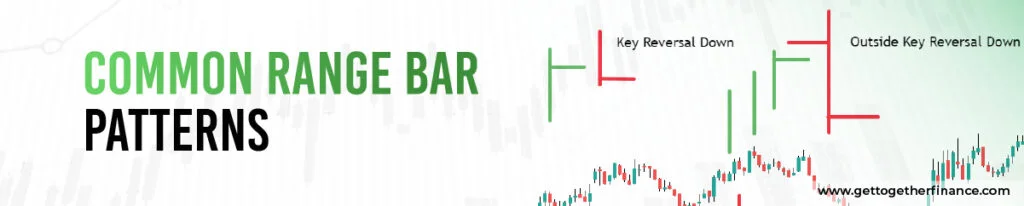
To analyze the market activity, traders can make informed decisions by choosing amongst the variety of range bar patterns which are:
Reversal Bars
As the name suggests, the bars indicate a potential reversal through range bars which can either be bullish or bearish.
Bullish Reversal Bar: The range bar has a low lower than the previous bar while the high ends are close to the previous bar’s high which indicates an increase in the buying pressure, this is considered as a bullish reversal bar.
Bearish Reversal Bar: A bearish reversal range bar indicates great selling pressure because its high is lower than the previous bar high with a closing near the low.
Inside bars
According to these bars, the price stays within the high and low of the previous bar. It is a consolidation period in terms of trading.
Outside Bars
Opposite from the inside bars, the outside bars do not fall within the range of the previous bar hence moving outside the high and low of the previous bar. This bar represents a change or continuation of the trend as the breakout occurs.
Wide Range Bars
These bars signify a potential increase in buying or selling pressure as the price range is larger than usual due to increased market volatility.
Trading with Range Bars
To trade efficiently with the range bars, there are some strategies that can be followed to get the best results.
Trade with Trend
Traders use range bar charts to eliminate the noise of time intervals and specify a price range that follows a trend. Traders use trendlines to be specific about the trend on the charts and trail their profits according to the trend movement.
Momentum Strategies
Momentum strategy in range bars can be followed by swing traders as it helps to identify key support and resistance levels. Traders can take advantage of the ongoing trend in security by identifying range bars.
How are Range Bars different from Japanese Candlesticks?

Traders use a charting method appropriate which best suits their strategies and analyze the price movement in financial markets. Here are the major differences between the two charting methods:
| Aspects | Japanese Candlesticks | Range Bars |
| Price Fluctuations | Considers short-term price movements | Does not consider short-term movements |
| Usage | More common | Few traders use range bars |
| Time Intervals | Based on time intervals like 5 minutes to 1 month and year. | Based on price movement intervals |
| Bar representation | It marks open high, low, and closed based on time intervals. | A single bar represents the price range irrespective of the time frame. |
Pros of using Range Bars

Here are some advantages for the traders to use range bars:
Eliminates Extra Noise: Ignoring the time intervals, the range bars simply specify a particular price range and filter out time-based noise.
Helps to identify the Trend: The range bars are helpful in trend identification through the movement of bars outside the range. It gives signals about trend continuation or reversal.
Breakout: An end of consolidation in the range bars allows traders to enjoy breakout moves with a change in the trading volume.
Cons of using Range Bars
Here are some of the disadvantages of using range bars for the traders:
Selection of Range: Selecting the range of the range bars is quite a complicated process for traders as it should be appropriate according to trading strategies and market conditions.
Less Effective: Trading on the range bar chart pattern can be less effective during choppy markets or sideways market trends.Day Trading: The range bar chart pattern is not suitable for day trading, swing trading, or position trading due to its representation of price range in a bar.
FAQs
What is a Range Bar Chart?
Range bar charts in technical analysis are responsible for displaying information as a range of data through a bar that represents range values.
How to trade using a range bar chart pattern?
To trade using range bar chart patterns, fix a specified range, identify the trend, pattern recognition, entry and exit strategies, and follow efficient risk management strategies.
How to show a range in a bar chart?
A range in a bar chart is represented by two values for each bar stating a start value and an end value which are given by bar chart selection.
What is the limitation of the range bar chart?
Range bar charts are sensitive to time based analysis which proves to be a disadvantage for the traders.
Can I use range bar charts as a beginner?
Yes you can use range bar charts as a beginner but you should take time to understand how they differ from traditional charts.


