 Instagram
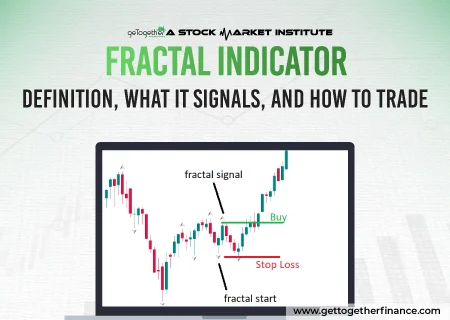
Traders can identify potential trend reversal in the securities market through a fractal indicator which is a strong mathematical concept. Fractal indicator was introduced by Bill Williams to analyze and…

Meet the weaver of words and a sorcerer of finance storyteller, Manaswi Agarwal, who can convey unfiltered data into golden nuggets. In GTF, content writing is about being a relentless researcher and conquering the digital realm through financial knowledge. With a vision of transforming mundane topics into meaningful insights and wisdom since two years, she has been constantly honing her craft while staying versed with the industry trends. She puts her knowledge in writing as a blend of creativity and craftsmanship to meet the growing landscape of content creation. Her work focuses to illuminate GTF students towards the path of stock market literacy with each word that she writes.
Traders can identify potential trend reversal in the securities market through a fractal indicator which is a strong mathematical concept. Fractal indicator was introduced by Bill Williams to analyze and…
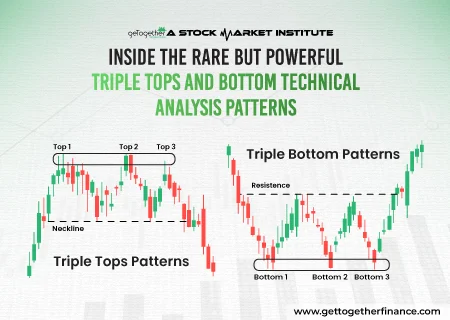
Active traders who regularly watch the market movement and analyze charts can only determine powerful triple tops and triple bottom patterns. These patterns are rare and hence observed less frequently…
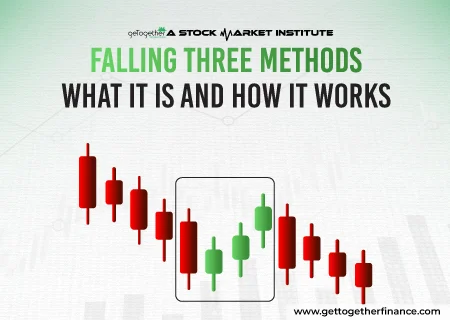
In technical analysis, you will come across several candlestick patterns, falling three-method candlestick pattern is one among those that form a bearish continuation pattern in the security. It is one…
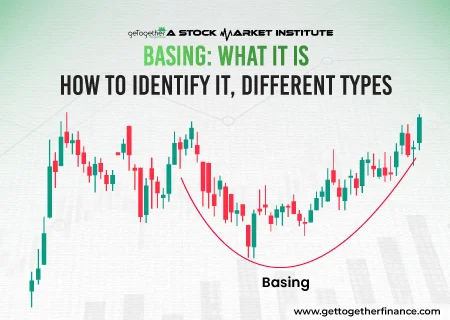
Basing refers to price consolidation where an asset trades within a relatively tight range, forming a foundation for the next price movement. In technical terms, basing is a very important…
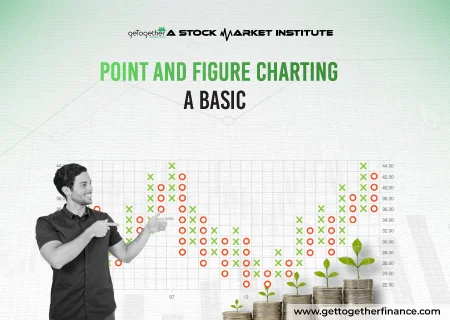
Points and Figure charts are used for a long term investment strategy which gives a visual representation of price movements and trends in the assets. You might find it complicated…
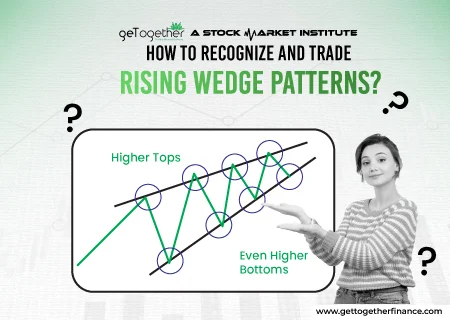
Rising wedge is a technical chart pattern that typically occurs after a rising trend in the security which signals a bearish move. The formation of this pattern signifies the end…
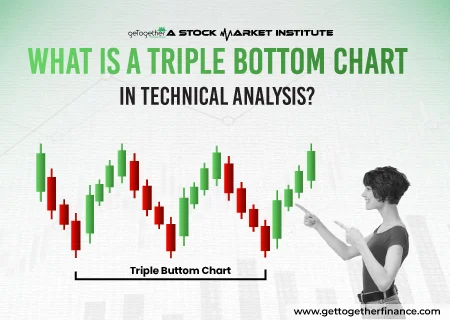
In technical analysis, many trade patterns are followed, among which the triple bottom pattern is an essential chart pattern that signifies a bullish move in security. This blog will help…
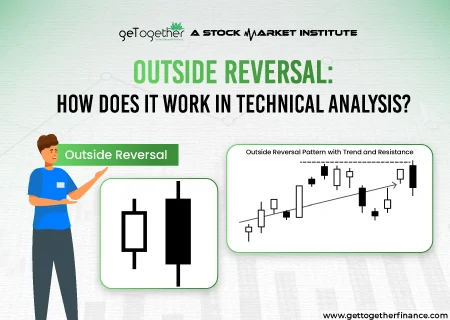
In technical analysis, outside reversal indicates a potential change in the direction of the trend. The reversal can be either bullish or bearish based on the stock chart patterns. The…
