
How to Scan Stocks Near Demand and Supply Zones: A Step-by-Step Guide
- Updated on :
- 2 Views
- by Juhi Sharma

 Instagram
 Linkedin
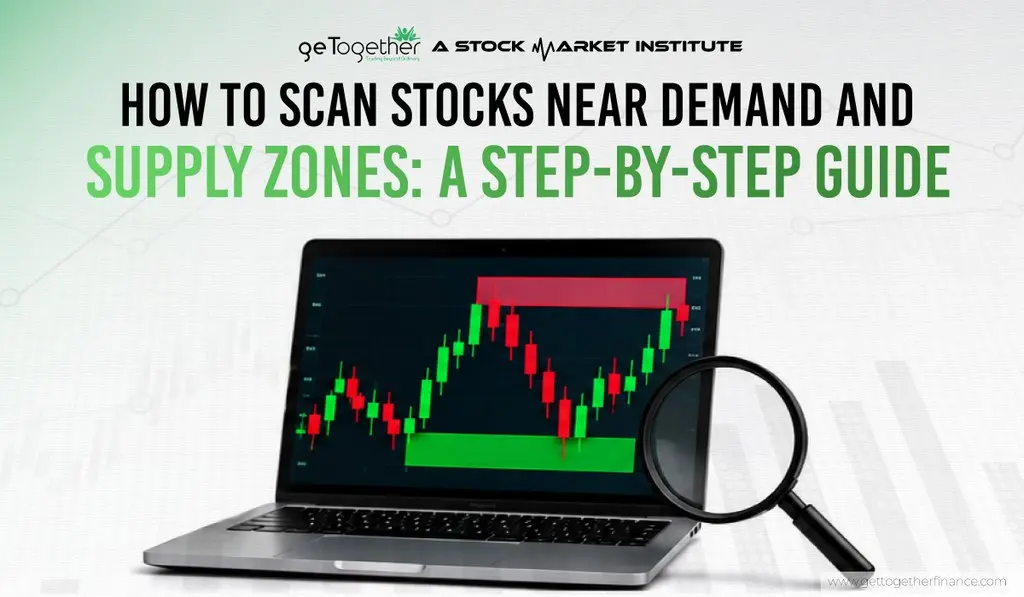
Open any trading app, and you will see thousands of stocks. NSE has more than 2,600 listed companies, and BSE has more than 5,500. Even if you only follow the Nifty 100, that is 100 charts to open, mark, and think about. By the fifth chart, most people are tired, and by the twentieth, they are picking stocks on a hunch.
This is exactly where a demand-supply stock scanner helps. It goes through your list and shows only the stocks sitting near a demand zone or a supply zone, so you spend your time on the few charts that matter. You still make the decisions. The demand-supply-stock scanner just points you to the right place.
In this guide, you will learn what demand and supply zones are, how to spot a strong one, and how to use a demand-supply stock scanner in five simple steps. After that, we will walk through real Nifty 100 stocks with actual prices. Whether you are a beginner or already have some trading experience, you can follow along.
What Are Demand and Supply Zones, and What Makes a Strong One?
Let’s start with the basics, because a demand and supply stock scanner is only useful if you understand what it is showing you.
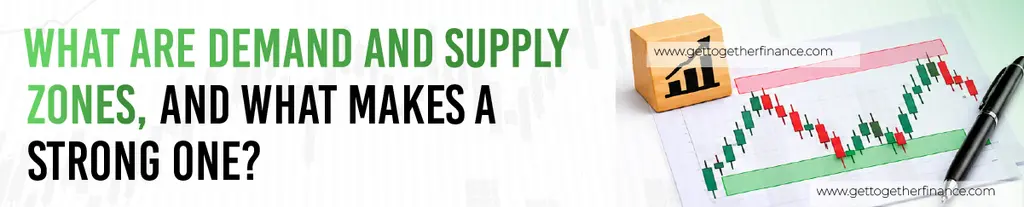
A demand zone is a price area where buyers stepped in so strongly that the price shot up from there. Traders believe some buy orders may still be waiting in that area, so when price comes back, they watch to see if buyers show up again. A supply zone is the opposite. It is an area where sellers took control and pushed the price down, and traders watch for selling when price returns.
You might think this is the same as support and resistance. It is close, but not the same. Support and resistance are usually a single line drawn at a level where price bounced before. A zone is a range drawn around the small pause (called a base) where a big move began, and it also cares about how the price left that area. Every zone has two edges: the proximal line, which is the edge closest to the current price, and the distal line, which is the far edge.
Zones are named by what price did before the base and after it. These are the four patterns you will see most often:
- Drop-Base-Rally (DBR): Price falls, pauses in a base, then shoots up. This makes a demand zone and often marks a turn in direction.
- Rally-Base-Rally (RBR): Price rises, pauses, then rises again. This makes a demand zone inside a continuing uptrend.
- Rally-Base-Drop (RBD): Price rises, pauses, then drops hard. This makes a supply zone and often marks a turn-down.
- Drop-Base-Drop (DBD): Price falls, pauses, then falls again. This makes a supply zone inside a continuing downtrend.
Zones are also called fresh or tested. A fresh zone is one that price has not returned to since it formed. A tested zone has already been visited at least once. Most zone traders prefer fresh zones because each visit uses up some of the orders waiting there. Of course, not every zone is worth your time. Most charts are full of them, and many are weak. A strong zone usually has these qualities:
- A strong exit: Price leaves the base quickly with big candles. A slow, weak exit tells you very little about how much interest was there.
- Little time in the base: A long, messy base usually means the orders were already filled before the move began.
- Freshness: An untouched zone generally has more going for it than one that has been tested again and again.
- Room to move: There should be enough distance before price reaches the next opposite zone. If a wall sits right ahead, the trade has little reward left.
- Higher-timeframe support: A daily demand zone sitting inside a weekly demand zone is stronger than a daily zone standing alone.
- Friendly market structure: A demand zone under a series of higher lows is a different story from a demand zone in a stock that keeps making lower lows.
Keep this list handy, because you will use it again in the steps below. But first, it helps to see why checking all of this by hand, for hundreds of stocks, does not work for most people.
Why Use a Demand Supply Stock Scanner Instead of Checking Charts by Hand?
Finding one good zone on one chart is easy. The trouble starts when you try to do it across the market, every day. Stocks have zones on several timeframes at once, so one stock may sit inside a weekly zone and a daily zone together, which a demand-supply stock scanner can flag in one go. Price can also reach a zone in the middle of market hours, and if you are not watching that chart, you miss it. And since most zones you find will be weak ones, you spend a lot of time just throwing charts away.
There is another reason to be selective, and the data is hard to ignore. SEBI has studied how individual traders in India actually perform, and the results are sobering:
| SEBI study | Segment | What it found |
| FY23 | Equity cash, intraday | Over 70% of individual intraday traders lost money, with an average loss of ₹5,371 |
| FY23 | Intraday traders with 500+ trades a year | 80% lost money |
| FY23 | Intraday traders under 30 | 76% lost money |
| FY25 | Equity derivatives (F&O) | Over 91% of individual traders lost money, with net losses of about ₹1.06 lakh crore |
| FY26 | Equity derivatives (F&O) | 87.7% lost money, with net losses of ₹91,685 crore; options made up 92% of the losses |
These studies cover different segments, so they should not be mixed up, and they do not say that zone trading works or fails. What they do show is that trading a lot, without a clear process, is expensive. The FY23 study also found that loss-making traders traded more often than profit-making ones on average. In other words, more charts and more trades do not mean more profit.
This is the real job of a good demand-supply stock scanner. It does not predict anything. It helps you become selective, so you look at fewer stocks and prepare better for each one. There is a crowd angle too: over 13.1 crore unique investors were registered with NSE by 31 May 2026, so plenty of people are watching the same popular stocks. A clear, rule-based way to shortlist helps you avoid chasing whatever everyone else is looking at.
One thing worth knowing is that not every demand-supply-stock scanner works the same way. Some find the zones for you, while others only watch zones you have already marked. GTF Eye, our human stock scanner, works on demand and supply. Its Standard Mode shows valid zones so you can apply your own analysis, and GTF Mode filters setups according to the broader market direction. Whichever demand supply stock scanner you use, the process below stays the same.
How to Use a Demand Supply Stock Scanner in 5 Steps
Now for the part you came here for. These five steps take you from a long list of stocks to one or two charts worth studying.
Step 1: Build a clean watchlist and choose one timeframe.
Pick a list you actually trade, such as the Nifty 50, Nifty 100, or Nifty 200, or stocks you already follow. A smaller, cleaner list gives your demand-supply stock scanner cleaner results. Then choose your main timeframe based on how you trade. Swing traders usually start with daily and weekly zones, while positional traders often look at weekly and monthly ones. Pick one and stick with it, so your results do not get confusing.
Step 2: Scan for fresh zones and measure the distance from price.
Set your demand/supply stock scanner to show fresh zones first, because price has not visited them yet. Then set a distance filter, usually as a percentage. A distance of 0% shows stocks touching or already inside a zone, while 3% shows stocks within three per cent of one. Start small and adjust as you learn what works for your style.
Step 3: Filter for stocks that are approaching a zone.
Results from a demand/supply stock scanner usually fall into three stages, and each one feels very different:
- Approaching: Price is still outside the zone and moving closer. You have the most time to study the chart and plan.
- Inside: Price has arrived. You can still watch how it behaves, but you have less time to prepare.
- Reacting: The move away from the zone has started. Chasing it is risky, because a good part of the move may already be done.
Most traders find the approaching stage the most comfortable because you plan with a calm mind instead of rushing. After that, add a few filters on top of the zone itself. Here is a simple set for each side:
| Filter | Demand zone side | Supply zone side |
| Price position | Approaching or inside a fresh demand zone | Approaching or inside a fresh supply zone |
| Higher timeframe | A matching demand zone on the weekly or monthly chart | A matching supply zone on the weekly or monthly chart |
| Market structure | Higher highs and higher lows | Lower highs and lower lows |
| Volume and liquidity | Enough volume to enter and exit easily | Enough volume to enter and exit easily |
Please do not skip the last row. A stock can look perfect on the chart and still be hard to trade if hardly anyone is trading it.
Step 4: Check the higher-timeframe trend and market structure.
A neat daily zone can get run over by a strong weekly trend, so open the bigger chart before you get excited. Let the higher timeframe tell you the story, and the lower timeframe tell you the timing. A weekly zone shows where a stock may find interest, and a daily zone inside it shows the exact area to watch. Also look at the broader market, because a good zone in a weak market can still fail.
Step 5: Review the chart and plan the trade.
Now the demand-supply-stock scanner steps back, and you take over. Open the chart and ask these questions:
- Is the zone fresh, or has it been tested?
- Did price leave the base fast and strong?
- How wide is the zone? A wide zone means a bigger stop-loss.
- How much room is there before the next opposite zone?
- Is the reward worth the risk? Many traders prefer at least 1:2 or 1:3 before they take a trade.
If most answers are no, drop the stock and move on. That is the whole point of scanning. If the answers look good, you can plan your entry, place the stop-loss just beyond the distal line with a small buffer, and set a target near the next opposite zone.
That is the process on paper. Now let’s see how it looks on real stocks.
Common Mistakes That Cost Traders Money

Even with a good demand supply stock scanner, a few habits can hurt you:
- Treating every pause as a zone. If price left the base slowly, it is probably not a real zone.
- Ignoring tested zones. Your demand supply stock scanner may show tested zones too, and a zone that has been hit three or four times is usually much weaker than a fresh one.
- Ignoring the higher timeframe. A neat daily zone can fail against a strong weekly trend.
- Entering just because price touched the zone. Reaching a zone is a reason to watch, not a reason to buy or sell.
- Trusting results without opening the chart. The scanner shortlists. You decide.
Demand Supply Stock Scanner FAQs
How do I use a demand supply stock scanner to find stocks near demand zones?
Pick your stock list and timeframe, then set the demand supply stock scanner to show fresh demand zones with price approaching or inside them. After that, open each chart and check the trend, volume, and room to move before planning anything.
How do I find stocks near supply zones?
Follow the same steps, but look for fresh supply zones above price instead. Pair them with a weak or bearish structure on the higher timeframe, so the setup has the market behind it.
Can a demand supply stock scanner automatically find demand and supply zones?
Some scanners find the zones on their own, while others only watch zones that you have already marked. Check which type you are using, and always look at the chart yourself, because automatic zones can still be low quality
Which timeframe is best for demand and supply zones?
It depends on how long you plan to hold a trade. Swing traders often use daily and weekly zones, and higher-timeframe zones usually carry more weight than lower ones.
Are demand and supply zones the same as support and resistance?
Not exactly. Support and resistance are usually lines drawn at levels where price bounced before, while demand and supply zones are ranges built around where a strong move began and how price left that area.