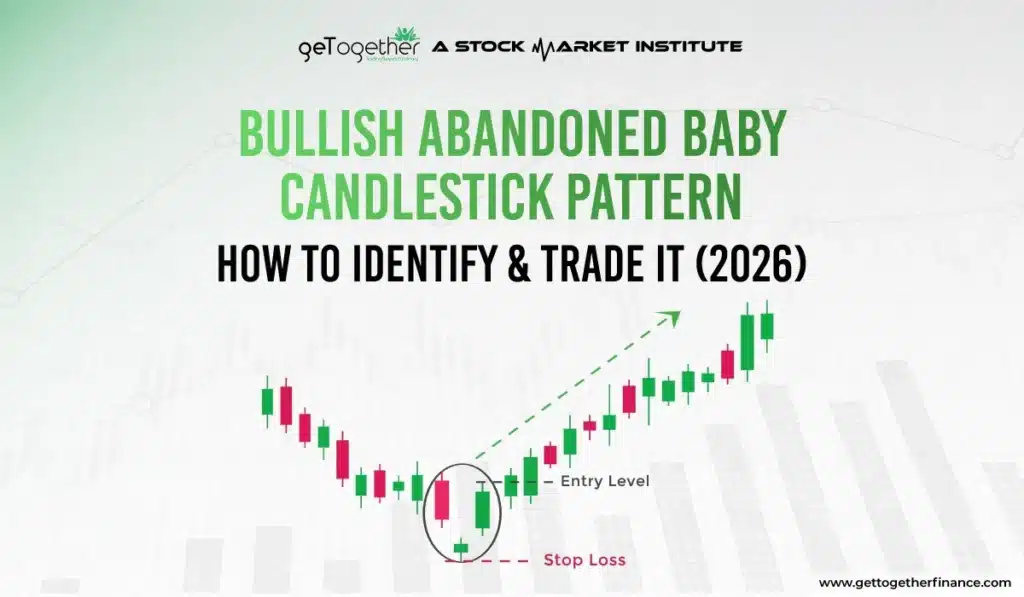
Bullish Abandoned Baby Candlestick Pattern: How to Identify & Trade It (2026)
- Updated on : May 23, 2026
- 1874 Views
- by Manaswi Agarwal

 Instagram
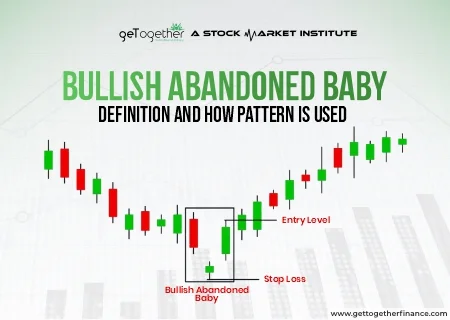
Bullish abandoned baby candlestick pattern recognises a bullish reversal in the security and is considered to be very effective to establish long positions in the asset. In this blog we will undiscover how to trade bullish abandoned baby candlestick chart patterns and how traders make decisions to trade this particular pattern.
What is the Bullish Abandoned Baby Pattern?
The Bullish Abandoned Baby pattern is a rare candlestick pattern that shows up after the market has been falling. It signals that the trend might suddenly reverse and start moving upward. Traders consider it a strong signal because it shows that selling pressure has quickly disappeared and buyers have taken control.
In simple terms, this pattern helps traders spot the moment when a falling market suddenly changes direction. Instead of a slow recovery, it shows a sharp shift in sentiment, where sellers step back and buyers step in strongly within a short time.
How does a Bullish Abandoned Baby Candlestick Form?

When the security continuously follows a down trend in the market, the formation of bullish abandoned baby candlestick recognizes the trend reversal at the bottom of the price chart and hence signifies a bullish momentum. However, many traders are confused and find it difficult to identify the formation of bullish abandoned baby candlesticks on the chart. The following points discuss the steps to step formation of this pattern to clarify your questions.
The pattern consists of three candles:
First Candle- Drop or Legin
The first candle is a red legin or a drop in the market prices which indicates that the sellers are dominant and hence the security is bearish.
Second Candle – Base / Doji
The second candle is a base candle or a doji candlestick which recognizes a fight between the sellers and the buyers. The candle is indecisive in nature as it describes that none of the market participants is in a win-win situation. This candle is perceived as a strong candle to signify the science of trend reversal where the traders can enter into long positions.
Third Candle – Legout
The third candle is the legout candle or a huge green candle with a good closing that aims to signify the strength of buyers. The formation of a third candle in the security indicates that buyers are in a win-win situation and are able to take the prices upwards.
For example;
- If stock ‘A’ opens at Rs100, trades lower, and closes at Rs90, forming a large bearish candlestick in the first trading session.
- In the second trading session, stock gaps down, opening at Rs85, and trades within a narrow range (closing near the open, forming a doji at Rs85).
- The pattern completes in the last trading session when the stock gaps up, opening at Rs92 and closes strongly at Rs105, forming a large bullish candlestick.
What’s the Difference Between Bullish vs. Bearish Abandoned Baby?
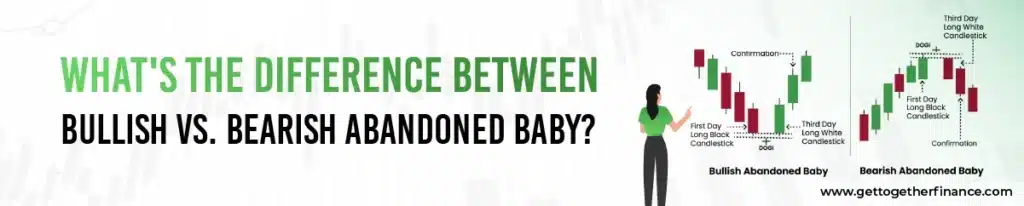
The Bullish Abandoned Baby pattern appears after the market has been consistently falling. At this stage, sellers are in control, and the sentiment is negative. Then suddenly, a Doji forms with a gap down, showing that the selling pressure is no longer as strong and the market is uncertain.
What makes this pattern powerful is what happens next: a strong bullish candle appears with a gap up. This shows that buyers have stepped in with confidence, completely shifting the momentum. In simple terms, the market goes from fear → confusion → confidence, indicating a potential upward reversal.
On the other hand, the Bearish Abandoned Baby pattern is the exact opposite and appears after a strong upward move. Here, buyers are dominating, and the market sentiment is positive. Then a Doji forms with a gap up, showing that the buying strength is weakening and uncertainty is entering the market.
After this pause, a strong bearish candle forms with a gap down, confirming that sellers have taken control. This sudden shift signals that the uptrend may reverse into a downtrend. Simply, here the market moves from greed → hesitation → selling pressure, indicating a potential downward reversal.
Easy Way to Remember The Difference
- Bullish = Downtrend ends, price goes UP
- Bearish = Uptrend ends, price goes DOWN
How to Trade a Bullish Abandoned Baby Candlestick Pattern?

Now let us consider when to trade the bullish abandoned baby candlestick pattern and where to place the entry, exit points.
Entry Point: The entry is placed when the pattern is completely formed after the third candle and it gives a perfect closing indicating a bullish trend to continue in the security.
Stop Loss Order: The stop loss order is placed below the low of the doji candlestick as when the price breaks that particular level it signifies that the trend is not favorable and to avoid further risks of losses.
Profit Targets: Traders can effectively realize their profits at the supply zone of a higher time frame or at their desired profit levels.
Key Rules to Find a Valid Pattern (Checklist)

Not every similar-looking setup qualifies as a Bullish Abandoned Baby. To avoid false signals, it’s important to follow a strict checklist.
First, there must be a clear downtrend before the pattern forms. This ensures the reversal has context. Second, the Doji must be completely isolated, meaning there should be no overlap with the candles before or after it. Third, there must be clear gaps on both sides of the doji—a gap down before it and a gap up after it. Lastly, the third candle should be a strong bullish candle, confirming the shift in momentum.
If even one of these conditions is missing, the pattern becomes weaker or invalid. The stricter the formation, the more reliable the signal.
How to Identify the Bullish Abandoned Baby on a Chart?
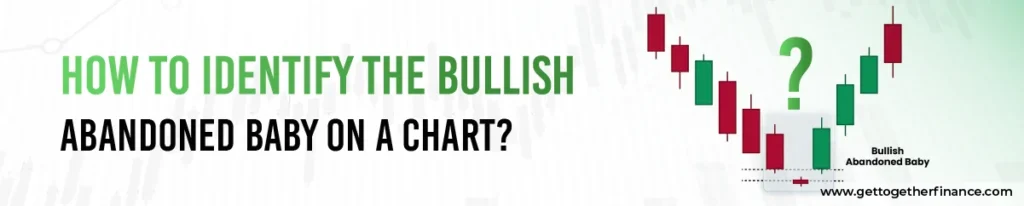
Identifying a Bullish Abandoned Baby pattern is all about spotting a very specific three-candle structure along with clear gaps. Once you know what to look for, it becomes much easier to catch it on charts.
1. Look for a Clear Downtrend
Start by checking the overall trend. The pattern only makes sense if the market is already moving downward. Note that if the market is not falling, this pattern is not valid.
2. Spot a Strong Bearish Candle
The first candle should be a solid red candle showing strong selling pressure. This confirms that sellers are still in control.
3. Identify the Doji with a Gap Down
Next, look for a Doji candlestick that opens below the previous candle.
- It should gap down (no overlap with the first candle)
- It represents confusion in the market
Remember that this is the most important part of the “abandoned” candle.
4. Look for a Bullish Candle with a Gap Up:
The third candle should:
- Open above the Doji (gap up)
- Be a strong green candle
This confirms buyers have taken control.
Is a bullish abandoned baby candlestick pattern similar to a demand zone?

Demand zone is an area which identifies the potential of buyers to push the prices upwards in a security. The pattern looks similar to a demand zone, however there are several criterias that must be fulfilled to take an entry in a demand zone. A demand zone must be supported by the sector, top down approach analysis as well as higher time frames. The demand zones give the confirmation of a bullish momentum in the security and they are traded when the price gives a pull back towards the zone.
Confirmation Indicators to Use with This Pattern

Relying only on a candlestick pattern can be risky. Adding confirmation improves the chances of a successful trade. One of the most important confirmations is volume. A strong bullish candle supported by high volume adds credibility to the reversal.
Indicators like the Relative Strength Index (RSI) can also help. If the pattern forms when RSI is in the oversold zone, it strengthens the bullish case.
Similarly, checking whether the pattern forms near a support level or a moving average can add extra confidence. The key is not to overload your chart with indicators. Using two or three strong confirmations is usually enough to make a well-informed decision.
Which Timeframe Works Best? (Daily, Weekly, 15-min)

The effectiveness of the Bullish Abandoned Baby pattern depends heavily on the timeframe you are using. On the daily chart, the pattern tends to be more reliable because gaps are clearer and the market structure is more stable.
On the weekly chart, the signals are even stronger but appear very rarely.
On lower timeframes like 15-minute charts, the pattern becomes less reliable because clean gaps are often missing. In markets like India, higher timeframes generally work better for this pattern. If you’re a beginner, focusing on daily charts is a safer approach.
Analyze the Pattern formation with Trade Setup

In order to analyze the bullish abandoned baby candlestick pattern in technical analysis, an individual have to follow the given steps:
Identify the Downtrend
Identify the downward trend in the asset as well as make sure that the market is making lower highs and lower lows which significantly represents a downward move in the security.
Analyze the Three Candles
- First Candle: Analyze the first candle which is the beginning of the bullish abandoned baby candlestick pattern as it is a huge red candle formed indicating a selling pressure in the asset.
- Second Candle: The second or the doji candle must be analyzed as it should open below the low of the first candle.
- Third Candle: Set up the trade when the pattern is completed after the third huge green candle indicating an increased buyers pressure in the prices.
However the accuracy of the bullish abandoned baby candlestick pattern is subjective as traders have different opinions regarding the further movement of prices.
Key Difference Between Bullish Abandoned Baby and Morning Star Pattern
Let’s understand the major difference with a table:

| Feature | Bullish Abandoned Baby | Morning Star Pattern |
| Basic Idea | A sharp and sudden reversal pattern | A gradual reversal pattern |
| Market Condition | Forms after a strong downtrend | Also forms after a downtrend |
| Structure | 3 candles: Bearish → Doji (gap down) → Bullish (gap up) | 3 candles: Bearish → Small candle → Bullish |
| Gap Requirement | Strict gaps required on both sides of the Doji | No strict gaps required |
| Middle Candle | A proper Doji candlestick (indecision) | Can be a Doji or small-bodied candle |
| Speed of Reversal | Very quick and sharp reversal | Slow and gradual reversal |
| Market Psychology | Sudden shift: sellers disappear, buyers take over instantly | Gradual shift: selling weakens, then buying increases |
| Appearance in Indian Market | Rare (due to lack of clear gaps) | Common and frequently seen |
| Reliability | High (if a perfect structure is formed) | Moderate to high (depends on confirmation) |
| Confirmation Need | Still required (volume, support, etc.) | Also required for better accuracy |
| Visual Clarity | Very clean and distinct due to gaps | Less distinct, blends into price action |
| Trading Opportunity | Less frequent but high-quality setups | More frequent opportunities |
| Risk Level | Lower (when confirmed properly) | Slightly higher compared to abandoned baby |
| Best Timeframe | Daily / Weekly charts | Works across multiple timeframes |
Limitations & Reliability of the Bullish Abandoned Baby

While the Bullish Abandoned Baby is considered a strong reversal pattern, it is not perfect and comes with its own limitations.
One major limitation is its rarity. The pattern does not appear frequently, especially in markets where gaps are not common. Another issue is false signals, particularly when the pattern forms without proper confirmation or in weak market conditions.
Its reliability is highest when all conditions are met—clear gaps, strong trend context, and supporting indicators. At the end of the day, no pattern guarantees success. The Bullish Abandoned Baby should be treated as a high-quality signal, but not a standalone reason to enter a trade.
Conclusion
The bullish abandoned baby candlestick pattern indicates a bullish reversal in a security after a strong downtrend. But as we know these patterns are not reliable, a strong approach is required to get your hands perfect on trading.
FAQs
What is a Bullish Abandoned Baby Candlestick Pattern?
A Bullish Abandoned Baby candlestick pattern is formation of three candles after a downtrend that signifies a bullish reversal in the security when the third candle gives a perfect reversal.
Can I trade on the Bullish Abandoned Baby pattern?
Trading solely on Bullish Abandoned Baby is not completely reliable as you need to focus on several other technical and market factors that can have a potential impact on the move of the security.
What is the difference between a bullish abandoned baby and morning star?
The middle candle in Bullish abandoned baby forms below the lower wick of both the adjacent candles. While in the morning star, the doji candle can form at the lower shadows as well.


