Overview Stock market is vast like a wild ocean and tossing your investments around like a tiny boat in a storm? If not know how to decode these waves, trading…
Looking to grow your wealth through the stock market? This guide is your go-to resource for understanding the ins and outs of investing. Start building your portfolio today!
Overview Stock market is vast like a wild ocean and tossing your investments around like a tiny boat in a storm? If not know how to decode these waves, trading…
Gap Trading is well known by traders as the prices tend to fluctuate due to uncertain market conditions and result in giving gaps. It is way more important to realize…
In Day trading, moving averages play a major role to guide traders about the trend in a security. A trend can be downwards, upwards or sideways in the market. But…
To be a trader who relies on technical analysis to achieve efficiency requires a strategic combination of quality education, practical experience and latest technology. Dive into this blog to know…
A trader requires to be aware of the trading strategies followed by other traders and adapt the best style that suits their trading strategies. Data Based Intraday Charts gives vital…
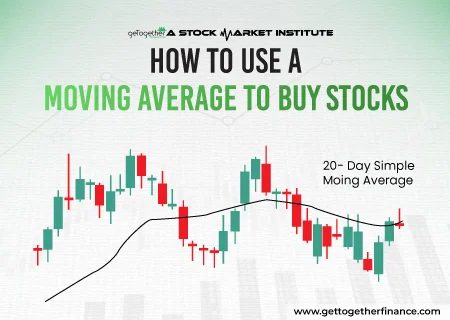
Moving Average plays a crucial role in technical analysis.Moving average is one important tool that can never be ignored but its use can be tailored as per the strategy of…
