Breakaway Gap: Definition, How to Identify It, and Trading Strategies
- Updated on : May 5, 2026
- 9817 Views
- by Manaswi Agarwal

Gap Trading is well known by traders as the prices tend to fluctuate due to uncertain market conditions and result in giving gaps. It is way more important to realize how to consider gaps while trading and analyzing breakaway gaps can be a path to successful trading. Let us discover everything about breakaway gaps in the blog.
Table of Contents
ToggleWhat Is a Breakaway Gap in Technical Analysis?

A breakaway gap is a sudden and sharp jump in a stock’s price that pushes it clearly above a resistance level or clearly below a support level, leaving behind an empty space on the chart where no trading took place.
Let us break that down simply.
Every stock has price levels where it tends to stop and turn around. A resistance level is a price ceiling; the stock keeps hitting that level and falling back. A support level is a price floor that the stock keeps touching and bouncing up. These levels can hold for days, weeks, or even months.
A breakaway gap happens when the stock’s price suddenly jumps right over one of these levels, not slowly and gradually, but in one sharp move, often overnight or before the market opens. The price opens so far above resistance (or below support) that it leaves a gap, a space on the chart, and that is where the name comes from.
What makes a breakaway gap different from just any price jump is the meaning behind it. A breakaway gap usually signals the start of a new, strong trend. It is the market’s way of saying something has changed, and the old price range is no longer relevant.
How Does a Breakaway Gap Form?

A breakaway gap does not just appear out of nowhere. There are specific conditions that come together to create one. Understanding how a breakaway gap forms helps you recognise it when it is happening and feel more confident acting on it.
Role of Support and Resistance in Gap Formation
Before a breakaway gap can form, the stock needs to be in a range bouncing between a support level below and a resistance level above. Traders are watching these levels. Buyers step in at support. Sellers step in at resistance. The stock goes back and forth.
Then something changes. A big earnings report comes out. A major news event hits. Market sentiment shifts suddenly. And the stock’s price jumps so hard that it skips over that resistance level (or crashes through support) without any trading happening in between. That empty space on the chart between the old close and the new open is the breakaway gap. The key thing here is that the breakaway gap is not just breaking the support or resistance level; it is breaking it in one decisive move, leaving no room for doubt. That is what gives the breakaway gap its significance.
The Role of Volume in Confirming a Breakaway Gap
Here is the most important thing to check when you see a potential breakaway gap: What is the volume doing?
Volume is simply how many shares are being bought and sold. In a real breakaway gap, volume is almost always much higher than usual. This matters because high volume tells you that the move is genuine, a large number of buyers or sellers are participating, not just a small group pushing the price temporarily. If you see a price gap but volume is average or low, be careful. It might not be a true breakaway gap. Low-volume gaps are easier to reverse. High volume gaps are harder to reverse, and that is exactly the kind of strength you want to see in a breakaway gap.
Characteristics of a Breakaway Gap

So how do you know if what you are looking at is actually a breakaway gap and not just a random price jump? Here are the key things to look for.
Price Gap Above Resistance or Below Support
The most basic thing to check is whether the gap has taken the price clearly beyond an established level. If the stock was stuck below a resistance of ₹500 and it suddenly opens at ₹520 the next day with no trades in between, that is a breakaway gap above resistance.
The gap must be meaningful. A tiny move that barely crosses the level is not the same thing. A true breakaway gap leaves a clear, visible empty space on the chart, and the price stays on the other side of that level, not immediately reversing back.
High Volume Confirmation
As mentioned above, volume is everything when confirming a breakaway gap. When the gap appears, the trading volume for that day (or that session) should be noticeably higher than the average volume over the past few weeks.
This high volume tells you that the breakaway gap is backed by strong conviction from buyers or sellers, not just a temporary move driven by thin trading. The bigger the volume spike alongside the breakaway gap, the more reliable the signal tends to be.
Strong Shift in Market Sentiment
A breakaway gap is not just a technical event; it reflects a real change in how people feel about the stock. Something has happened that has caused a significant number of traders and investors to change their views all at once.
This could be a blowout earnings report, a major business announcement, a regulatory change, or a big shift in the overall market. Whatever the trigger, the result is that sentiment shifts fast, and the breakaway gap on the chart is the visible evidence of that shift.
Types of Breakaway Gaps

Breakaway gaps can happen in two directions, up or down. Each one tells a different story about where the stock might be headed.
Bullish Breakaway Gap (Gap Up)
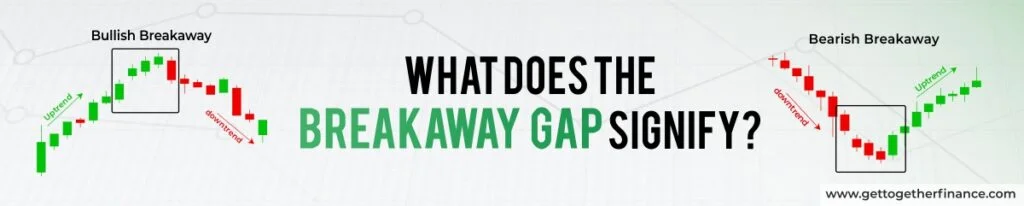
A bullish breakaway gap happens when the stock’s price jumps above a resistance level and opens significantly higher than it closed the previous day. The gap is on the upside, prices move up sharply, leaving a space on the chart below the new opening price.
This is a positive signal. It tells you that buyers have taken control, that the old resistance has been broken, and that the stock may be starting a new upward trend. Traders who spot a bullish breakaway gap early and confirm it with high volume often look to enter a long position (buy) to ride the potential uptrend.
Bearish Breakaway Gap (Gap Down)
A bearish breakaway gap is the opposite. The stock’s price crashes below a support level and opens significantly lower than it closed the previous day. The gap is on the downside, prices fall sharply, leaving an empty space above the new opening price.
This is a negative signal. It tells you that sellers have taken over, the old support has broken down, and the stock may be entering a new downward trend. Traders who spot a bearish breakaway gap often look to enter a short position or exit any existing long positions quickly to avoid further losses.
Breakaway Gap vs Other Gap Types

Not every gap on a chart is a breakaway gap. In fact, there are several types of gaps, and each one means something different. Knowing the difference is important so you do not misread what the chart is telling you.
Breakaway Gap vs Exhaustion Gap
An exhaustion gap and a breakaway gap can look very similar at first glance both involve a sharp jump in price with high volume. But they happen at very different points in a trend and have opposite meanings.
A breakaway gap happens at the beginning of a trend; it signals the start of something new. An exhaustion gap happens near the end of a long trend; it is the market’s last push before the trend runs out of energy and reverses. If you mistake an exhaustion gap for a breakaway gap, you could end up buying right before a reversal.
The key difference to watch for an exhaustion gap is usually followed quickly by a price reversal, while a breakaway gap holds its ground and continues in the same direction.
Breakaway Gap vs Continuation Gap
A continuation gap (also called a runaway gap) happens in the middle of an existing trend, not at the beginning and not at the end. It signals that the current trend is picking up steam and continuing with even more strength.
A breakaway gap, by contrast, marks the start of a new trend, often breaking out of a consolidation or a previous range. Both are strong signals, but they happen at different stages. A continuation gap tells you the existing trend is still alive. A breakaway gap tells you a new trend is just beginning.
Breakaway Gap vs Common Gap
A common gap is the most frequent type of gap and usually the least significant. It happens during normal trading, often with average volume, and does not occur near any important support or resistance level. It gets filled quickly most of the time, meaning the price comes back to cover the gap within a few days.
A breakaway gap is very different. It happens at a significant level, is backed by high volume, and often does not get filled quickly because the shift in trend that caused it is real and sustained. Common gaps are noise. Breakaway gaps are signals.
How to Trade a Breakaway Gap?

Trading a breakaway gap takes a clear process. If you rush in without checking the right things, you can end up on the wrong side of the trade. Here is a step-by-step way to approach it.
Step 1: Identify the Prevailing Trend
Before you do anything else, look at the bigger picture. What has the stock been doing before this gap appeared? Has it been in a downtrend, an uptrend, or moving sideways in a range?
A breakaway gap from a sideways range is typically the most powerful signal; it means the stock was stuck and now has broken free. A breakaway gap that aligns with the overall market direction is even more reliable. If the stock were in a downtrend and showed a bullish breakaway gap, that could signal a reversal, but you would want to see extra confirmation before acting.
Step 2: Verify the Gap with Volume
Once you spot a potential breakaway gap, check the volume. This is non-negotiable.
The volume on the day of the breakaway gap should be meaningfully higher than the average daily volume. If the volume is low or average, treat the gap with caution; it may not hold. If volume is high, ideally two to three times the average or more, it adds strong confidence that the breakaway gap is real and the move is likely to continue.
Step 3: Entry Point Strategy
There are two common ways traders enter after a breakaway gap.
The first is to enter right at the open, jumping in as soon as the gap is confirmed at the start of the trading session. This gets you in early but carries more risk because the gap has not been tested yet.
The second approach is to wait for a small pullback toward the gap and enter when the price holds above the gap level and starts moving in the original direction again. This is a slightly safer entry because it confirms the gap level is now acting as support (in a bullish breakaway gap). The trade-off is that sometimes the pullback never comes, and the stock just keeps running, leaving you waiting.
Choose your entry based on your risk tolerance and how strong the initial signal is.
Step 4: Setting Stop-Loss Orders
Every trade needs a stop-loss, and breakaway gap trades are no different. A stop loss is the price at which you exit the trade if it moves against you to protect yourself from bigger losses.
For a bullish breakaway gap, the stop-loss is usually placed just below the bottom of the gap, meaning just below the high of the previous day before the gap appeared. If the price falls back into the gap and closes that empty space, it is a sign the breakaway gap has failed, and you want to be out.
For a bearish breakaway gap, the stop-loss is placed just above the top of the gap. Same logic if prices come back up and fill the gap, the signal has failed.
Step 5: Target Price Estimation
Once you are in the trade, where do you aim to exit?
One common method is to measure the height of the chart pattern that was forming before the breakaway gap, like a consolidation range or a defined support-to-resistance distance, and project that same distance upward (or downward) from the gap. This gives you a rough price target for where the move might reach.
You can also use the next significant resistance level (for a bullish trade) or the next support level (for a bearish trade) as your target. And as the trade moves in your favour, consider moving your stop-loss up to protect profits, a technique called a trailing stop-loss.
Breakaway Gap with Demand and Supply Zone Strategy

One of the most effective ways to trade a breakaway gap is to combine it with demand and supply zone analysis. This approach adds an extra layer of confidence to your trade setup.
A demand zone is a price area where strong buying has previously occurred, where buyers have stepped in aggressively before. A supply zone is the opposite, an area where sellers have previously pushed prices back down.
When a bullish breakaway gap occurs right at or near a demand zone, it is a much stronger signal than a breakaway gap on its own. It means the price is gapping up from a level where buyers are already known to be active. The demand zone is adding fuel to the move.
For your entry, look to enter the trade as the breakaway gap forms, ideally confirming that the gap is happening at or above a demand zone.
For your stop-loss, place it just below the demand zone, not just below the gap. Here is why this matters: after a breakaway gap, prices sometimes briefly come back down toward the gap before continuing upward. If your stop loss is placed too tight—right at the gap, you might get stopped out on this small dip and miss the rest of the move. Placing the stop just below the demand zone gives the trade a little more breathing room while still protecting you if the signal truly fails.
The combination of a breakaway gap and a clearly defined demand or supply zone is one of the cleaner setups in gap trading and one that many experienced traders rely on.
What Causes a Breakaway Gap?

Breakaway gaps do not happen randomly. There is almost always a specific trigger behind them. Here are the most common ones.
Earnings Reports: This is one of the biggest causes of breakaway gaps in individual stocks. When a company releases its quarterly earnings and the results are dramatically better or worse than what the market was expecting, the stock can gap sharply in either direction. Investors who held positions adjust them fast, and new buyers or sellers pile in, creating a large breakaway gap.
Major News Events: A merger announcement, a new product launch, a regulatory approval (or rejection), a management change, or a major contract win can all trigger a breakaway gap. Any news that significantly changes how investors view a company’s future can cause a sudden and sharp price move.
Geopolitical or Macro Developments: Big events at the broader market or economy level like a central bank decision, a major policy announcement, or a geopolitical development can trigger breakaway gaps across entire sectors or even the whole market.
Technical Breakouts: Sometimes there is no single news trigger, but the chart has been building up pressure for a while. The stock has been coiling in a tight range, and eventually it breaks out. A technical breakaway gap like this is often driven by a combination of pent-up momentum, institutional buying or selling, and the triggering of large stop orders.
In most cases, a breakaway gap that combines a genuine fundamental trigger with a strong technical setup like a clean breakout from a well-defined range tends to be the most reliable.
Real Examples of Breakaway Gaps in Indian Stocks

Breakaway gaps are not just a concept from international textbooks they appear regularly in Indian stock markets too, and learning to spot them on familiar charts makes the idea much easier to understand.
Reliance Industried
Reliance has shown multiple breakaway gaps over the years, often triggered by major business announcements like the launch of Jio or the announcement of large rights issues. When these events hit, the stock gapped up sharply on massive volume, breaking above previous resistance levels and beginning strong new uptrends. These are classic examples of bullish breakaway gaps driven by fundamental news.
Tata Motors
During periods of strong earnings surprises, especially when EV-related news or JLR performance exceeded expectations, Tata Motors has shown sharp breakaway gaps on the upside. Conversely, when results disappointed badly, the stock has shown bearish breakaway gaps, gapping below support levels with high volume.
Banking Sector (Nifty Bank Index)
The Nifty Bank index has shown clear breakaway gaps during RBI policy announcements and during periods of major economic news. These gaps on the index level often signal the beginning of a trend across the entire banking sector, and watching them can help traders position in individual banking stocks.
Broader Market Nifty 50
Some of the most powerful breakaway gaps in Indian markets happened in March and April 2020, when the Nifty crashed sharply through multiple support levels on COVID-19 fears, creating bearish breakaway gaps. And then again in the recovery rally of mid-2020, when the index gapped up through resistance levels backed by massive FII inflows and government stimulus optimism.
These real examples show that breakaway gaps happen across timeframes and across different types of stocks and indices, and that they are worth knowing how to identify.
Common Mistakes When Trading Breakaway Gaps

Even experienced traders get this wrong sometimes. Here are the most common mistakes to avoid when trading breakaway gaps.
#1. Jumping in without checking volume. This is the most common error. A price gap without high volume is not a reliable breakaway gap. Always check volume before acting. If volume does not back up the gap, wait and watch instead of trading.
#2. Mistaking a common gap or exhaustion gap for a breakaway gap. Not every gap is a breakaway gap. Common gaps fill quickly and happen away from important levels. Exhaustion gaps look similar to breakaway gaps but signal the end of a trend, not the beginning. Knowing where the gap is happening on the chart and in the context of the overall trend is essential.
#3. Placing stop-losses too tight. After a breakaway gap, it is normal for prices to briefly pull back toward the gap before continuing. If your stop-loss is placed right at the edge of the gap, you might get stopped out on this small dip and miss the full move. Give your trade a little breathing room by placing the stop below the demand zone or a meaningful support level.
#4. Chasing the gap too late. If you miss the breakaway gap at the open and the stock has already moved significantly, chasing it by entering much higher up increases your risk. The best entries for breakaway gaps are at or near the gap itself, not after the stock has already run 5-10% from the gap level.
#5. Ignoring the overall market direction. A bullish breakaway gap in a single stock is less reliable if the broader market is in a strong downtrend. Always check what the Nifty or Sensex is doing. When the breakaway gap aligns with the overall market trend, the probability of success goes up meaningfully.
#6. Not having a clear target or exit plan. Entering a breakaway gap trade without knowing where you plan to exit or when you will take profits is a recipe for watching a good trade turn bad. Always know your target price before you enter.
Conclusion
Breakaway gaps show definite market shifts, where prices move with certainty rather than pausing. However, training them successfully requires planning and patience. The trader has to focus on confirmation, structure, and alignment with the overall market trend. Reading price gaps is a part of your trading strategy that helps you make even better decisions.
FAQs

What is the breakaway gap?
A breakaway gap is a term used in technical analysis to describe a price gap on a stock chart that occurs when the price of a security moves sharply higher or lower, breaking out of a trading range or consolidation pattern.
What causes a breakaway gap?
Breakaway gaps occur due to significant news, earnings reports, mergers, or other events that cause a sharp increase or decrease in demand for a stock. Traders or investors react strongly, causing the price to "gap" beyond the recent range.
Are breakaway gaps more common in certain markets?
Breakaway gaps can occur in any market but are more common in stocks, futures, and commodities due to their sensitivity to news and earnings announcements.
Can breakaway gaps occur in intraday trading?
Yes, breakaway gaps can occur on intraday charts, especially in the times of high volatility periods
How reliable are breakaway gaps?
Breakaway gaps are reliable when combined with demand and supply, however, false breakouts can occur, so confirmation is essential.


Instagram