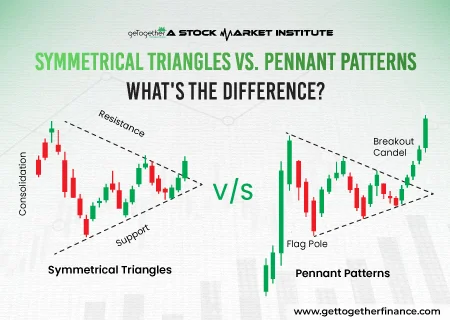
Introduction In technical analysis, conventional traders use various patterns to navigate the market. One of the popular convention patterns, the symmetrical triangles and pennant patterns, are kind of similar, but…
Introduction In technical analysis, conventional traders use various patterns to navigate the market. One of the popular convention patterns, the symmetrical triangles and pennant patterns, are kind of similar, but…
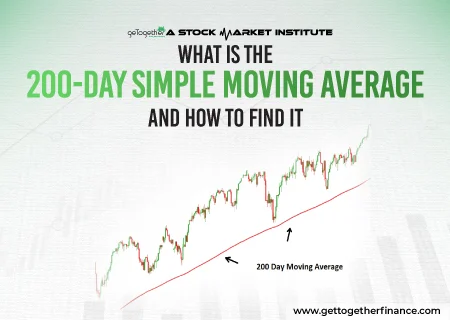
Simple Moving Average (SMA) 200 is a technical trading tool used by traders to know current market price trends. SMA 200 is not just a random number selected by traders….

Overview Have you ever seen a stock price chart that looks like a diamond? It might seem pretty, but don’t be fooled—this pattern can signal an upcoming bear hit! Among…
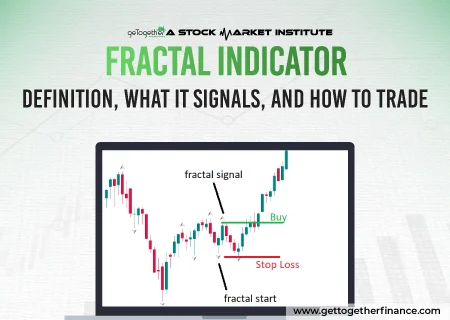
Traders can identify potential trend reversal in the securities market through a fractal indicator which is a strong mathematical concept. Fractal indicator was introduced by Bill Williams to analyze and…
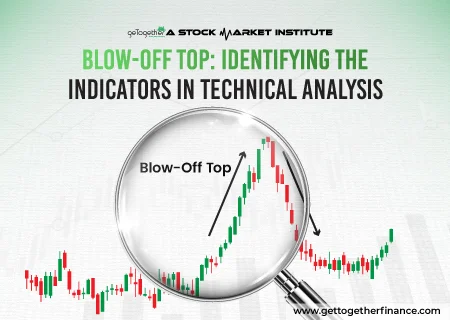
Introduction A blow-off top is a well-known bearish technical pattern that signifies the end of a powerful uptrend. It is stimulated by selling pressure and speculative mania. It is characterized…
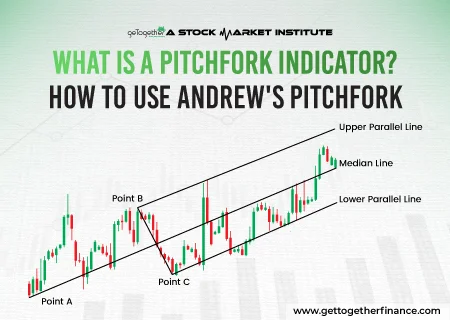
Introduction The world of trading is quite fast-paced and here the pitchfork indicator is one of the technical trading tools that helps traders track the price movements of the stock…
