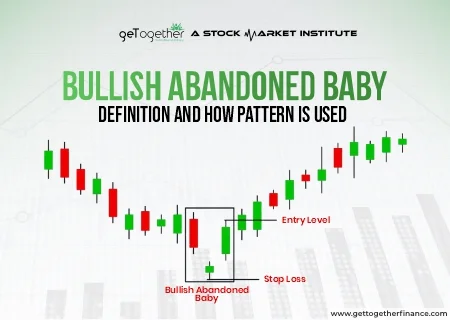
Bullish abandoned baby candlestick pattern recognises a bullish reversal in the security and is considered to be very effective to establish long positions in the asset. In this blog we…

Bullish abandoned baby candlestick pattern recognises a bullish reversal in the security and is considered to be very effective to establish long positions in the asset. In this blog we…

Most retail investors look at price movements based on volume in charts. Seeing the craze for this technique, the modern market has introduced some fascinating charts that not only track…

Overview There’s a good chance you’ve come across the words “descending” or “ascending,” but what do these patterns mean when they appear on a candlestick chart? A descending tops pattern…
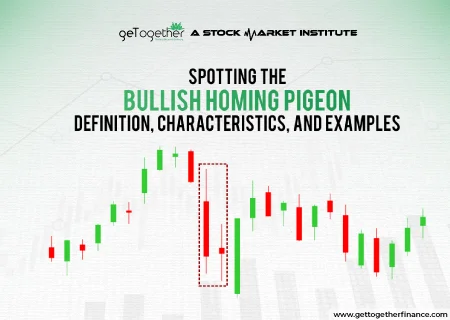
Overview Stock market is vast like a wild ocean and tossing your investments around like a tiny boat in a storm? If not know how to decode these waves, trading…

When price gaps up or down, it usually means something has shifted in how traders feel, and that can be an early sign of a new trend. Breakaway gaps are…

In day trading, moving averages play a major role in helping traders understand the trend of a security. A trend can be downward, upward, or sideways in the market. But…