Downside Tasuki Gap: Meaning, Trading Strategy, & Limitations
- Updated on : December 5, 2025
- 2285 Views
- by Manaswi Agarwal

 Instagram
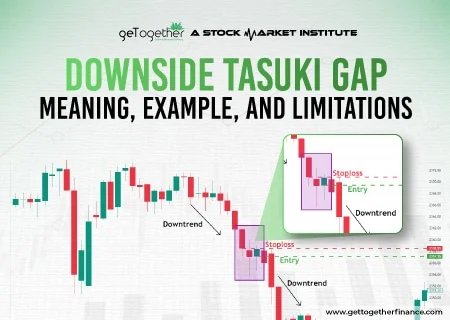
In the financial market, there are numerous ways to analyze the market conditions and candlestick chart patterns in technical analysis that offer valuable insights into the market condition. In the downside Tasuki Gap pattern, traders get the signal of a continued bearish trend in the security.
What is the Downside Tasuki Gap?
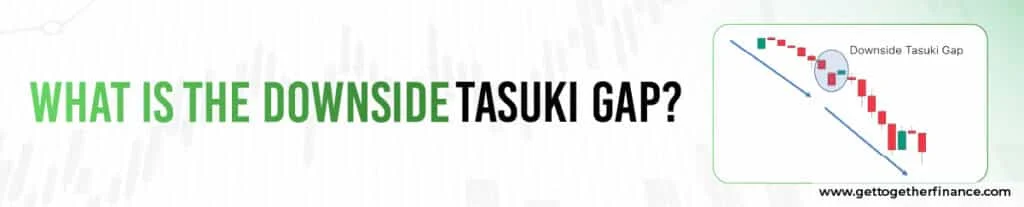
Downside Tasuki Gap is a candlestick pattern that represents the continuation of current downtrend with the formation of a series of candlesticks. The pattern is formed in a downtrend with a red bearish candle, a gap lower into another down candle and then a bullish candle that closes within the gap.
Characteristics of Downside Tasuki Gap Pattern
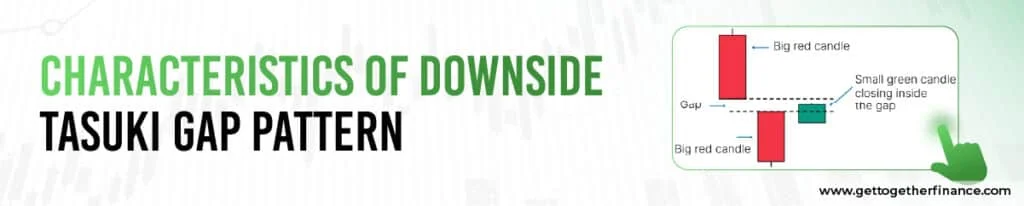
The Downside Tasuki Gap candlestick pattern spots better trading opportunities in technical analysis. To identify the pattern traders look for three candle formations which are as follows:
First Candle: A large Bearish Red Candle.
Second Red Candle: Gap Down Opening.
Third Candle: A green candle with an opening within the second candle’s body and the closing within the gap between the first two candles.
How to read Downside Tasuki Gap Pattern?

The psychology behind the Downside Tasuki Gap Candlestick suggests the dominance of sellers in the market as they are pushing the prices lower.
To read the pattern, you can analyze that the prices remain in a short-term downtrend when the pattern appears.
Following the first candle, the price must gap down and form another large red or bearish candle.
The opening of the second candle gives an indication towards even higher selling pressure which has resulted in a gap down.
Further, a green candle penetrates into the gap but is unable to close above the gap after which the price moves lower.
You can observe a continued bearish movement but the time period of this movement is uncertain as the prices can reverse shortly after.
How to Trade in the Downside Tasuki Gap Pattern?
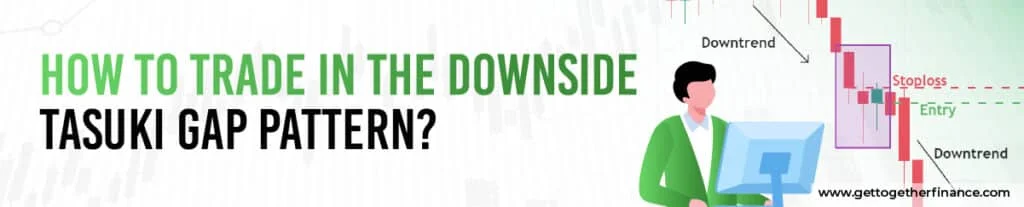
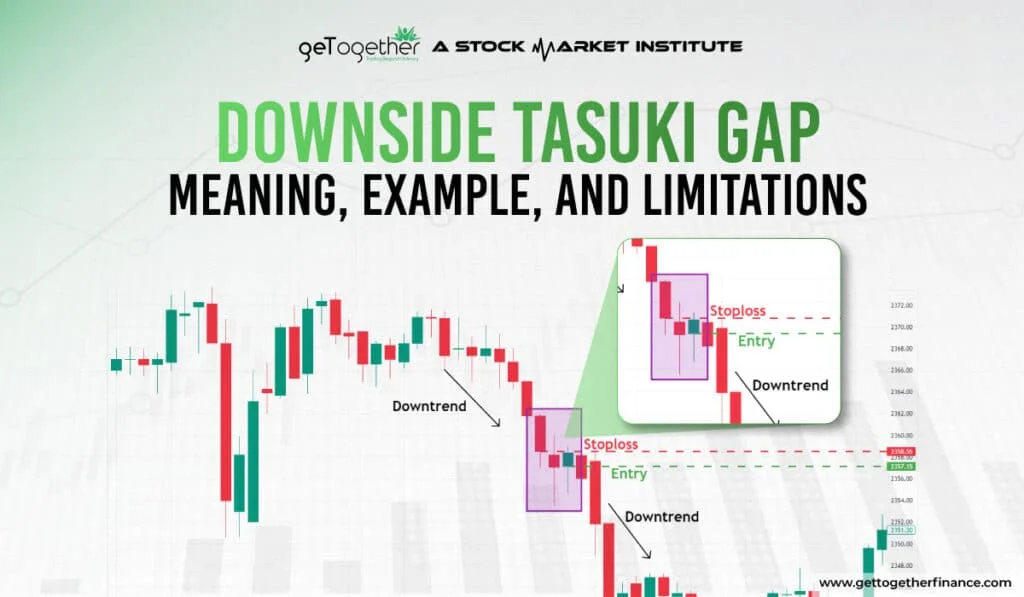
The formation of the downside tasuki gap candlestick pattern in a strong prevailing down trend signifies the continuation of bearish trend in the security.
Entry: Traders enter into short positions in the security below the third green candle of the pattern as the third candle with a bullish nature indicates the inability of buying pressure to push the prices upwards and results in the gap acting as a resistance zone.
Stop Loss: The stop loss is placed near the close price of the first red candle among the three candles of the patterns.
Things to Consider in Downside Tasuki Gap Pattern

In the realm of financial markets, traders must avoid common pitfalls to identify the best opportunities. Here are the common mistakes that you must avoid when following a disciplined approach.
Over-reliance on Downside Tasuki Gap Pattern
Relying completely on a single pattern for signals often leads to skewed analyses. Therefore, you must not completely depend on the pattern.
Technical Indicators
To follow a holistic approach, you need to pay more attention to other pertinent market indicators.
Lack of proper Risk Assessment
Risk assessment is the most important aspect of the stock market. To safeguard the investments, placing stop loss orders is a necessity to maintain a proper position.
FAQs
What is the Downside Tasuki Gap Pattern?
The downside of the Tasuki Gap Pattern indicates the continuation of a bearish trend in security because the sellers dominate the market by maintaining their position.
What does the Downside Tasuki Gap pattern signify?
The formation of the Downside Tasuki Pattern signifies that the sellers are gaining control over the security.
How can traders use the Downside Tasuki Gap?
Traders often use this pattern to confirm the strength of a downtrend before entering a short position.
Where does the Downside Tasuki Gap appear?
It typically forms during a well-established downtrend and confirms the continuation of the bearish trend.


