
Fractal Indicator: Definition, What It Signals, and How to Trade
- Updated on : August 21, 2026
- 2235 Views
- by Manaswi Agarwal

 Instagram
 Linkedin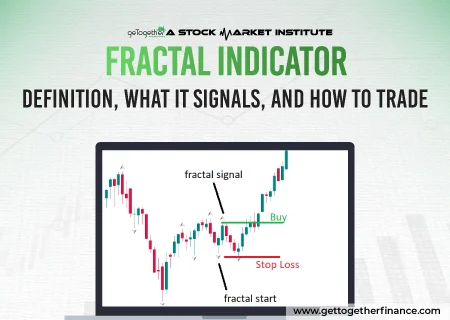
Traders can identify potential trend reversals in the securities market through a fractal indicator, which is a strong mathematical concept. The fractal indicator was introduced by Bill Williams to analyze and predict trend reversals or turning points in price movements. So, exactly how does the fractal indicator work, and how do traders spot these patterns on a chart?
In this blog, we’ll break down what a fractal indicator is, how it’s calculated, and how to read bullish and bearish fractal patterns. We’ll also cover its pros and cons, ideal timeframes, how to avoid false signals, and how to use the fractal indicator in your trading analysis.
What are Fractal Indicators?
Fractal indicators are trading tools that make it easier to identify key turning points in a security. It is a simple, recurring geometric price pattern that appears in charts across different time frames. The two types of fractals include bearish and bullish fractals. The patterns are also known as “up fractals” and “down fractals”. The middle bar in a fractal creates the highest high or the lowest low as compared to the 4 surrounding bars.
Five Candlesticks: The five candlesticks altogether create a fractal pattern in the shape of a “U” or “V” to represent the bullish fractal reversal, while in the case of a bearish fractal, the shape would be a reversed “U” or “V”.
Middle Bar: When the middle bar forms the lowest low, it represents a potential bullish reversal in the security. To the opposite of this, when the highest high is formed, it indicates a bearish reversal in the prices of the assets.
Who Developed the Fractal Indicator?

Bill Williams developed the fractal indicator. He was a prominent American trader, author, and technical analyst. He introduced the Fractal Indicator as part of a larger trading system detailed in his books, most notably Trading Chaos: Applying Chaos Theory to Unique Market Profit. His philosophy centers on using market chaos theory to identify predictable, repeating geometric patterns, the fractals.
According to Williams, markets might seem random at first glance, but repeating price patterns can help traders read market behavior. The Fractal Indicator was built to identify such patterns and highlight where the price could potentially reverse. Traders use fractals to study market structure and identify areas where the price could reverse.
Fractal Indicator Formula and How It’s Calculated

The Fractal Indicator is unique because it doesn’t rely on mathematical smoothing, averages, or oscillators. Instead, it is built purely on price action geometry, identifying a specific five-candle reversal pattern introduced by Bill Williams.
A fractal forms when the market creates a clear swing high or swing low structure based on a five-candlestick pattern. To calculate a fractal, traders compare the high or low of the middle candlestick with the two candlesticks on either side of it. If the middle candle has the highest high compared with the other four candles, it forms a bearish fractal. If it has the lowest low compared with the other four candles, it forms a bullish fractal.
Bearish Fractal (Up Arrow / Peak)
A bearish fractal appears when the middle candlestick ($N$) of a five-bar sequence creates the highest high, forming a potential swing top. For this pattern to be valid, the following conditions must be true:
- High(N) > High(N – 2)
- High(N) > High(N – 1)
- High(N) > High(N + 1)
- High(N) > High(N + 2)
This means that both candlesticks immediately before and the two candlesticks immediately after the central candlestick must have lower highs, thereby confirming a localised price peak.
Bullish Fractal (Down Arrow / Valley)
A bullish fractal forms when the middle candlestick ($N$) creates the lowest low among the five candlesticks, marking a potential swing bottom. It is identified when:
- Low(N) < Low(N – 2)
- Low(N) < Low(N – 1)
- Low(N) < Low(N + 1)
- Low(N) < Low(N + 2)
Here, the two candlesticks before and the two candlesticks after must all show higher lows, which confirms the valley structure of a potential reversal point.
Confirmation Rule
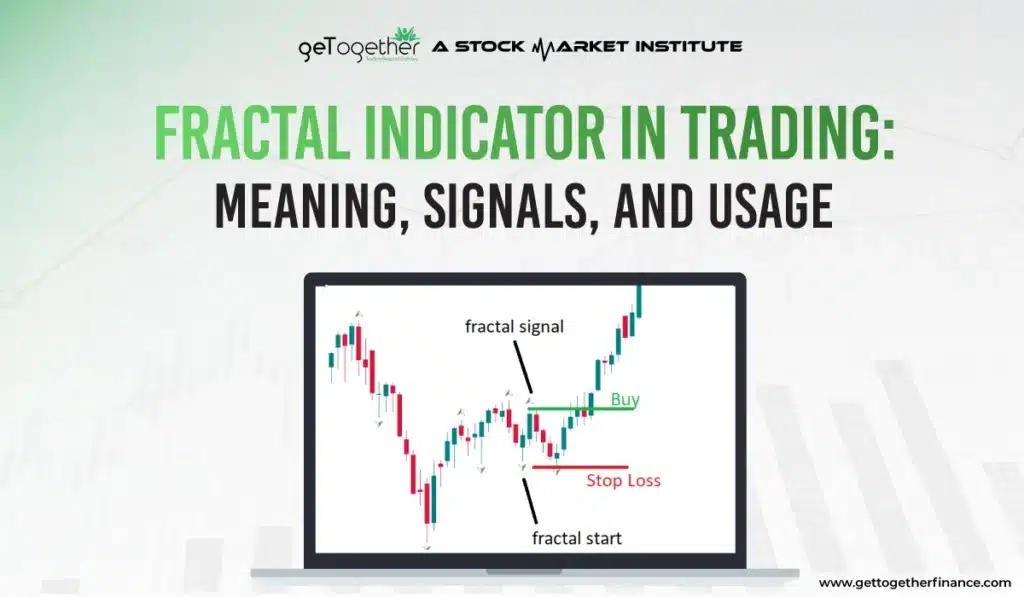
It is critical to remember the confirmation rule: A fractal signal is only confirmed after the fifth candlestick closes.
In other words, the indicator waits until the candlestick at position N+2 is finished before plotting the fractal (the up or down arrow) on the chart. This process ensures the pattern is stable and prevents the common issue of repainting (where a signal disappears after the bar closes).
How to interpret the Fractal Pattern?

The pattern is clearly seen as it forms a symmetrical shape, revealing a “U” shape or “V” shaped pattern. When such a pattern is formed, it indicates a market reversal, as it turns the market in a different direction. The formation of fractal patterns is viewed with technical support and resistance indicators.
To interpret the fractal pattern correctly, you must consider the daily pivot points, as well as evaluate the probability of potential signals of a trend reversal with the formation of a fractal indicator.
The formation of a fractal pattern must be confirmed with the closing of the fifth candlestick in the pattern. Traders can only analyze future price movements after the completion of the fifth candle that justifies the pattern formation. Taking actions before that might get unfavorable results, and hence traders may end up making losses.
The premise of fractal patterns in the financial market is that the charts repeat their formation at each time frame.
Also Read: Types of stock market indicators
Fractal Indicator vs Other Reversal Indicators
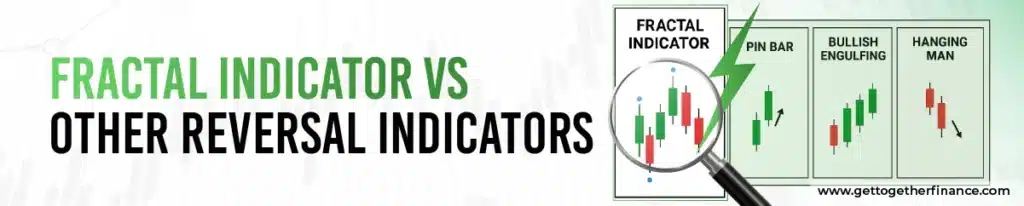
The Fractal Indicator stands out from most reversal indicators because it is built on pure price structure, not formulas, smoothing, or lagging mathematical calculations. While many tools attempt to predict reversals using averages or momentum shifts, fractals focus solely on market geometry, making them among the most straightforward yet powerful reversal-detection methods.
Moreover, the Fractal Indicator is not a standalone trading system, but it is one of the most reliable tools for identifying true structural turning points. When combined with trend-following indicators (like moving averages) or momentum tools (like RSI or MACD), fractals provide a strong confluence for high-probability reversal setups.
Bearish Fractal Pattern

As the name suggests, a bearish fractal represents movement in the security downwards. The preceding candles form higher highs, which are then followed by two lower highs than the highs of the previous candles, which marks the occurrence of bearish fractal formation.
A bearish fractal is formed when the middle candle shows the highest high compared to the other four. The pattern shows lower highs on both sides of the middle candle, which can signal a peak on the price chart. This pattern signals that the uptrend may be weakening and could be about to reverse. However, a bearish fractal alone doesn’t guarantee a decline. Traders should look for confirmation and combine it with other tools before deciding to trade.
Bullish Fractal Pattern

During the formation of a bullish fractal pattern, the candlesticks preceding the lowest low point show price moving to a lower low, which is followed by the two candles forming higher lows than the lows of preceding candlesticks. A bullish fractal appears when the middle candle shows the lowest low compared to the other four, pointing to a potential bottom on the price chart. This pattern may signal that the downtrend is weakening and the price is potentially turning upward.
However, a bullish fractal alone doesn’t confirm a reversal. Traders should wait until the fifth candle closes for confirmation and use additional technical tools to support their decisions.
Combining Fractals with Moving Averages
Combining the Fractal Indicator with Moving Averages is one of the simplest and most effective ways to filter noise and strengthen reversal signals. While fractals mark precise swing highs and lows, moving averages help identify the broader trend, allowing you to focus only on signals that align with the market’s dominant direction.
In an uptrend, bullish fractals forming above the moving average highlight potential continuation points, whereas in a downtrend, bearish fractals forming below the moving average confirm trend strength. This combination reduces false signals, improves clarity during volatile phases, and gives traders a structured approach to entering trades only when price action and trend momentum support each other.
Advantages of Fractal Indicators

Now here is a question: why should a trader use a fractal indicator? How can fractal indicators be helpful? Let us know about the various advantages offered by using fractal indicators:
Easy Identification
The fractal indicator pattern can be easily identified by traders who are regularly involved in the stock market. Traders can easily recognize the entry points and the stop-loss orders to perfectly place their trade.
Multiple Timeframes
Traders can make use of fractal indicators on various time frames to predict the future price movements in the security. The indicators can be effectively used on daily, weekly, monthly, and even on smaller time frames.
Limitations of Fractal Indicator

Trading with fractal indicators can be risky, and traders must be well aware of the false signals that they can provide. Fractal indicators must be used cautiously to gain maximum benefits. Let us understand the limitations of using fractal indicators in a trade.
Frequent Formation
The fractal indicator pattern can occur quite frequently, especially in sideways or choppy markets, and is prone to giving false signals to traders. They cannot completely rely on this pattern because frequent formations may create noise and provide limited meaningful trading opportunities.
High Buying
Trading fractal patterns has a disadvantage as traders may get an entry above the ideal market entry point. Since a fractal is confirmed only after the fifth candlestick closes, the price may have already moved by the time the signal is confirmed. Furthermore, the distance between the stop-loss and entry point may become large, which can increase the potential loss if the trade moves in the opposite direction.
Lack Reliability
Trading on fractal indicators is not completely reliable, as traders do not have appropriate guidance about where to enter and exit the trade. A fractal only suggests a possible turning point rather than guaranteeing a reversal. Traders should combine it with other tools, like demand and supply, to trade more confidently.
How to Avoid False Signals from Fractals?
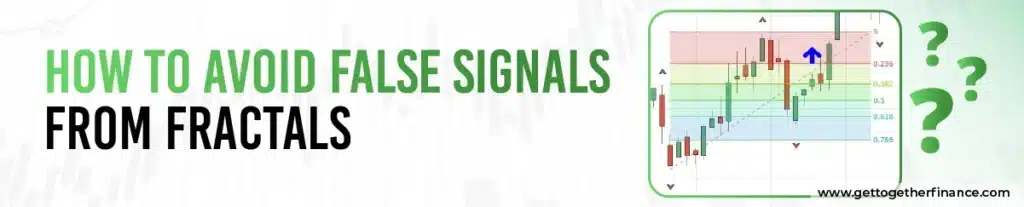
Fractals can generate misleading signals, especially during choppy or sideways markets, so using them with proper filters is essential. One of the best ways to avoid false signals is to trade fractals only in the direction of the main trend—for example, take bullish fractals in an uptrend and bearish fractals in a downtrend.
Adding a moving average, such as a 20- or 50-period MA, can help confirm whether the fractal aligns with the broader market trend. Traders should also wait for the fractal to fully confirm (after the fifth candle closes) instead of anticipating the pattern. Combining fractals with other tools like support and resistance levels or volume can provide additional confirmation and help reduce false signals.
Timeframes Best Suited for Fractals

Fractals work across all timeframes, but they are most reliable on higher timeframes, where market noise is naturally lower. Charts like the 1-hour, 4-hour, daily, and weekly provide cleaner swing points and fewer false patterns compared to fast, volatile timeframes like 1-minute or 5-minute charts. Intraday traders can still use fractals effectively on 15-minute or 30-minute charts, but should combine them with trend filters for better accuracy.
Fractal patterns are usually easier to spot on higher timeframes, whereas lower timeframes generate more signals along with more noise. That’s why traders should choose a timeframe suited to their style and combine fractals with other technical tools.
How to Trade Using the Fractal Indicator

Traders can use fractals to catch breakouts, identifying moments when price crosses beyond a previous fractal high or low. It’s important to combine this with the broader trend and confirmation signals before taking a trade. This way, you can filter out weak breakout signals and make smarter trading decisions.
Here’s how traders can use bullish and bearish fractals to identify breakout opportunities:
- Trading Bullish Fractal: Enter a long position when the price breaks above the most recent bullish fractal. Place a stop-loss slightly below the last bullish fractal. Book the profits at the next resistance level or using a risk-reward ratio.
- Trading Bearish Fractal: Enter a short position when the price breaks below the most recent bearish fractal. Place a stop-loss slightly above the last bearish fractal. Take profit at the next support level.
Common Misconceptions About Fractals
Fractals are simple to understand, but they are often misunderstood by beginners. These misconceptions can lead to incorrect interpretations and poor trading decisions. Let’s look at some common misconceptions about the fractal indicator:
- Many traders believe fractals predict tops and bottoms, but they actually confirm them after the pattern completes.
- Some think every fractal marks a big reversal, while in reality many fractals—especially in sideways markets—show only small, temporary swings.
- There’s a misconception that fractals are equally effective on all timeframes, but lower timeframes produce more noise and false signals.
- Some beginners assume fractals should be used as a standalone strategy, whereas they work best when combined with trend indicators or support/resistance levels.
- Many traders expect fractals to signal the market direction on their own, but fractals only show structural turning points, not the strength or continuation of a trend.
The End Line
As we have understood how the fractal indicator works and how it can help identify potential turning points across multiple timeframes, traders can use it as part of their technical analysis. However, fractals should not be used in isolation. Combining them with demand and supply analysis can help traders better understand market structure and make more informed trading decisions. GTF’s Trading in the Zone course is an advanced technical analysis course designed to help individuals build a stronger understanding of the stock market and technical analysis.
FAQs
What is a Fractal Indicator?
A fractal indicator is a mathematical tool that is often used by traders to identify the potential turning points or trend reversals in the prices of securities.
What is a bearish fractal?
The formation of a bearish fractal signals to traders a downward movement in the security, as the middle candlestick bar forms the highest high.
What is a Bullish Fractal?
Bullish fractal formation is represented by the middle candle among the five candlesticks; the middle candle forms the lowest low, representing an upward move in the security, which signifies the bullish fractal.
What Do Bullish and Bearish Fractals Indicate?
A bullish fractal suggests a potential reversal to the upside, while a bearish fractal suggests a reversal to the downside.
Are Fractals Reliable in All Markets?
Fractals can generate false signals in choppy markets. They are more reliable in trending markets when combined with other indicators for confirmation.
Can I Use Fractals for Day Trading?
Yes, fractals can be used for day trading on lower time frames, but it’s essential to confirm signals with other technical tools.



