
How to Identify Stock Market Trends: Beginner Guide
- Updated on : August 14, 2026
- 11 Views
- by Suhani

 Instagram

When the stock market moves in different directions, it is known as a stock market trend. By understanding these trends, traders can make better decisions and avoid emotional trading. Without proper analysis, several traders enter trades that lead to losses. That’s why learning how to identify stock market trends is a crucial skill for every trader.
By finding out how to identify trading trends, everything becomes easier for them. They can understand market moves, protect their capital, and make smarter decisions.
In this blog, you’ll get to know how trend analysis works in the stock market, different types of trends, and ways to confirm signals.
Types of Stock Market Trends

To understand how to identify stock market trends, first, you should know about the various types of trends that exist in the market. Generally, it is of three types: uptrend, downtrend, and sideways trend. Every trend tells you about what buyers and sellers are actually doing in the market.
- Uptrend
When stock prices consistently move higher and the market forms higher highs and higher lows, then it is called an uptrend. This pattern shows how strongly buyers demand in the market.
For example: If a stock goes upward from ₹100 to ₹120, falls slightly to ₹115, and then rises again to ₹130, it signals an uptrend. This is the phase where traders focus on buying, because the overall market is moving higher.
- Downtrend
A downtrend is just the opposite of an uptrend. Within this, stock prices continuously fall and form lower highs and lower lows. This gives a clear signal that sellers are in control.
For example: If a stock declines from ₹500 to ₹450, rises slightly to ₹470, and then drops again to ₹420, it represents a downtrend.
- Sideways Trend
A sideways trend is also known as a range-bound market. In this, the price fluctuates within a set range without clearly moving in an upward or downward direction.
For example: If a stock spends weeks going up and down between the same two levels and can’t break either one. This indicates that the market has no clear direction and is stuck in the same range.
Why Identifying Market Trends Is Important

By properly understanding how the market moves, traders don’t depend on emotions. Also, you can plan your risk management, entries, and exits more effectively.
By identifying market trends, you trade at the right time. When traders trade in the market direction, they gain more confidence than when going against it. Additionally, strong trends give you more reliable setups, so that you can manage your risk effectively.
Moreover, market trends also play an essential role in enhancing decision-making. If you stop trading based on emotions and tips, you start seeing the market more clearly.
How Traders Identify Stock Market Trends?
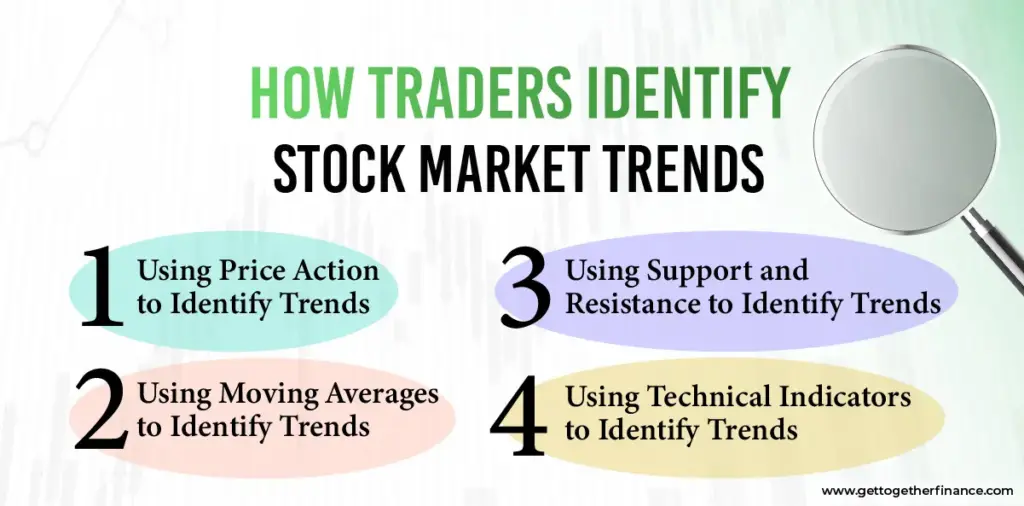
To analyse the market, a professional trader never relies on a single chart pattern. Rather, before placing an order, they assess it from a different perspective. This approach helps traders get confirmation about the trend direction and avoid false signals.
There are several key factors traders need to consider. These include moving averages, price movement, support and resistance levels, technical indicators, and trading volume
Each method offers a distinct view of how the market is behaving and in which direction the market’s momentum is moving.
Using Price Action to Identify Trends
Price action is the most effective way to spot trends. Traders closely analyze price movement on the chart, which allows them to see whether buyers and sellers are active in the market.
A rising market continuously pushes prices to new highs while keeping lows higher, which shows strong buying activity. In contrast, when the market is falling, prices tend to form lower highs and lower lows. This suggests that the market is now under the sellers’ control.
For example: Every time a stock drops a little and then pushes to a new high, it shows that the uptrend is still going strong.
A lot of people rely on price action because it represents whether a trend is strong or weak and how buyers and sellers are feeling in the market. It is easy to understand, works in every condition, and also assists traders in improving their chart reading skills.
Using Moving Averages to Identify Trends
Moving averages are another best tool to identify stock market trends. They help traders remove the confusion and understand the direction of the market.
Some of the most effective tools for tracking trends include 50-day and 200-day moving averages. These give traders a clear idea of which direction the market is moving.
If the price remains above the moving average while the line keeps increasing, it indicates that buyers are dominating and that a strong uptrend. Meanwhile, when the price drops below the moving average and the line starts falling, it suggests that sellers have taken control.
Using Support and Resistance to Identify Trends
Support and resistance levels are the key tools that traders use in technical analysis. This gives traders a solid base to understand market direction and get an idea of where prices might move.
A support level is generally a price zone where buyers come in and prevent the market from falling further. On the other hand, the resistance level is an area where sellers get more active and make it difficult for prices to move higher.
In a rising market, support levels continuously move higher because buyers keep pushing prices upward. If the price breaks above resistance levels, it shows the trend is getting stronger. In a downturn, the reverse occurs. As sellers take control of the market, resistance levels slowly shift downward while support levels keep declining.
Using Technical Indicators to Identify Trends
Through technical indicators, traders can understand trend strength, market momentum, and overall market conditions. These indicators work best when they don’t depend only upon them. Also, it gives valuable confirmation when used with chart analysis and price action.
RSI is one of the most popular indicators that measures momentum and helps traders determine whether a stock has gone too high or too low. Usually, if the RSI goes above 70, it indicates strong buying activity and a chance that the stock has been excessively bought. If the RSI drops under 30, it signals that sellers have pushed the stock down too much.
Moving Average Convergence Divergence (MACD) is another popular indicator that traders use to spot trend direction. A bullish crossover indicates rising momentum, whereas a bearish crossover signals downward momentum in the market.
In addition, traders use the Average Directional Index (ADX) to find out the strength of a trend. When the ADX value is high, the trend is strong, whereas a lower ADX value signals a weak trend.
By putting all these methods together, a trader can read market trends with higher accuracy and trade with real confidence.
How to Confirm a Stock Market Trend

Many new traders assume that small price movements are long-lasting trends, but in reality is just temporary price changes. As a result, they end up making wrong trading decisions and facing losses. That’s why confirming a trend before taking a trade is crucial. One of the best methods that traders use to verify a trend is by examining the market across multiple time frames.
For example: Even if a small time frame looks bullish, traders need to confirm it on a bigger time frame to check if it’s really a bullish move.
Another crucial factor is volume. High volume means that buyers and sellers are active in the market, which makes the trend stronger. However, if prices are going upward and downward sharply, it indicates that the trend is not trustworthy and could reverse. Additionally, there are many indicators, such as MACD, moving averages, or RSI, with price action, used by traders to remove confusion and increase reliability.
How to Identify Trend Reversals

A trend reversal occurs when the market changes its overall direction. In simple words, a trend can reverse, which means an uptrend turns into a downtrend and a downtrend turns into an uptrend. By spotting these reversals early, traders can protect their earnings and avoid getting into trades at the wrong time.
Before a trend reverses, the market structure gives a signal. For example, during an uptrend, prices continuously increase with higher highs and higher lows. But when they stop making new higher lows, it indicates the uptrend is struggling.
Also, traders use some indicators like RSI and MACD to identify possible reversals. If the price keeps moving in one direction, but the momentum is weak, it signals that the trend is losing its strength.
Another vital factor is volume. If volume suddenly increases around key support or resistance zones, it signals that both buyers and sellers are stepping in, and the trend may reverse. On top of that, traders watch candlestick patterns such as Doji, Hammer, and Engulfing candles to spot where the market is moving.
Common Mistakes Traders Make When Identifying Trends

In general, trend analysis is not difficult; it’s the trader’s mistakes that make it complicated for them. By avoiding these, they stay on track and make better decisions.
Here are some common mistakes that traders make while identifying a trend:
Ignoring Higher Time Frames: Most people only prefer smaller time frames like 5-minute or 15-minute charts, which is their biggest mistake. A stock might appear to be moving upward on a smaller chart, while it looks bearish on the daily chart. That’s why experienced traders always check higher time frames before taking trades.
Overusing Indicators: Many traders use multiple indicators in one chart, which creates confusion because every indicator gives different signals at the same time. That’s why it is important to always keep the chart simple.
Emotional Trading: Emotions such as fear and greed are the main reasons why traders overlook the direction in which the market is moving. Rather than doing solid analysis, several traders jump into positions driven by panic, excitement, or social media tips, which lead to losses.
Tips for Beginners to Identify Market Trends

It is always advisable for beginners to keep their charts simple and understand price movements without using multiple indicators. They should use higher time frames, like daily or weekly charts, to see the overall market direction. Also, by doing regular practice and chart analysis, traders can improve their ability to identify trends. As you know, the market is evolving, so keep on learning for your own betterment. On top of this, always place a stop loss and manage risk properly to protect your capital.
Conclusion
Learning how to identify stock market trends is an essential skill. It helps you trade with more clarity, stop trading on feelings, and understand how the market moves. There are many tools, like moving averages, price action, support and resistance levels, and technical indicators, through which traders can properly read market trends. Trend analysis is a skill that requires time, practice, and patience to develop so that you can become better at identifying market trends.

What are stock market trends?
A stock market trend is the direction in which prices are moving over a period of time. This movement can go up, down, or stay flat.
How do beginners identify stock market trends?
Beginners can identify stock market trends by examining technical indicators, price action, moving averages, support, and resistance levels.
Why is trend analysis important in the stock market?
Trend analysis is important for traders because it helps them manage risk effectively, understand market direction, and identify trading opportunities.
Which indicator is best for identifying trends?
There is no single best indicator for trend analysis. Several traders combine tools such as ADX, moving averages, RSI, and MACD for better accuracy.
Can stock market trends change suddenly?
Yes, stock market trends change suddenly due to market sentiment, economic news, or strong buying and selling activity.
What is the easiest way to identify an uptrend?
When a stock forms higher highs and higher lows on the chart, it is considered an uptrend.



