How to Use the P/E Ratio and PEG Ratio to Evaluate Stocks Like a Pro?
- Updated on : December 18, 2025
- 1277 Views
- by Suhani

 Instagram
Introduction
Are you also one of the stock market enthusiasts who invest their money based on hearsay or so-called expert opinions? Well, the best idea to become a successful stock market trader or investor is to evaluate the stock yourself before jumping into your trades. Using both technical and fundamental analysis tools is the best way to conduct stock valuation and enter trades at favorable prices.
One of the most important and widely used fundamental analysis tools is the price to earnings ratio (P/E Ratio). If you are a stock market enthusiast, you must have heard about it.
However, the P/E ratio only uses the current market price and EPS of a stock and leaves out the future growth prospects. Here comes the need for an advanced PEG Ratio. In this blog, we explore the calculation and interpretation of the price to earnings ratio. We also discuss the use of the PEG Ratio and how it overcomes the problems of the P/E Ratio.
What is the P/E Ratio?

Definition & Formula
To put it simply, the price to earnings ratio shows the price buyers are ready to pay for every rupee earned by a company. The P/E ratio shows the market value of a stock in relation to its earnings. By understanding how the P/E ratio affects stock valuation, you can determine whether it is worthwhile to invest in a stock.
| Here’s the Price to Earnings Ratio Formula:P/E Ratio=Current Share PriceEarnings Per Share |
Interpretation:
Before learning about the interpretation of the price to earnings ratio, you should remember that comparing it with industry peers and average P/E gives a better picture than looking at a company’s P/E ratio alone.
- High P/E: When the price to earnings ratio is high, it can mean 2 things:
- Either the market expects the company to have high future growth, leading to increased income, or
- The share is falsely overpriced due to increased speculation. (Opportunity to short-sell or book profits)
- Low P/E: On the other hand, when the price to earnings ratio is low, there can again be two interpretations:
- It can show that the company might face sluggish growth, economic slowdown, or other troubles in the future, or
- The company is underpriced due to increased speculation. (Opportunity to invest in a gem which can multiply your portfolio)
Types:
There are two types of price to earnings ratio, namely trailing P/E and forward P/E. Let’s understand their uses and points of difference in this section.
| Type of P/E | Trailing P/E | Forward P/E |
| Calculation | Trailing P/E uses the actual EPS during the past 12 months to calculate the price to earnings ratio. | To calculate the forward P/E, you have to forecast the EPS for the next 12 months and use it. |
| Uses | You can use the trailing P/E for the following purposes:Provides a historical snapshot.You can use it to compare various businesses and their performance. | You can use the forward P/E to:To get a feel for the future growth of a business.It is better to use the forward P/E for fast-growing businesses. |
| Examples | Suppose the current market price of Company A is Rs. 1,000 per share and the current EPS is Rs. 20. Let’s calculate the trailing P/E:Current Market PriceCurrent EPS=1,00020So, the trailing P/E of Company A is 50. | Suppose the forecast EPS for Company A is Rs. 25. Let’s calculate the forward P/E now:Current Market PriceForecast EPS=1,00025The forward P/E of Company A is only 40. |
Now, comparing the trailing and forward P/E gives some in-depth insights into the price to earnings ratio:
- The forward P/E will always be less than the trailing P/E for a growth-oriented company.
- The current market price has already discounted the future growth. Hence, the forward P/E gives a more accurate reading for the stock valuation.
Read More – Understanding CAPE Ratio: Indian Stock Market
Limitations of the P/E Ratio

Is the P/E ratio a perfect metric, or are there some limitations to its uses? Let’s find out:
- No indication of Growth: A company can have a low P/E in a stagnating industry. If you get trapped in such a stock, thinking that the price will rise, it will most probably backfire.
- Business Cycles: The peaks and troughs of a company’s earnings may or may not coincide with the market price. Due to such cyclical price movements, you can find a cheap price at peak earnings and vice versa.
- Sector Quirks: Companies from different sectors experience different levels of investor preference. For example, the IT sector has high P/Es compared to utilities.
- Distorted Earnings: EPS can be easily rigged with simple accounting choices like write-offs or asset sales. It can distort the price to earnings ratio, leading to losses.
What is the PEG Ratio?
Definition & Formula
As we already discussed, the price to earnings ratio has one shortcoming, i.e., it doesn’t account for the future growth. To overcome this limitation, we use the PEG ratio. By accounting for future growth, it gives a more comprehensive picture of the stock valuation.
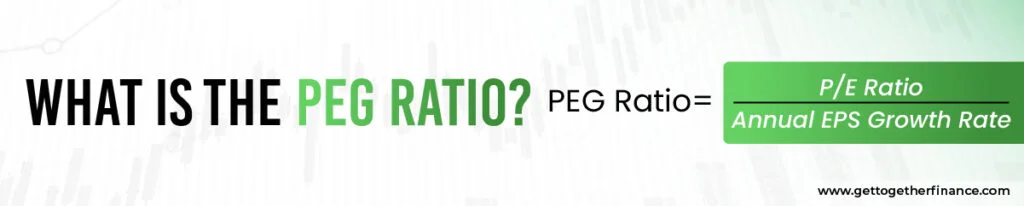
Here’s the formula for the PEG ratio:
PEG Ratio=P/E RatioAnnual EPS Growth Rate
Purpose: Adjusts P/E for a company’s growth rate
At this point, you may be wondering, why go through the pain of adjusting the P/E ratio for EPS growth? Does it serve some purpose? Well, yes! The PEG ratio answers the key question, “Are you overpaying for the company’s current growth?” You can arrive at a more realistic understanding of the stock valuation using this ratio instead.
Interpretation:
There can be three scenarios when interpreting the PEG ratio:
- PEG < 1: When the PEG ratio is less than 1, it can mean that the stock price doesn’t reflect the future growth of the company properly. It is an opportunity to buy the undervalued stock.
- PEG ≈ 1: When the PEG ratio is close to 1, it means the price is ideally valued for the future growth of the company.
- PEG > 1: A high PEG Ratio indicates overpriced stocks. However, there can be an exception if there are high-value intangibles or IPRs in the hands of the company.
From our earlier example, the trailing P/E ratio of Company A was 50. Suppose the annual growth rate of the company is 30%. So, the PEG Ratio will be:
PEG Ratio=P/E RatioAnnual Growth Rate=5030=1.67
So, the PEG Ratio shows that the stock price is highly overvalued, and the best course of action is to book profits.
P/E vs PEG: Which is Better?

| P/E Ratio | PEG Ratio |
| The P/E ratio is best used for mature companies. This means, where the growth is predictable and stable, a simpler metric like the P/E ratio can suffice the purpose. | Up-and-coming companies that show explosive growth are more likely to have an exceptionally high P/E ratio. So, using the PEG ratio can bring back sanity to your decision-making. |
The stock prices depend on various factors like sector norms, economic cycles, company history, etc. So, instead of identifying growth vs value stocks on a case-by-case basis, it is better to use both the metrics side-by-side during fundamental analysis.
How to Use P/E and PEG in Real-World Investing

Step-by-step guide:
- Get the Numbers: You can use popular websites like Moneycontrol, Bloomberg, etc, to get the latest metrics, including the trailing and forward P/E.
- Sector Benchmark: Compare the price to earnings ratio with industry peers. We can conclude that the P/E is high or low only by comparing it with the industry average.
- Growth: For calculating the PEG ratio, you need to identify the future growth. For this, you can either use data from reliable analysts or use the 5-year EPS CAGR.
- Compute and Interpret PEG: You can now calculate the PEG ratio by dividing the P/E ratio by growth. Compare the PEG ratio value to 1 and see whether the stock is overpriced or underpriced.
- Qualitative Factors: While numbers are important, a company’s growth also depends on qualitative factors like debt levels, management experience, competitive advantage, etc.
When P/E and PEG May Not Work Well

Here are some scenarios where the P/E ratio and the PEG ratio do not work:
- Zero-Earnings Startups: In the beginning, the startups do not have an EPS. So, we cannot use P/E or the PEG ratio.
- Roller-Coaster Profits: Sectors like mining or aviation that face uneven profits due to multiple factors cannot be judged with P/E metrics. Using EV/EBITDA or DCF for stock valuation is a better option in such scenarios.
- Macroeconomic Factors: The business and economic lifecycles affect a company’s profits. A stress asset sale in a recession period can temporarily spike the EPS, but it is only a hoax.
Conclusion
While the price to earnings ratio shows how much an investor is ready to pay for every rupee earned by a business, it doesn’t account for the future growth. On the other hand, the PEG ratio gives a fuller picture by incorporating growth. However, it is advisable to use both these metrics together for fundamental analysis to cover all bases. Apart from this, you should also look at qualitative aspects like sector context, management quality, etc, to get a complete picture.


