Tri-Star Pattern: What It Is, How It Forms, and How to Trade It
- Updated on : May 23, 2026
- 668 Views
- by Manaswi Agarwal

 Instagram
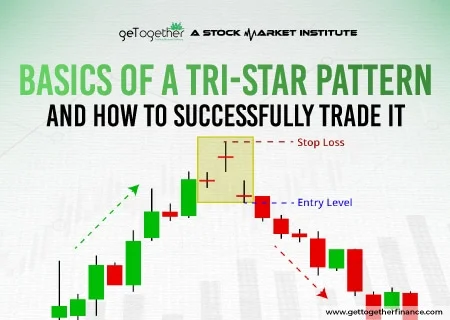
If you’ve spent enough time watching charts, you’ll notice something interesting—before every major move, the market often slows down first. Not because something dramatic happens, but because participants themselves are unsure. The Tri-Star Pattern is one of those rare moments where this uncertainty becomes clearly visible on the chart.
It doesn’t appear often. And honestly, most traders ignore it when it does. But if you’ve ever seen a strong trend suddenly lose its rhythm, hesitate, and then reverse, that’s exactly the kind of behaviour this pattern tries to capture. The Tri-Star Candlestick Pattern is not about predicting the market. It’s about recognising when the market itself is losing clarity.
What Is the Tri-Star Candlestick Pattern?

At a structural level, the Tri-Star Pattern is made up of three consecutive doji candles. But just calling it “three dojis” would be an oversimplification.
A doji, by itself, represents indecision. It tells you that during that time, buyers and sellers both tried to take control, but neither could dominate. Price moved, but eventually settled near its opening point.
Now, when this happens once, it’s just noise. When it happens twice, you start paying attention.
But when it happens three times in a row, especially after a strong trend, it starts telling a deeper story. It suggests that:
- The current trend is no longer being supported
- Momentum is fading gradually
- Participants are no longer confident in the direction
This is why the Tri-Star Pattern is often seen near turning points in the market. Not because it forces a reversal, but because it reflects a condition where a reversal becomes possible.
How Does the Tri-Star Pattern Form?
To really understand the Tri-Star Candlestick Pattern, you have to stop looking at candles as shapes and start seeing them as behaviour. Each of the three dojis represents a phase in the shift from confidence to hesitation and then uncertainty.
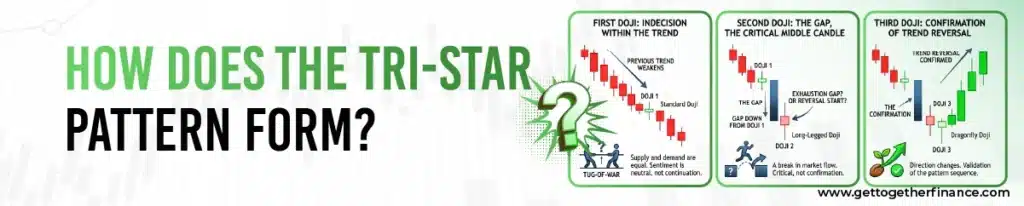
First Doji: Indecision Within the Trend
The first doji usually appears quietly. There’s no sudden shock. No strong rejection. Just a simple candle that looks different from the ones before it. If the market were in an uptrend, this doji would appear after a series of bullish candles. If it were in a downtrend, it would come after consistent selling.
What changes here is subtle:
The same participants who were aggressively pushing the price are now slowing down. It’s not a reversal signal. It’s more like the market taking a pause and asking, “Do we still want to continue in this direction?”
Second Doji: The Gap, The Critical Middle Candle
The second doji is where things begin to shift more visibly. This candle usually forms with a gap, and that gap matters more than the candle itself. In an uptrend, you might see a gap up. At first glance, it looks like a continuation. But instead of follow-through, the candle closes as a doji again. That’s where the confusion starts. The market tried to continue but couldn’t. This tells you that:
- Momentum is no longer reliable
- Breakouts are failing
- Traders entering late may be getting trapped
This middle candle is often where experienced traders become cautious. Not because the market has reversed, but because it has stopped behaving normally.
Third Doji: Confirmation of Trend Reversal
By the time the third doji forms, the situation becomes clearer, not in direction, but in condition. The market is no longer trending. It is simply stuck. Three attempts, three failures to move decisively. At this point, it’s not about whether buyers or sellers are stronger. It’s about the fact that neither side is in control anymore. And this is usually what comes just before a shift. The third doji doesn’t confirm the direction of the reversal. It confirms that the previous trend is no longer valid.
Bullish Tri-Star Pattern vs Bearish Tri-Star Pattern
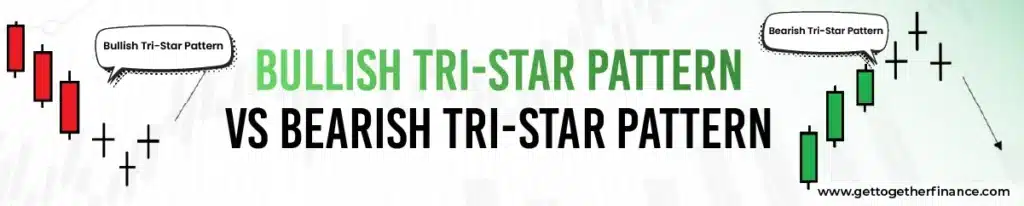
The Tri-Star Pattern itself doesn’t tell you whether to buy or sell. That depends entirely on where it appears.
Bullish Tri-Star: Formation and What It Signals
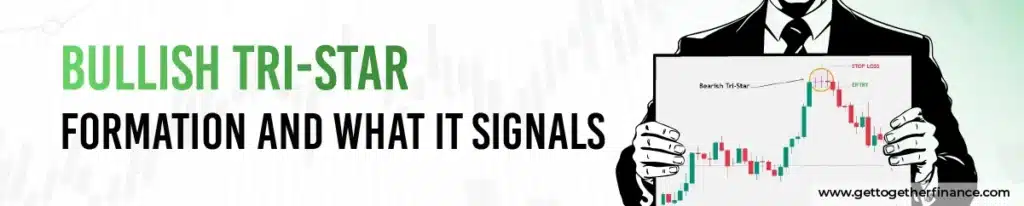
A bullish tri-star pattern forms after a downtrend. In this situation, the market has already been moving lower for some time. Sellers are in control, and price continues to fall, until it doesn’t.
The first doji shows that selling pressure is slowing.
The second doji, often with a gap down, reflects exhaustion or a final push.
The third doji shows that the market has stopped responding to selling altogether.
At this stage, sellers are no longer driving the market. And that’s often when buyers begin to step in quietly. The reversal doesn’t happen because buyers suddenly become strong. It happens because sellers have already become weak.
Bearish Tri-Star: Formation and What It Signals
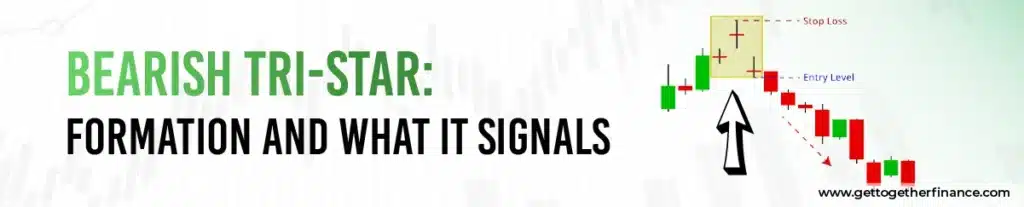
A bearish tri-star pattern forms after an uptrend.
Here, the situation is reversed. The market has been moving higher, often with confidence. Then comes the first doji, subtle hesitation. The second doji, with a gap up, suggests continuation but fails to deliver. The third doji shows that upward movement has stalled completely.
This is where buyers, especially late entrants, begin to feel uncertain. And once buying pressure fades, even slightly, the market doesn’t need much to move lower.
How to Identify the Tri-Star Pattern on a Chart?
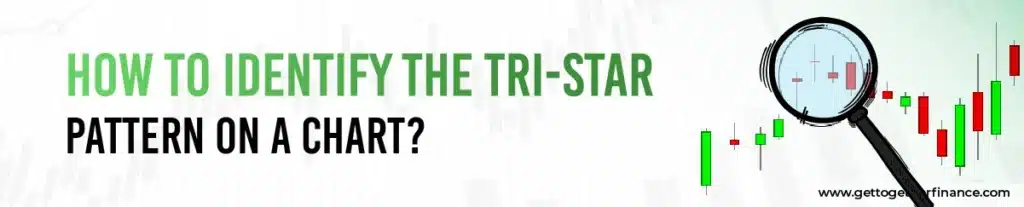
Identifying the Tri-Star pattern requires patience. It’s easy to spot three dojis. It’s much harder to recognize whether they actually mean something.
Key Rules for a Valid Tri-Star Formation
A valid Tri-Star Pattern should have the following:
- Three clear and visible doji candles
- A noticeable gap in the second candle
- Formation after a well-defined trend
- Preferably, alignment with key price zones
Without these elements, the pattern loses its context.
Common Look-Alike Patterns to Avoid Confusing It With
Many times, what looks like a Tri-Star is just:
- Sideways market movement
- Random indecision in low volume
- Consolidation before continuation
The difference lies in context and placement, not just structure.
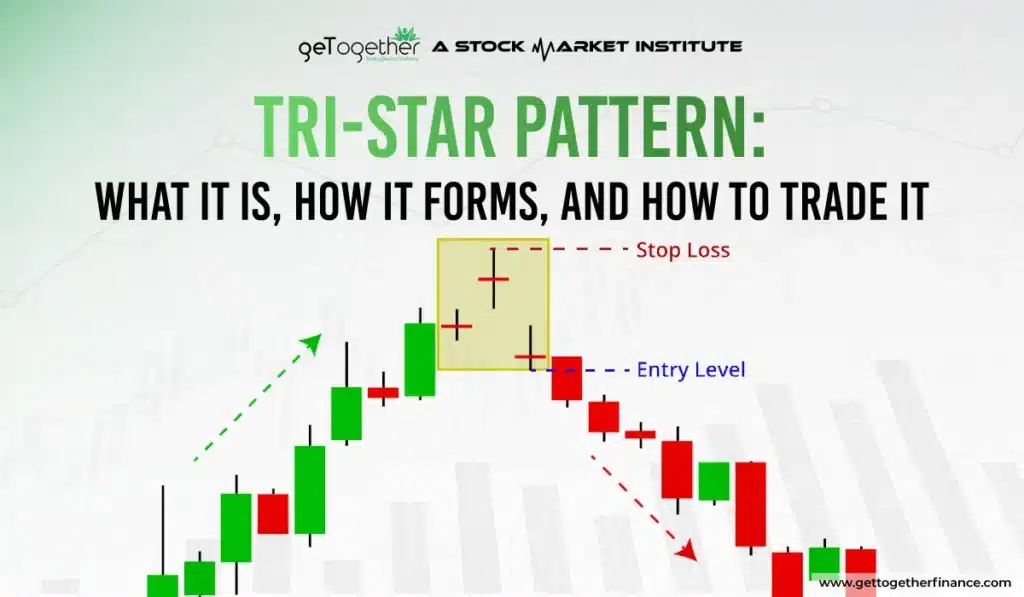
How to Trade Tri-Star Pattern?

Trading the Tri-Star Pattern is less about reacting to it and more about waiting around it.
Trading the Bullish Tri-Star at a Demand Zone
When the pattern forms near a demand zone, it carries more weight. Here, the price is already at a level where buyers have shown interest before. The pattern simply confirms that selling pressure has weakened. Instead of entering immediately, traders usually wait for a bullish confirmation candle.
Trading the Bearish Tri-Star at a Supply Zone
Similarly, at a supply zone, the pattern reflects failed buying attempts. Price tries to move higher but fails repeatedly. This is where sellers may start positioning themselves. Again, patience matters more than speed.
Entry, Stop-Loss, and Target Rules
There is no need to complicate execution.
- Entry comes after confirmation, not before
- Stop-loss is placed beyond the pattern
- Targets are based on nearby levels
The structure itself provides enough guidance.
Confirming the Tri-Star Pattern with Technical Indicators

The Tri-Star Pattern on its own only tells you that the market is confused. It shows that buyers and sellers are no longer in clear control, but that doesn’t automatically mean a trade should be taken. This is why confirmation becomes important. The pattern creates a possibility of reversal, but confirmation helps you understand whether that reversal is actually starting.
Support and Resistance Levels
The first thing to focus on is support and resistance levels. A tri-star pattern without a location doesn’t carry much value. But when it forms near a strong support or resistance zone, its meaning becomes clearer. For example, if the pattern appears near support and price is unable to move lower despite multiple attempts, it shows that selling pressure is getting absorbed. Similarly, at resistance, it reflects that buyers are failing to push the price higher. In simple terms, the pattern becomes more reliable when it forms at a place where the market has already reacted before.
Volume Confirmation
Next comes volume, which helps you understand whether there is real participation in the move. During the formation of the Tri-Star Pattern, volume is often low because the market is indecisive. But what really matters is what happens after the pattern completes. If the next candle shows a strong move with increasing volume, it indicates that one side—buyers or sellers—has stepped in with conviction. That’s where the actual confirmation begins. Without volume support, even a good-looking pattern can fail.
Trend Lines and RSI
You can also use tools like RSI (Relative Strength Index) and trendlines to support your analysis. RSI helps you understand whether the market is already stretched. For example, if a Bullish Tri-Star Pattern forms when RSI is in the oversold zone and then starts moving upward, it strengthens the chances of a reversal. Similarly, in a bearish setup, RSI moving down from overbought levels adds confidence. Trendlines, on the other hand, help you see structural changes. If the price was following a trendline and breaks it after the pattern forms, it’s a sign that the previous trend is no longer intact.
Tri-Star Pattern vs Evening Star and Morning Star
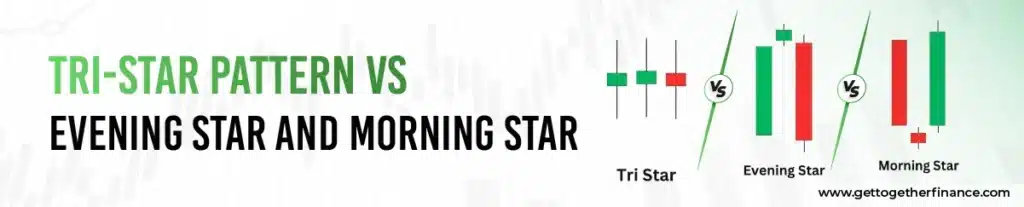
At first glance, the Tri-Star Pattern, Morning Star, and Evening Star can look somewhat similar because all three are associated with trend reversals. But if you look closely, the way they form and what they represent is quite different.
The Tri-Star Pattern is built entirely on indecision. All three candles are dojis, which means the market is repeatedly failing to move in any direction. It’s not that buyers or sellers are taking control, it’s that neither side is able to dominate. This creates a phase where the market slows down, loses momentum, and becomes uncertain. The reversal that follows is not aggressive; it usually comes after this phase of hesitation.
On the other hand, Morning Star and Evening Star patterns show a much more structured transition.
- A Morning Star forms after a downtrend and consists of:
- A strong bearish candle
- A small-bodied candle (indecision or pause)
- A strong bullish candle (clear reversal)
- An Evening Star forms after an uptrend and follows the opposite structure:
- A strong bullish candle
- A pause or small candle
- A strong bearish candle
In both these patterns, the third candle gives a clear directional signal. You can actually see the shift from sellers to buyers (or vice versa) happening more clearly. With the Tri-Star Pattern, that clarity is missing. It doesn’t show direction, it shows loss of direction.
Key Insight:
Morning/Evening Star = Transition with direction
Tri-Star Pattern = Hesitation before direction
This is why the Tri-Star Pattern often requires more confirmation compared to the other two.
Real Chart Examples of the Tri-Star Pattern

If you try to scan charts on platforms like TradingView, you’ll quickly notice that a clean tri-star pattern is not easy to find. Most of the time, you’ll see the following:
- One or two dojis
- Or multiple dojis in a sideways market
But a proper Tri-Star, with three clear dojis and a visible gap in the middle, is rare and that’s exactly what makes it interesting. When the pattern does appear, it is usually not random. It tends to form:
- Near important support or resistance levels
- After an extended move (strong uptrend or downtrend)
- In areas where the market is already under pressure to reverse
For example, during strong trending phases in stocks like Apple Inc. (AAPL), similar structures have appeared near exhaustion points, where the price slows down before changing direction. But here’s the important part: the pattern alone is not the trade.
What matters is what happens next?
- Does price break structure?
- Does volume increase?
- Does momentum shift?
That’s what gives the pattern meaning.
Pro Tip: Instead of trying to find perfect textbook examples, focus on behaviour that resembles the Tri-Star logic—gradual loss of momentum followed by a shift.
Limitations of the Tri-Star Pattern
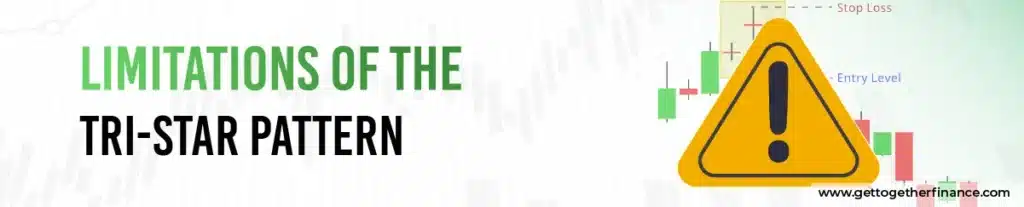
Like every pattern in trading, the Tri-Star Pattern also has its limitations. And understanding these is just as important as understanding the pattern itself.
The first limitation is that it is rare. You won’t see it forming regularly, which means you cannot build a strategy that depends only on this pattern.
The second issue is that it requires confirmation. On its own, the pattern only shows indecision. Without support from price action, levels, or volume, it doesn’t provide a strong trading edge.
Another challenge is that it can be easily misread. Many traders confuse random doji formations in sideways markets with a proper Tri-Star Pattern. But without a clear trend and a visible gap, the pattern loses its relevance.
Most importantly, the Tri-Star Pattern is highly dependent on context. The same structure can mean different things depending on where it forms. A pattern in the middle of a range is far less meaningful than one forming at a key level.
This is why experienced traders don’t treat it as a standalone signal. They use it as:
- A sign to pay attention
- A signal of a weakening trend
- A setup that needs further validation
Mistake to Avoid: Trying to trade every Tri-Star Pattern you see. Not all of them matter.
FAQs

What is a Tri-Star Pattern?
A Tri-Star Pattern represents the fight among buyers and sellers for three consecutive candles. The formation of continuous doji candlesticks represents a trend reversal in security.
When does the Tri-Star Pattern occur?
A Tri-Star Pattern occurs after the occurrence of a downtrend or uptrend in a security. This pattern indicates the end of the trend with potential trend reversal.
What is the bullish Tri-Star Pattern?
A bullish Tri-Star Pattern occurs after the end of a downtrend when the middle candle is at a significant gap from the first and the third candle.
What is a bearish Tri-Star Pattern?
A bearish Tri-Star Pattern occurs after the end of an uptrend in which the middle doji candlestick is formed at a significant gap from the first and the third candle.
How rare is the Tri-Star pattern?
The Tri-Star Pattern is rare because it requires three proper doji candles with a gap in the middle. This structure doesn’t form often, especially after a clear trend.
Is the Tri-Star pattern reliable without confirmation?
No. The Tri-Star Pattern only shows indecision, not direction. Always wait for confirmation like a strong candle or key level reaction.
What timeframe is best for the Tri-Star pattern?
Higher timeframes like 1H, 4H, and daily charts work best, as they reduce noise and give more reliable signals.


