Marubozu Candlestick Pattern: Types, Characteristics & How to Trade It
- Updated on : May 23, 2026
- 7221 Views
- by Arun Singh Tanwar

 Facebook
 Instagram
 Youtube
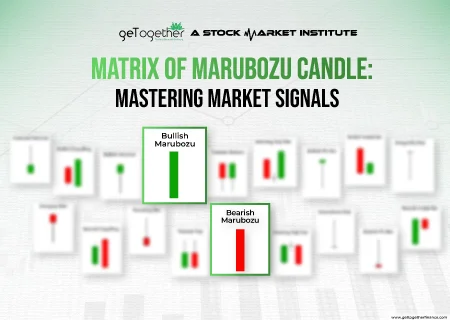
Overview
“Hey! I’ve just spotted a bearish Marubozu candle – looks like the market is on a downward trend.“ If you’re a traditional trader and pay attention to conventional methods of chart analysis, Marabozu candlestick is one of the commonly used patterns you don’t want to miss. But what exactly is the Marubozu pattern, what does it mean, how it works, and why it’s used. We have rolled this e-paper to introduce its basic fundamentals and significance in the trading world. Here is what you need to know.
What is a Marubozu Candle

Each candlestick tells a story through three key elements – the body, the wick, and the color. The body tells us where a stock’s price opened and closed within a specific trading period. The wicks or shadows show highs and lows of that specific timeframe. Whereas the color of the candle boasts of the stock movement’s direction – upward or toward.
Now imagine a candlestick with no wicks/shadows, just a solid body. Simply put, if the candle with no wick (upper and lower) or barely visible wick That’s the essence of a Marubozu candle – a powerful indicator showcasing a strong market sentiment.
How Does a Marubozu Pattern Work?

A Marubozu candle is a powerful candlestick pattern that indicates strong market sentiments or momentum in the direction of the candle. It is characterized by an explosive body with little or no wicks. It implies that it opens at its extreme low or high and closes at the extreme opposite. Unidirectional momentum in the price led by institutional.
There are two types of Marubozu patterns:
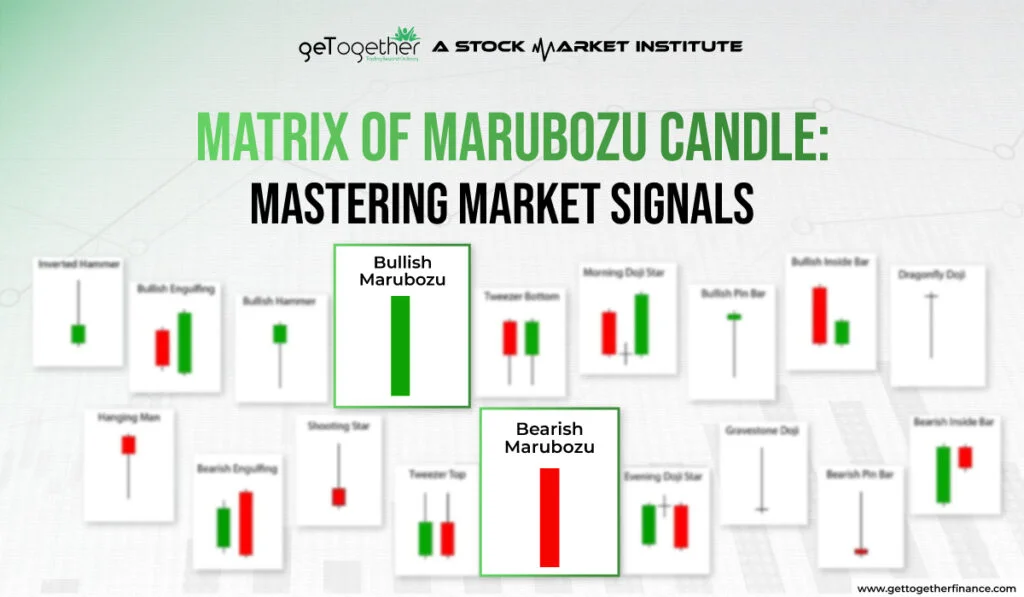
- Bullish Marubozu: A Bullish Marubozu candle forms when the price opens at its low and the closing price is the high of the day. It shows a strong buying pressure created by institutions. Signaling bullish continuation or reversal, depending upon the situation the candle is formed in.
- Bearish Marubozu: A Bearish Marubozu candle forms when the price opens at its high and the closing price is the low of the day. It shows the strong selling pressure created by institutions. Signaling bearish continuation or reversal, depending upon the situation the candle is formed.
No wick in the Marubozu candle implies that either buyers or sellers were in complete dominance over the other during the complete trading session. Making it a strong indicator of prevailing trends.
What Are the Characteristics of a Marubozu Candlestick Pattern?
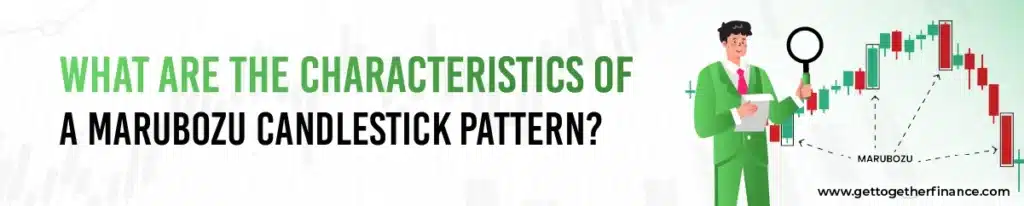
The Marubozu candlestick pattern has very specific characteristics. If these are missing, it is not a true Marubozu candle.
Here’s what defines a Marubozu candlestick pattern:
- A large real body.
- Little to no upper wick.
- Little to no lower wick.
- Opening price at the extreme end.
- Closing price at the opposite extreme.
In a bullish Marubozu candlestick pattern:
- Open = Low
- Close = High
In a bearish Marubozu candlestick pattern:
- Open = High
- Close = Low
The absence of shadows shows complete dominance by buyers or sellers.
If wicks are visible, the Marubozu pattern becomes weaker.
Understanding A Marubozu Candle
The origin of the term “Marubozu” is derived from Japan, which means a bald or shaven head. In other terms, Marubozu translates to command. Hence, this candlestick pattern is created when a candlestick has a comparatively huge body with very small wicks/shadows. A perfect Marubozu candle has only a body and no wicks at all, although such combinations are quite rare. Most of these candles resemble a rectangular block with no wicks or tails.
The whole action indicates that the stock price is poised to move in one direction throughout the trading session after opening or closing at its day-low or day-high. A Marubozu candle has the power to change the flow of the stock price’s direction, bringing about a significant change.
Fun Fact: Japanese rice traders, the OG chart enthusiasts, nicknamed the wide part of candlesticks the “real body” to slyly spot if the closing price outshone or played hide-and-seek with the opening price.
When a Marubozu-type candle appears in an uptrend, it signals that the bulls are aggressively buying the asset, hinting at a potential continuation of upward momentum. Despite the key types, there are three variations of Marubozu candles, segregated on the basis of relationship between the opening and closing prices, and the absence or presence of the wick/shadow. Let’s dig it deeper:
Also Read: Gravestone Doji Candlestick
What Are the Types of Marubozu Candles?

There are different types of Marubozu candles based on wick structure and price positioning.
The main types of Marubozu candlestick patterns are:
- Full Marubozu
- Open Marubozu
- Close Marubozu
- Bullish Marubozu
- Bearish Marubozu
Each type of Marubozu candlestick pattern reflects different levels of market conviction.
A Full Marubozu shows complete control. Whereas an Open or Close Marubozu shows slight rejection but strong continuation pressure. Overall, understanding the type of Marubozu candle improves trade accuracy.
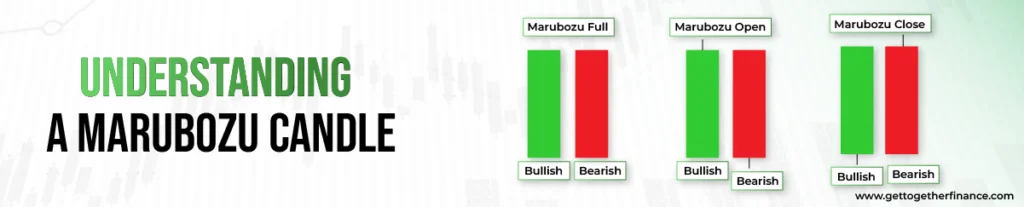
Full Marubozu
- In a full Marubozu, either the opening price is equal to the low, and the closing price is equal to the high (bullish), or the opening price is equal to the high, and the closing price is equal to the low (bearish).
- It represents a strong and decisive price movement in one direction with no shadows.
Close Marubozu
- The Closing Marubozu is a stronger candlestick pattern. It occurs when a candle’s close price is equal to either the low (bearish) or high (bullish) of the day.
- Put simply, if a candle has no wick at the top but a small one at the bottom, it’s a Bullish Close Marubozu. On the flip side, if the wick is at the top but no wick at the bottom, it’s known as a Bearish Close Marubozu.
- This pattern signifies both consistent trader sentiment and the market direction until the end of that particular trading session. Hence, the price is expected to open in the same direction the next day. Such patterns are considered a rare pattern to observe.
Open Marubozu
- This candlestick pattern occurs when the opening price coincides with the high or low of the day. It appears when a candle’s open price is equal to either the high (bullish) or low (bearish) of the day.
- In easy terms, when a candle has no wick at the bottom (open) but a small wick at the top (close), it’s called a Bullish Open Marubozu. On the other hand, if the wick is at the bottom (close) but no wick at the top (open), it’s referred to as a Bearish Open Marubozu.
Understanding these variations helps traders refine their analysis based on the specific characteristics of Marubozu candles observed on the price chart.
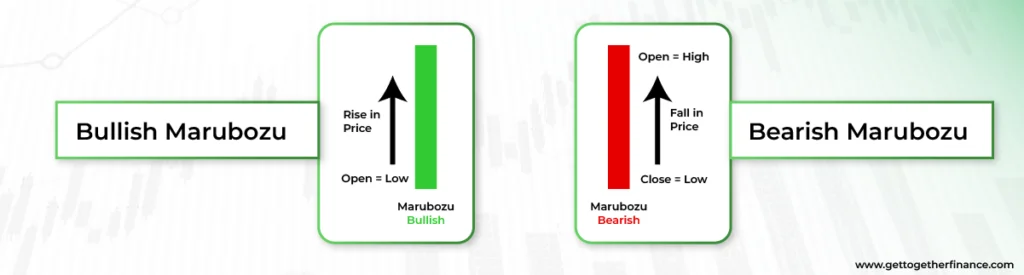
What is Bullish Marubozu?
It’s like a beacon signaling strong buying momentum, indicating potential upward trends. A Bullish Marubozu is a candlestick pattern that signifies a strong bullish sentiment in the market. In a Bullish Marubozu:
- The opening price is equal to the low of the period.
- The closing price is equal to the high of the period.
This pattern suggests that buyers were in control from the beginning of the trading session to the end. The lack of upper wick or shadow indicates sustained buying pressure, and the closing price at the day’s high implies a potential continuation of the upward trend. A Bullish Marubozu is often considered a powerful signal of bullish momentum in the market.
How to Trade with a Bullish Marubozu?

Trading a bullish Marubozu candle can be highly effective, especially when it is formed at the start of an uptrend or after a long consolidation. Here’s how to use it:
- Identify the Bullish Marubozu: Firstly, find an explosive green candlestick with no upper or lower wick. It should ideally be near the support level, after the consolidation or at the start of an uptrend.
- Confirm the Trend: You can use additional indicators like simple moving averages, exponential moving averages, or trend lines to confirm the bullish trend. It will help you in ensuring that the bullish Marubozu candle aligns with the overall market sentiment.
- Entry Point: After this, enter in the long position after the closing of bullish Marubozu or wait for a little more up move in the next candle to a key support level to get a better entry price.
- Set Stop Loss: Do not forget to place a stop loss below the low made by the Marubozu candle, it will help you to minimize risk in case the market sentiments change unexpectedly.
Target: The target should be set in till the next resistance level aligning with the supply zone.
What is Bearish Marubozu?

Conversely, a Bearish Marubozu is a candlestick pattern that indicates a strong bearish sentiment in the market. This suggests intense selling pressure, potentially leading to downtrends. In a Bearish Marubozu:
- The opening price is equal to the high of the period.
- The closing price is equal to the low of the period.
This pattern suggests that sellers dominated the market throughout the trading session. The lack of a lower wick or shadow indicates sustained selling pressure, and the closing price at the day’s low implies a potential continuation of the downward trend. A Bearish Marubozu is often considered a robust signal of bearish momentum in the market.
How to Trade with a Bearish Marubozu?

A bearish Marubozu can signal strong selling pressure, often leading to a further decline in price. Here’s a step-by-step approach to trading this pattern:
Trading a bearish Marubozu candle can be highly effective, especially when it is formed at the start of a downtrend or after a long consolidation. Here’s how to use it:
- Identify the Bearish Marubozu: Firstly, find an explosive red candlestick with no upper or lower wick. It should ideally be near the resistance level, after the consolidation or at the start of a downtrend.
- Confirm the Trend: Similar to a bullish case, you can use additional indicators like simple moving averages, exponential moving averages, or trend lines to confirm the bearish trend. It will help you in ensuring that the bearish Marubozu candle aligns with the overall market sentiment. But, the indicators should be checked at last, first, make sure you have analyzed the chart well based on your study.
- Entry Point: After this, enter in the short position after the closing of bearish Marubozu or wait for a little more down move in the next candle to a key resistance level to get a better entry price.
- Set Stop Loss: Do not forget to place a stop loss above the high made by the Marubozu candle, it will help you to minimize risk in case the market sentiments change unexpectedly and price goes upside down.
- Target: The target should be set in till the next support level aligns with the demand zone.
Trading Marubozu patterns necessitates confirmation and discipline, since their strong directional signals can result in winning trades when combined with suitable risk management tactics.
Example of Marubozu Candlestick
To truly grasp Marubozu, let’s venture into real-life examples:
Stock: Tata Consultancy Services Limited (TCS)
Date: October 11, 2021
Candlestick Pattern: Bearish Marubozu
Observation:
- On October 11, 2021, a Bearish Marubozu candle formed in the weekly chart of TCS.
- The opening price was approximately equal to the high, and the closing price was at the day’s low, creating a candlestick with a large body and little to no wicks/shadows.
- This pattern indicated strong selling pressure.
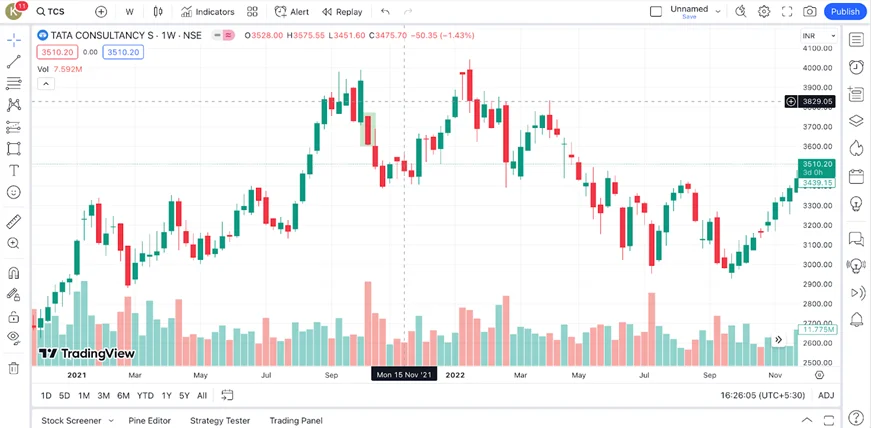
Subsequent Reaction:
- Traders and investors observing this Bearish Marubozu might have considered it as a signal to enter short positions or sell their existing positions.
- The following days could potentially see a continuation of the bearish momentum.
- Risk management strategies, such as setting stop-loss orders, could be implemented based on the insights gained from the Marubozu pattern.
How to Identify Marubozu Candlestick Patterns?

The Marubozu candlestick pattern denotes that the market is moving strongly in one direction. If you notice a bullish Marubozu candle, it means that the buyers are in full control of the market, and hence, you can initiate the ‘Buy’ call.
Identifying Marubozu candle patterns involves looking for specific characteristics in the candle’s structure. Here’s a step-by-step guide:
- Look for a Candle with a Large Body. Marubozu candles often have relatively large bodies.
- Check for the huge candles with little to no wicks or shadows.
- Understand the Opening and Closing Prices:
- Bullish Marubozu: Opening price equals the low, and closing price equals the high.
- Bearish Marubozu: Opening price equals the high, and closing price equals the low.
- Spot a Rectangular Shape. This distinct shape is a key visual cue.
- Consider the Market Context:
- Bullish Marubozu is more significant in an uptrend.
- Bearish Marubozu is more significant in a downtrend.
By following these steps, you can easily spot Marubozu candle patterns on a price chart.
What Are the Best Trading Strategies for the Marubozu Candlestick Pattern?

The Marubozu candlestick pattern is strongest when traded with structure. Below are practical strategies traders use.
#1. How to Confirm Trend with a Marubozu Candlestick Pattern?
Do not trade a Marubozu candle blindly.
First confirm:
- Is the market trending?
- Is price above moving averages?
- Is structure forming higher highs or lower lows?
A bullish Marubozu candlestick pattern works best in an uptrend.
A bearish Marubozu candlestick pattern works best in a downtrend.
#2. Can a Marubozu Candlestick Pattern Signal Reversal?
Yes, but context matters.
If a Marubozu candle forms at strong support or resistance, it can indicate reversal.
For example:
- Bullish Marubozu at demand zone → Possible upward reversal.
- Bearish Marubozu at supply zone → Possible downward reversal.
#3. How to Use Support and Resistance with the Marubozu Pattern?
Support and resistance increase probability.
If a Marubozu candlestick pattern forms:
- At breakout above resistance → Continuation likely.
- At rejection from resistance → Possible failure.
- At strong support → Buying pressure confirmation.
Always align the Marubozu candle with key price levels.
#4. What Is the Ideal Entry and Exit Strategy for Marubozu Trades?
Entry Strategy:
- Enter after candle closes.
- Or wait for small retracement.
Stop-Loss:
- Below the low (bullish Marubozu)
- Above the high (bearish Marubozu)
Target:
- Next resistance or support level.
- Use 1:2 or better risk-reward ratio.
Risk management makes the Marubozu candlestick pattern sustainable.
#5. Which Indicators Work Best with the Marubozu Candlestick Pattern?
The Marubozu candle becomes stronger when supported by:
- Moving Averages
- Volume confirmation
- RSI trend strength
- Breakout levels
- Demand-supply zones
Indicators should confirm — not replace — price action.
What Are the Advantages of the Marubozu Candlestick Pattern?

The Marubozu candlestick pattern is popular because it clearly shows strong market momentum. When a Marubozu candle forms, it tells you one side — buyers or sellers — was completely in control during that session.
Here are the key advantages of the Marubozu candlestick pattern:
- It shows strong directional conviction.
- It helps identify momentum early.
- It works well in trending markets.
- It is simple to identify on charts.
- It improves trade timing when combined with support and resistance.
A bullish Marubozu candlestick pattern signals aggressive buying pressure. A bearish Marubozu candlestick pattern signals aggressive selling pressure.
The clarity of the Marubozu candle is what makes it powerful.
What Are the Limitations of the Marubozu Candlestick Pattern?

While the Marubozu candlestick pattern is strong, it is not foolproof.
Here are the limitations traders must understand:
- The Marubozu candle can fail in sideways markets.
- It may trap traders during fake breakouts.
- It does not confirm trend by itself.
- It needs support from structure or demand-supply levels.
- Late entries reduce reward-to-risk ratio.
A Marubozu candlestick pattern shows momentum — not guaranteed continuation.
That is why confirmation is critical.
In A Nutshell
In conclusion, understanding Marubozu candlestick patterns is like acquiring a powerful lens to decode market movements. Although such a conventional pattern has transformed the way people trade and read the stock market. However, history is evident that such methods have been deceived and are not fully reliable. Hence, it is crucial to support your theories with demand-and-supply dynamics. Analyze, observe, and implement – the trade mantra you would require if conventional methods are your cup of tea.
FAQs
Can Marubozu indicate reversal patterns?
While Marubozu typically signifies strong momentum, it’s crucial to consider other factors for confirmation in potential reversal scenarios.
How often does a Marubozu pattern occur?
Marubozu patterns are relatively common, appearing in various market conditions. However, Marubozu candles with no wick/shadow occur rare and hold huge significance among conventional traders.
What is an opening Marubozu candle?
An opening Marubozu candle is created when the opening price of a stick is equal to the low and the closing price is above the opening price. it signifies a strong bullish start, indicating that buyers dominated from the opening bell.
What is a closing Marubozu candle?
A closing Marubozu candle is the exact opposite of an opening Marubozu candle. It occurs when the opening price of a stock is below the closing price, with the equal of closing price to the high. This pattern shows a robust bearish sentiment, recommending sellers control the complete session.
What is a full Marubozu candle?
A Full Marubozu candle is one where either the opening price is equal to the low and the closing price is equal to the high (bullish). Or the opening price is equal to the high and the closing price is equal to the low (bearish). It represents an extreme move in one direction.
How can I notice the Marubozy candlestick pattern?
Spotting a Marubozu involves looking for a candle with a significant body and little to no wicks or shadows. In a bullish scenario, the open and low are the same, while in a bearish scenario, the open and high are identical. Sometimes, such candles include wicks which are considered rare scenarios..
What does the color of the Marubozy candlestick denote?
The color of the Marubozu candlestick denotes the direction of the price movement. A green Marubozu indicates a bullish trend, suggesting upward momentum and a dominant presence of buyers. Conversely, a red Marubozu signals a bearish trend, implying a downward trajectory and a stronger influence from sellers. The color of the Marubozu candlestick provides a quick visual representation of the prevailing market sentiment.


