
How to Analyse Stocks Before Trading: Key Methods
- Updated on :
- 33 Views
- by Suhani

 Instagram

When we enter the stock market without proper analysis, it only leads to losses and wrong choices. Instead of studying the stock, many beginners jump into trades based on emotions or tips. That is why traders need to learn how to analyze stocks before trading.
Before placing a trade, every professional trader studies risk factors, price action, market trends, and trading volume. By properly analyzing the stocks, they can make better and more informed decisions.
In this blog, you’ll learn about different methods of stock analysis for trading. This includes fundamental analysis, technical analysis, market trends, risk management, and support and resistance. Besides this, you will understand how traders analyze stocks before entering a trade.
Why Is Stock Analysis Important Before Placing a Trade?

Most traders enter a trade just because a stock is moving quickly or someone recommends it online, which is the biggest mistake. However, achieving consistent success in trading requires discipline, skill, and strategy. When a trader does a proper analysis, they can identify opportunities and make smart trading decisions.
When you learn how to analyze stocks before placing a trade, it helps in:
- Finding the most suitable positions to enter and exit the market
- Avoiding emotional trading decisions
- Understanding whether a stock is strong or weak
- Improving consistency over time
- Managing risk effectively
Without proper analysis, trading is just gambling. But when done right, it becomes a simple process where decisions are based on facts, not feelings.
Different Types of Stock Analysis

In trading, there are mainly two types of stock analysis methods: fundamental analysis and technical analysis. Both of these methods are useful for evaluating stocks, but each one focuses on a different part of the market.
- Fundamental Analysis: It means studying the growth, finances, and overall strength of the company. With this, you can decide whether it is really worth investing your money.
It includes examining:
- Industry growth potential
- Revenue growth
- Return on equity
- Management quality
- Debt levels
- Profit margins
- Earnings per share
- Price-to-earnings ratio
The main goal of fundamental analysis is to find strong companies that can grow in the future.
- Technical Analysis: It means studying past trends, price movements, and charts to predict future price movements. The main idea is that the current price of a stock already tells you everything you need to know.
Technical analysis uses tools such as:
- Demand and supply zones
- Moving averages
- Candlestick patterns
- Trendlines
- Support and resistance
- RSI and MACD
By understanding these methods, you can better learn how to analyze stocks before trading.
Understanding Market Trends Before Trading

Before placing any trade, traders must evaluate the prevailing direction of the market. When they go against the trend, it increases the chances of loss and risk.
There are mainly three types of market trends:
- Uptrend: A stock is considered to be in an uptrend when its price continuously reaches new higher highs and higher lows over time. This consistent pattern shows strong demand from buyers and strong confidence among traders or investors that the stock’s price will keep rising.
- Downtrend: When a stock continuously forms lower highs and lower lows over time, it is considered a downtrend. This pattern indicates a strong selling pressure, and most traders or investors in the market believe that stock prices will continue to fall.
- Sideways Trend: When the price of a stock neither moves significantly upward nor downward, then it is considered a sideways trend. This stage is also called consolidation, a period where buyers and sellers are equally matched. It means that when the buyers are not strong enough to push prices higher, and sellers are not strong enough to push prices lower. Then, the price just keeps moving sideways within a range without going up or down clearly.
Analyzing Stock Price Action

Price action analysis is the process of analysing stock price movements without relying heavily on technical indicators or other tools. It enables traders to monitor buyer and seller behavior based on current market activity. Also, it plays a major role in stock analysis and is typically applied before a trader decides to enter any trade.
Price action analysis is the best choice for most experienced traders because it tells what is actually happening in the market. In addition, it gives deeper insights into market movements. Some key price action concepts are:
Candlestick Patterns: By studying candlestick patterns, traders can identify possible changes in market mood and identify early warnings of a potential trend change. There are some patterns, such as shooting star, bullish engulfing, hammer, and doji, that help them understand buying and selling pressure.
Breakouts: When a stock’s price moves strongly above resistance or below support levels, then the breakout happens. This indicates rapid price movement and the beginning of a new trend.
Rejections: Rejection from a price level means the stock price tries to move above or below some level but fails many times because buyers or sellers push the price back.
For example, if a stock repeatedly fails to move above a resistance level, it indicates strong selling pressure.
How to Identify Support and Resistance Levels?

In technical analysis, support and resistance are the most important concepts that play a vital role in stock analysis before trading. Both levels help traders pinpoint the areas where stronger buying or selling forces are likely to emerge in the market.
Support: It is the price level at which buying demand becomes so powerful that it prevents the stock from falling further. When the price hits this level, buyers come in and push the stock price back up.
Resistance Levels: It is a price level where sellers stop the stock from rising further. At this point, the price may go back down.
Traders use support and resistance levels to:
- Identify breakout opportunities
- Plan trade entries
- Define profit targets
- Set stop losses
For example: When you buy a stock near a support level have lower risk because the stock has often found buyers there before. And when a stock price reaches a resistance level, it struggles to go higher because several sellers start selling there. Thus, traders may choose to sell near that level by expecting that the price will decline again.
In the market, strong support and resistance zones serve as critical decision points. And, if you want to know how to analyze stocks before trading, then it is important to know these levels.
Technical Indicators Used In Stock Analysis
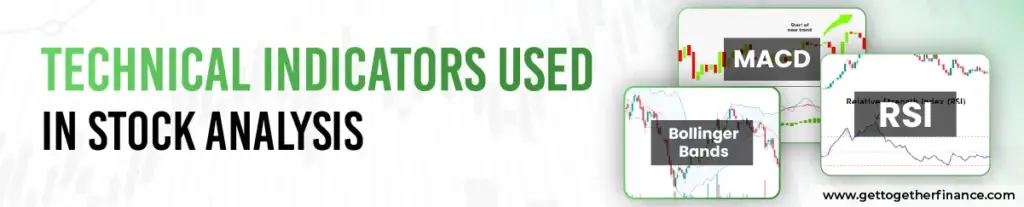
Technical indicators are tools that help traders identify trends, confirm trading decisions, and examine market conditions. These tools are popular in trading because they help traders understand what the price is doing and how aggressively the market is moving. This helps them make better trading decisions.
Some commonly used technical indicators are:
Moving Averages: This is a tool that helps traders see the big picture of where a stock’s price is moving. Also, they serve as dynamic support and resistance levels that assist them in spotting potential entry and exit points.
Relative Strength Index (RSI): RSI assesses the strength of market momentum and indicates whether a stock’s current price may be too high or too low in the short run.
Bollinger Bands: They assist traders in identifying potential buying or selling opportunities around key price levels while also providing insight regarding how aggressively the market is moving.
Moving Average Convergence Divergence (MACD): MACD allows traders to determine whether the market’s momentum is gaining or losing strength by examining the relationship between several moving averages.
Volume Weighted Average Price (VWAP): Intraday traders majorly use VWAP to identify whether a stock’s current price is trading higher or lower than its average price throughout the trading day.
How to Analyze Trading Volume

Trading volume is the number of shares that are bought and sold during a particular time period. It is one of the most crucial factors for traders because it shows the level of buying and selling activity in a stock. Also, volume allows traders to get to know whether a stock’s move is powerful or weak. There are generally two types of volume, which are given below:
High Volume: A stock that moves with high trading volume indicates strong buying or selling interest in the market. For example, if a stock breaks a resistance level with high volume, it is the most reliable breakout for traders.
Low Volume: When a stock’s price increases or decreases on low trading volume, it indicates that the move is weak and not strongly supported by traders. If several traders are not involved in a price move, it means the move is not trustworthy, so they should avoid it.
Volume analysis helps traders:
- Identify strong momentum
- Confirm market trends
- Spot possible institutional activity
Most experienced traders do not take trades only on a price movement basis. They combine price action with volume analysis because, without strong trading activity, a price move may not be trustworthy.
Checking Market Momentum Before Trading

Several traders check market momentum before entering a trade to understand how strongly a stock is moving. Momentum represents the strength and speed of a price move. The stocks that have strong momentum generally move in the same direction for a while. Whereas those stocks that have weak momentum indicate that the price move may soon decrease or reverse.
There are many tools, such as RSI, trend analysis, MACD, price action, and volume, to measure momentum. Strong bullish momentum signals strong buying pressure, while bearish momentum shows strong selling pressure. By evaluating momentum, traders can avoid low-quality trade setups and identify higher-quality trading opportunities.
Risk Management Before Entering a Trade

In every trade, there is some risk involved, no matter how carefully you analyze a stock. This is the reason why professional traders emphasise protecting their capital over profit. A trader who manages risk well is the one who can also deal with losses effectively.
In order to manage risk, traders set stop losses and avoid investing too much money in one trade. Another important thing that traders need to consider is avoiding overtrading; taking too many trades only leads to losses and emotional decisions.
Those who understand how to analyze stock before placing a trade but avoid risk management may find it difficult to stay consistent in the market.
Tools That Traders Use to Analyze Stocks

In the stock market, there are several tools and platforms available to make your stock analysis more effective and smooth. These tools help traders monitor trading opportunities, news, market trends, and charts, which reduces the need for manual work.
Charting platforms like TradingView are mainly used for analysing indicators, market trends, and charts. In addition, traders use stock screeners to filter stocks based on particular aspects such as sector performance, volume, technical patterns, and price action.
When you use the right tool, you can save time and make better trading decisions.
Common Mistakes Traders Make When Analyzing Stocks
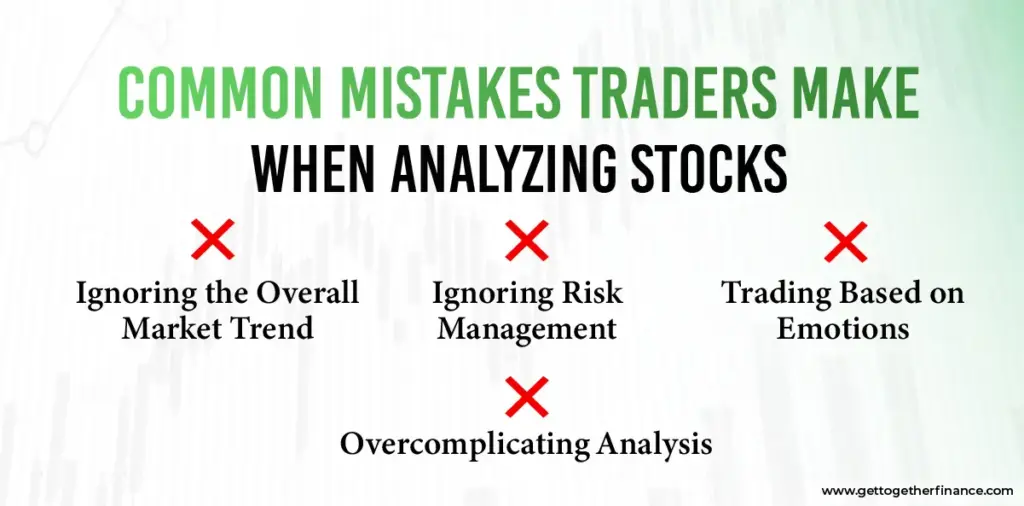
At the time of analyzing stocks, there are some mistakes that traders make that hamper their trading performance. But when you understand these mistakes, it helps you make better decisions.
- Ignoring the Overall Market Trend: Sometimes, traders become so focused on a single stock that they forget to check how the market is performing as a whole.
- Trading Based on Emotions: In trading, there is no space for emotions, as all work is done by proper planning. Emotions such as impatience, fear, and greed only lead to losses and poor entries.
- Ignoring Risk Management: Sometimes, traders overlook the importance of risk management and enter a trade without proper planning and without placing a stop-loss, which ultimately leads to huge losses.
- Overcomplicating Analysis: When traders use multiple indicators in one chart, it tends to create confusion and lead to ineffective decision-making.
Tips for Beginners to Analyze Stocks Effectively

If you are new to trading, first, focus on learning one thing instead of grasping everything at once. Always keep your charts simple and avoid using multiple indicators because it creates confusion. When you learn something, practice it on a chart to get a better understanding and build confidence.
Additionally, journaling plays an important role in your trading journey. By maintaining a trading journal, you can track your mistakes and progress.
Moreover, patience and proper risk management are the most crucial factors in trading, as achieving long-term consistency mainly depends on these qualities.
Final Thoughts
Having a strong understanding of how to analyze stocks before trading is essential for making better and well-informed trading decisions. Successful traders make decisions based on proper risk management, momentum, market analysis, volume, price movement, and trends instead of tips or emotions. No matter which approach you prefer, technical analysis, fundamental analysis, or both, the main objective is to make informed decisions. Always start with simple strategies, stay disciplined, and practice a lot to improve your skills and become a professional trader.
Why is stock analysis important before trading?
Stock analysis is important before trading because it helps traders manage risk, avoid emotional trading, and make informed decisions.
What are the main types of stock analysis?
There are mainly two types of stock analysis: fundamental analysis and technical analysis.
What does technical analysis focus on?
Technical analysis focuses on indicators, price movements, charts, and trends.
Why are support and resistance levels important?
Support and resistance levels are important because they help traders identify possible breakout areas, entry points, and exit points.
How does trading volume help traders?
Trading volume helps traders confirm whether a price move is reliable, strong, or weak.
What is the role of risk management in trading?
Risk management plays a crucial role in trading by protecting the capital of traders and lowering potential losses.
What mistakes should beginners avoid while analyzing stocks?
Beginners should avoid overtrading, emotional trading, using multiple indicators, and ignoring market trends.



