
IV Rank vs IV Percentile: Which Is Better for Options Traders?
- Updated on :
- 8 Views
- by Juhi Sharma

 Instagram
 Linkedin
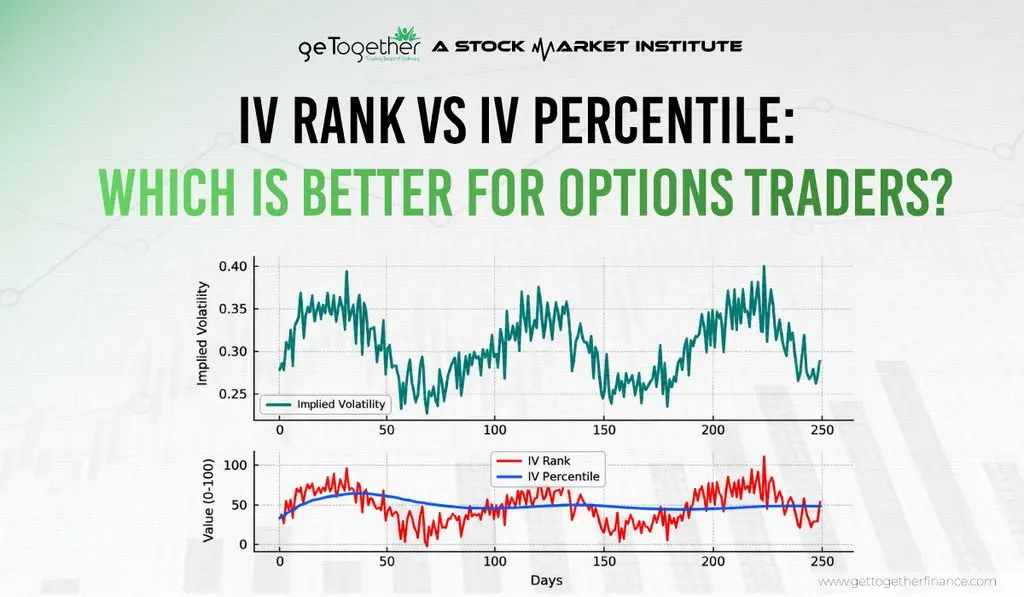
Open any options chain, and you will probably see two numbers sitting side by side: IV rank and IV percentile. Both try to answer one simple question that every options trader asks sooner or later: are option premiums cheap or expensive right now?
The confusing part is that these two numbers can give you very different answers for the same stock on the same day. One may say “high” while the other says “low”. So when you compare IV rank vs IV percentile, which one should you believe?
This guide walks you through it step by step. We start with implied volatility itself, then look at how each number is calculated, where they differ, and how traders actually use them. Along the way, you will see simple examples, including a few from the Indian market, so the idea sticks.
The short answer: neither one is better in every situation. IV rank is quicker to read and easier to explain. IV percentile holds up better when a stock has had a big volatility spike in the past year. Most experienced options traders look at both, and by the end of this blog you will know why.
What Is Implied Volatility and Why Does It Matter?
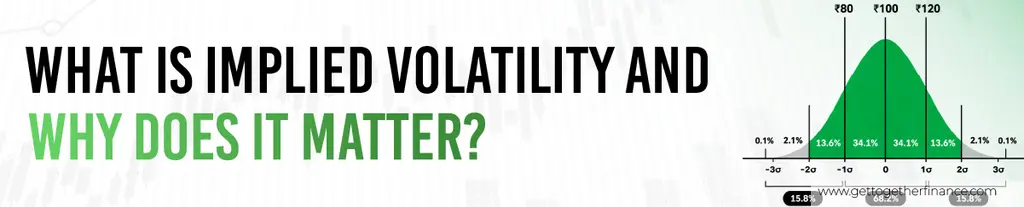
Implied volatility, or IV, is the market’s estimate of how much a stock or an index may move in the future. It is shown as a percentage, and it is already built into the price of every option. That is why people often call it the “expected volatility” of an option.
An easy way to picture it is insurance. When the weather looks calm, insurance on your trip costs very little. When a storm is forecast, the same insurance suddenly costs more, because the chance of trouble has gone up. Option premiums work in a similar way. When traders expect a big move, they are willing to pay more for options, and IV goes up. When they expect things to stay quiet, premiums get cheaper, and IV comes down.
One thing is worth getting clear early, because beginners often mix it up: IV tells you how big a move the market expects, not which direction the price will go. A stock with high IV can rise sharply or fall sharply. IV only says “a big move is expected”, never “up” or “down”.
Why does implied volatility change?
IV is not fixed. It keeps shifting because the market’s expectations keep shifting. These are the most common reasons:
- Scheduled events: quarterly results, RBI policy decisions and the Union Budget all create uncertainty, so IV usually builds up before them.
- Surprise news: a global sell-off, new tariffs or an unexpected election result can push IV up in a single day. In April 2025, for example, Nifty IV jumped when new tariff announcements hit global markets.
- Demand for options: when more traders rush to buy options as protection, premiums rise and so does IV.
- Time passing: once an event is over and the uncertainty is gone, IV usually cools off.
How does IV change option premiums?
Every option price has two parts. The first is intrinsic value, which is how far the option is already in the money. The second is extra or time value, which is what you pay for the chance of a bigger move. IV mostly affects this second part.
Here is a simple example. Say Nifty is at 25,000 (a hypothetical level) and you look at an at-the-money call option with 30 days left. The numbers below come from a standard option pricing model, so treat them as a learning example and not as live market quotes:
| IV level | Approx. call premium (per unit of Nifty) |
| 12% | ₹413 |
| 15% | ₹498 |
| 20% | ₹639 |
| 30% | ₹924 |
Look at that table closely. The strike is the same. The expiry is the same. Nifty is at the same level. The only thing that changed is IV, and yet the premium more than doubled between 12% and 30%.
The Greek that measures this effect is called vega. It tells you how much an option’s price moves for every 1 point change in IV. In the example above, vega is roughly ₹28 per IV point for a 30-day at-the-money Nifty option. To get the rupee impact on one full lot, you would multiply it by the lot size, so check the current Nifty lot size on the NSE website.
IV also gives you a quick idea of the expected move. At 15% IV with 30 days left, the market is pricing in a range of roughly 25,000 × 0.15 × √(30/365), which comes to about 1,075 points on either side.
Now here is the catch. Is 15% IV high or low? It depends completely on the stock. A 30% IV may be normal for one share and extreme for another. A raw IV number on its own does not tell you whether options are expensive. That is exactly why traders use relative measures like IV rank and IV percentile. They compare today’s IV with that same stock’s own history, which makes the number much easier to judge.
What Is IV Rank?
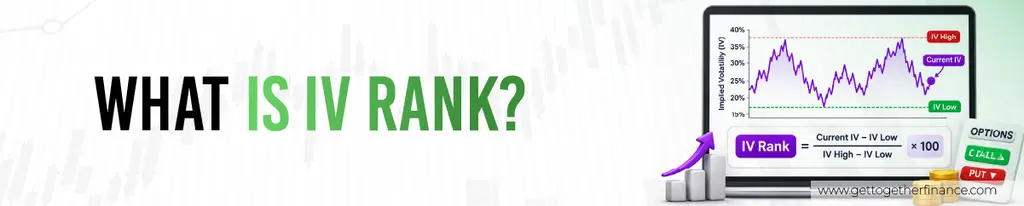
IV rank tells you where today’s implied volatility sits between its lowest and highest level over the past 52 weeks. Think of it as a ruler. Zero means IV is at its lowest point of the year. One hundred means IV is at its highest point of the year. Everything else falls somewhere in between.
IV rank formula
IV Rank = (Current IV − 52-week low IV) ÷ (52-week high IV − 52-week low IV) × 100
IV rank calculation example
Over the last year, a stock’s IV has ranged from a low of 30 to a high of 60. Today, IV is 45. Here is how the calculation goes:
- Step 1: Current IV minus the 52-week low: 45 − 30 = 15
- Step 2: 52-week high minus the 52-week low: 60 − 30 = 30
- Step 3: Divide and multiply by 100: 15 ÷ 30 × 100 = 50
So the IV rank is 50. IV is sitting exactly in the middle of its yearly range.
Let’s try two more quick ones on the same 30 to 60 range. If today’s IV were 54, the rank would be (54 − 30) ÷ 30 × 100 = 80. If today’s IV were 33, the rank would be (33 − 30) ÷ 30 × 100 = 10. And on a different stock with a range of 18 to 38 and a current IV of 25, the rank would be (25 − 18) ÷ 20 × 100 = 35.
What does a high IV rank mean?
A high IV rank means IV is close to the top of its one-year range. In simple words, options on that stock are expensive compared with how they were priced during the past year. Many traders treat an IV rank above 50 as high, and some people wait for 70 or more before calling it really high.
A high reading often shows up around results, big announcements or market stress. It tells you that the market is nervous or expecting something, and premiums reflect that.
What does a low IV rank mean?
A low IV rank means IV is close to the bottom of its yearly range. Options are cheap compared with the past year, and the market is expecting calm. A reading below 20 or 30 is commonly called low.
A quick but important note: these cutoffs are habits, not fixed rules. Different traders and different platforms draw the line in different places. Use them as a rough guide, not as a signal that works on its own.
What Is IV Percentile?

IV percentile takes a different route. It does not care how high or low IV got during the year. It simply counts days. It tells you on what percentage of trading days in the past year IV closed lower than it is today.
If you have ever heard “you scored better than 80% of the class”, you already understand the idea. It is not about your marks. It is about how many people you beat.
IV percentile formula
IV Percentile = (Number of days IV was below today’s IV ÷ Total number of trading days) × 100
Most platforms use about 252 trading days, which is roughly one year of market days.
IV percentile calculation example
Say IV was lower than today’s level on 202 out of 252 trading days. Then:
202 ÷ 252 × 100 = about 80
So the IV percentile is 80. In plain words, IV has been lower than this on roughly 80% of the days over the past year. Today’s IV is higher than usual for this stock.
Now flip it around. If IV was lower than today’s level on only 25 of 252 days, the IV percentile is about 10 (25 ÷ 252 × 100). Today’s IV is lower than usual.
What does a high IV percentile mean?
A high IV percentile means today’s IV is higher than it was on most days of the past year. Options are on the expensive side compared with the stock’s own history. Traders often treat something around 70 to 80 or above as high, though again this is a habit and not a rule.
What does a low IV percentile mean?
A low IV percentile means IV has been higher than today’s level on most days. Options are on the cheaper side. Readings below 20 or 30 are often called low.
So far, IV rank and IV percentile sound almost identical. Both say “high means expensive, low means cheap”. The real difference is in how they get to that answer, and that is what we look at next.
IV Rank vs IV Percentile: What’s the Difference?
Here is the simplest way to remember it. IV rank looks at the size of the range. IV percentile looks at how many days.
Rank only uses two data points: the highest IV and the lowest IV of the year. Everything in between is ignored. Percentile uses every single trading day in the window.
Difference in calculation. Rank is a position on a ruler. Percentile is a headcount of days. That small change in method leads to very different behaviour when the data is uneven.
Difference in historical interpretation. Rank answers: “How close is IV to the top of its yearly range?” Percentile answers: “How often has IV been lower than this?” One is about distance, the other is about frequency.
Effect of extreme IV values. Because rank depends on only the highest and lowest points, one extreme day can change it a lot. Percentile treats that same extreme day as just one day out of 252, so it barely moves.
Here is how they compare side by side:
| IV Rank | IV Percentile | |
| What it measures | Where IV sits between its 52-week low and high | How many days IV was below today’s level |
| Data used | Only two points: the high and the low | Every trading day in the window |
| Typical lookback | 52 weeks | About 252 trading days |
| Effect of one big spike | Large. One spike can drag the rank down for months | Small. A spike counts as just one day |
| Easy way to read it | “How far up the ruler is IV?” | “How often has IV been lower than this?” |
| Works best when | IV has stayed in a steady range | The year had a one-off spike |
A Real Example: One Spike, Two Different Numbers
The difference matters most right after a shock. In March 2020, during the COVID crash, Nifty IV shot up to about 136%. Now jump to 17 June 2020. Nifty IV was around 35%. That is still a high level compared with most days of that year.
But look at what the two numbers said that day:
- IV rank: about 21. It looked low, because the March spike had stretched the top of the range so far that 35% looked small next to it.
- IV percentile: about 85. It showed that IV was higher than on most days of the year.
Same IV. Two very different stories. A trader reading only IV rank might have concluded that options were cheap. They were not.
Here is a simple made-up version so you can check the math yourself. A stock, let’s call it ABC, has a one-year IV low of 15, a one-year high of 80 (from one panic week), and a current IV of 30.
- IV rank = (30 − 15) ÷ (80 − 15) × 100 = about 23
- If IV was below 30 on 214 of 252 days, IV percentile = 214 ÷ 252 × 100 = about 85
- Without that one spike (say the yearly high was only 40), IV rank would be (30 − 15) ÷ (40 − 15) × 100 = 60
One week of panic pulled the rank from 60 down to 23, and it will stay down until that spike drops out of the 52-week window. The percentile barely noticed.
There is a flip side too. After a volatility spike, IV percentile can stay high for a while even when things have calmed down. The reason is that today’s IV may still be above most of the days in the past year, so the count stays high. Rank and percentile are telling you different things, and both can be true at once.
IV Rank vs IV Percentile: Which Is Better for Options Traders?

Honestly, it depends on the situation. Each one has a job where it does better, so here is how to think about it.
IV rank can be more useful when:
- you want a quick and easy number to read or explain to someone
- the stock’s IV has moved in a steady range through the year, with no wild outliers
- you are scanning many stocks at once and need a fast filter
IV percentile can be more useful when:
- the past year had one big spike or crash that is stretching the range
- you want to know how common today’s IV level really is
- you want a number that is less shaken by a single outlier
In calm years, the two numbers usually tell a similar story. After a major spike, IV percentile often gives the more honest picture. Rank is simple but sensitive, and percentile is steadier but a bit less intuitive.
Why Many Traders Check Both?

Looking at both numbers is the easiest way to catch problems before they cost you money. Here is how to read them together:
- Both high: IV is expensive by both measures. That is a strong sign that premiums are rich.
- Both low: IV is cheap by both measures, so options are priced for calm.
- Rank low, percentile high: this usually means an old spike is pulling the rank down, like Nifty in June 2020. Check the IV chart before deciding anything.
- Numbers disagree in other ways: don’t guess. Look at the IV chart and the news for that stock.
And one more thing, which we will repeat later because it matters: neither metric should be used alone. They do not tell you the price direction, the upcoming events, or which strategy fits your view. They are one input in a bigger decision, not the decision itself.
How to Use IV Rank and IV Percentile in Options Trading

The main job of both numbers is to help you judge the option premium before you choose a strategy. Think of it as checking the price tag before you buy. Here is the usual thinking.
When IV rank or IV percentile is high
Premiums look rich. Option sellers often look at premium-selling strategies such as credit spreads, iron condors or short strangles. The idea is simple: if IV falls back toward normal, the option they sold becomes cheaper, and they can keep the difference. But there is a risk. IV may be high for a very good reason, like a big event, and the stock can still move far enough to hurt the seller. High IV means “expensive”, not “safe to sell”.
When IV rank or IV percentile is low
Premiums look cheap. Option buyers often look at long calls, long puts or straddles, because they pay less for the same option. The risk here is different. Cheap options still need the stock to actually move. If the price just drifts sideways, time decay can slowly eat the premium. Low IV means “cheap”, not “bound to rise”.
When the reading is in the middle
IV alone gives you little to work with. This is when your view on the stock, the chart and your risk limit matter more.
Use other volatility metrics alongside them
IV rank and IV percentile become far more useful when you add a few more checks:
- Historical volatility (HV): this is how much the stock has actually moved recently. If IV is much higher than HV, the market is pricing in more movement than what has been happening.
- India VIX: for Nifty options, India VIX shows the market’s expected volatility for the next 30 days. It is built from Nifty option prices, and individual stocks do not have a VIX of their own.
- Expected move: convert IV into a rough price range, as we did earlier, and ask whether that range looks reasonable for the event ahead.
A simple checklist before any trade
- Check IV rank and IV percentile together.
- Look at the event calendar for results, RBI policy and the Budget.
- Compare current IV with recent historical volatility.
- For Nifty trades, glance at India VIX.
- Only then pick a strategy that fits your view and your risk limit.
What Happens Around Events: IV Crush

Events are where IV rank and IV percentile move the most. This is why you should always check the calendar before you act on a high reading.
Earnings and result announcements. Before a company announces quarterly results, nobody knows what the numbers will show. Traders buy options to be ready for a big move, and IV for that stock climbs. As IV rises, so do its IV rank and IV percentile. That is why a high reading right before results is often not a bargain. It is simply the market pricing in the event.
Major economic events. The same thing happens with index-level events. RBI policy decisions, the Union Budget, election results and big global events can all lift IV for Nifty and other indices. Two real examples from Indian markets:
- July 2024, before the Union Budget: India VIX rose more than 4% to about 15.5, a six-week high, as traders worried about possible tax changes on derivatives.
- 4 June 2024, election result day: India VIX jumped about 28% to roughly 26.7, and Nifty fell nearly 6% in a single day.
Expected volatility before an event. In the days before a known event, IV tends to build up because the market is “paying” for the uncertainty. This extra IV is the market’s way of pricing in a possible big move.
IV crush after the event. Once the news is out, the uncertainty disappears and IV often drops quickly. Traders call this IV crush. It can hurt option buyers a lot, even when the stock moves in the direction they wanted.
Here is a hypothetical example. Nifty is at 25,000, and just before an event, a 5-day at-the-money call costs about ₹303 with IV at 25%. The event passes and IV falls to 15%, with 4 days left. Look at what happens:
- Nifty rises 0.4% to 25,100: the call is worth about ₹223. That is a loss of around 26%, even though Nifty went up.
- Nifty rises 0.6% to 25,150: about ₹255, still a loss of around 16%.
- Nifty rises 0.8% to 25,200: about ₹290, a small loss of around 4%.
If IV had stayed at 25%, those same moves would have been worth roughly ₹325, ₹354 and ₹385. That gap is the crush. A buyer can be right about direction and still lose money.
But crush is common, not guaranteed. The 4 June 2024 result day shows IV can also jump after the event when the outcome is a surprise. So treat IV crush as a risk to plan for, not a rule you can count on.
What happens when IV expands or contracts?
It helps to see both sides in one place:
- IV expands (goes up): option buyers usually gain, because the options they hold become more valuable. Using our earlier example, a 30-day at-the-money Nifty call would move from about ₹498 at 15% IV to about ₹639 at 20% IV, with nothing else changing. Option sellers usually feel the pain, because the options they sold become more expensive to buy back.
- IV contracts (goes down): option sellers usually gain, because the premium they collected shrinks. Buyers lose value even if the stock does not move against them. The same call falling from 20% to 15% IV would drop from about ₹639 back to about ₹498.
Limitations and Common Mistakes

IV rank and IV percentile are helpful, but they are not magic numbers. Knowing their limits will save you from some very common mistakes.
Limitations of IV Rank and IV Percentile

Both metrics depend on historical IV. They only compare today’s IV with the last year or so. A very calm year makes normal IV look high. A very wild year makes normal IV look low. The numbers are only as meaningful as the past they are measured against.
Extreme volatility can distort the numbers. We saw this with Nifty in June 2020. One huge spike can stretch the 52-week range so far that IV rank stays low for months, even when current IV is high by normal standards. IV percentile is less affected, but it can also stay elevated for a while after a spike.
High IV does not predict price direction. It only says the market expects a big move. The stock can go up, down or both. India VIX often rises when Nifty falls, because people buy protection when they are worried, but this link is not fixed, and a high VIX does not mean prices must fall.
Low IV does not guarantee an increase in volatility. Calm stocks can stay calm for a long time. A low reading does not mean a big move is “due”.
Different platforms may calculate the metrics differently. The lookback period, the way IV is measured and any extra adjustments can vary from one platform to another. The same stock may show slightly different numbers on two different tools. Always check the help page of the platform you use so you know exactly what it is showing you.
Common IV Rank and IV Percentile Mistakes

Treating high IV as a bearish signal. High IV means the market expects a large move, not a fall. Prices can shoot up just as easily.
Treating low IV as a bullish signal. Low IV means the market expects calm. It says nothing about the price rising.
Choosing an options strategy based only on IV rank. A high IV rank does not automatically mean “sell options” and a low one does not mean “buy options”. You also need your view on direction, the event calendar, and a risk limit you are comfortable with.
Ignoring upcoming events. A high reading just before results or a policy announcement is often there for a reason. If you sell options without checking the calendar, you may be selling right before the exact move the market was pricing in.
Confusing IV percentile with option probability. An IV percentile of 80 does not mean there is an 80% chance of anything happening, such as an option finishing in the money. It only says that IV was lower than today’s level on about 80% of past days. It is a count of history, not a forecast of what comes next.