
Market Depth in the Stock Market: How to Read the Order Book Before Trading
- Updated on :
- 2 Views
- by Juhi Sharma

 Instagram
 Linkedin
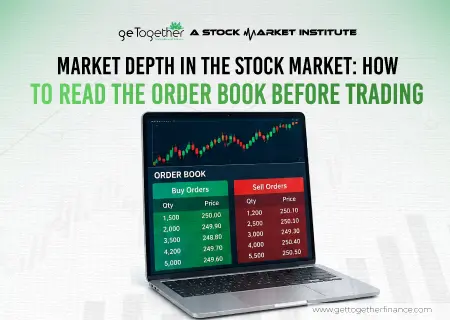
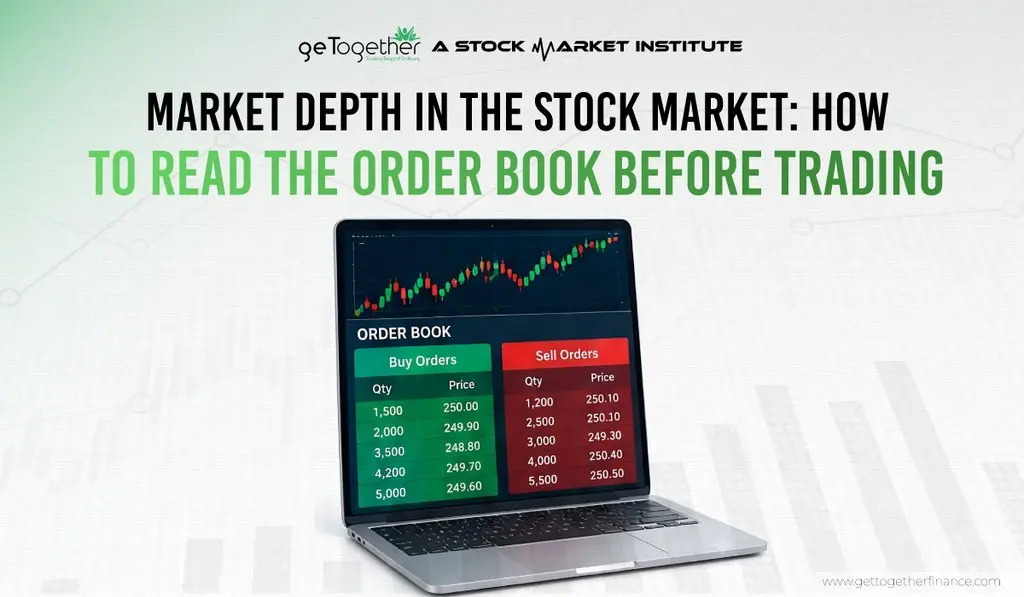
Have you ever placed a buy order and wondered why the price you got was a little different from the price you saw on the screen? Or have you seen a stock jump suddenly and asked yourself who was buying it so aggressively? The answer to both questions usually sits in one small table on your trading app, and that table is called market depth.
Market depth in the stock market shows you how many buyers and sellers are waiting at each price and how much quantity they want to trade. In this blog, we will first understand what the order book is, then learn how to read it step by step, and finally see how traders use it in real situations. We will also talk about where market depth can mislead you, because knowing its limits is just as important as knowing how it works.
What Is Market Depth in the Stock Market?
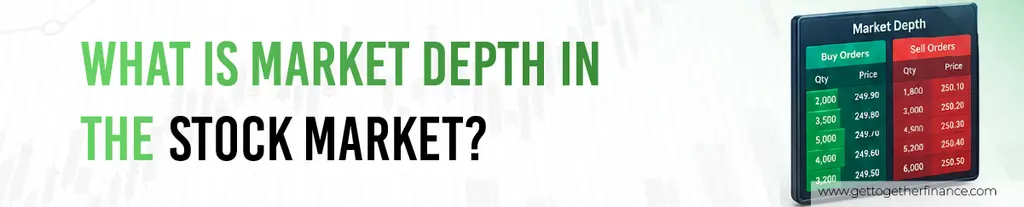
Market depth is a live list of all the pending buy and sell orders for a stock, arranged by price. It tells you how much demand and supply exists at the current price and at the prices just above and below it. Most trading apps show it as a small table with five levels of buyers and five levels of sellers, and many brokers now offer 20 levels as well. Because it updates every second, market depth is one of the clearest ways to see what is happening in a stock right now.
What Market Depth Shows Traders?
A market depth screen answers three simple questions. First, at what price are buyers willing to buy, and at what price are sellers willing to sell? Second, how many shares are waiting at each of those prices? Third, how far apart are the two sides? When you put these answers together, you get a picture of how easily a stock can be bought or sold at that moment.
For example, if thousands of shares are waiting on both sides at nearby prices, the stock is active and your order will most likely be filled quickly. On the other hand, if only a few shares are waiting and the prices are far apart, the stock is thin, and your order may move the price.
Market Depth vs Market Liquidity
Many beginners use these two terms as if they mean the same thing, but they are slightly different. Market liquidity is the overall ease of buying or selling a stock without affecting its price, while market depth is the tool that lets you see that liquidity in numbers. In simple words, liquidity is the idea and market depth is the proof. A stock like Reliance or HDFC Bank is liquid, and you can confirm it by looking at the heavy quantities sitting on both sides of its depth. Now that we know what market depth is, let us look at the table behind it, which is the order book.
What Is an Order Book? Bid, Ask and Spread Explained
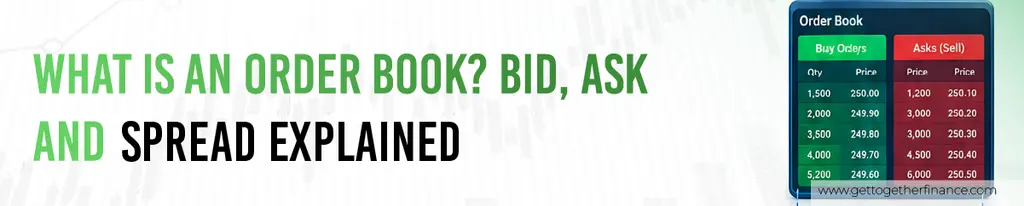
An order book is the full record of buy and sell orders that traders have placed but that have not been matched yet. Every limit order you place waits in this book until someone on the other side agrees to your price. Market depth is simply the top part of that order book, shown to you in a clean and readable way. To read it properly, you need to be comfortable with a few basic terms.
Bid Price and Bid Quantity
The bid is the price a buyer is ready to pay for the stock. Bid quantity is the number of shares that buyers want to buy at that price. If you see a bid of ₹250 with a quantity of 3,000, it means buyers are waiting to purchase 3,000 shares at ₹250. The highest bid on the screen is called the best bid, and it is the price at which you can sell immediately if you choose to.
Ask Price and Ask Quantity
The ask, also called the offer, is the price a seller is ready to accept. Ask quantity is the number of shares that sellers want to sell at that price. So an ask of ₹250.10 with a quantity of 2,000 means sellers are waiting to sell 2,000 shares at ₹250.10. The lowest ask on the screen is the best ask, and it is the price at which you can buy immediately.
What Is the Bid-Ask Spread?

The bid-ask spread is the gap between the best bid and the best ask. In our example, the spread is ₹0.10, which is very small and shows that the stock is actively traded. A tight spread usually means many buyers and sellers are competing, so you lose very little when you enter or exit. A widespread, however, is a quiet warning that the stock is less liquid and that every trade will cost you a bit more. With these terms clear, we can now move on to reading the screen step by step.
How to Read Market Depth Step by Step
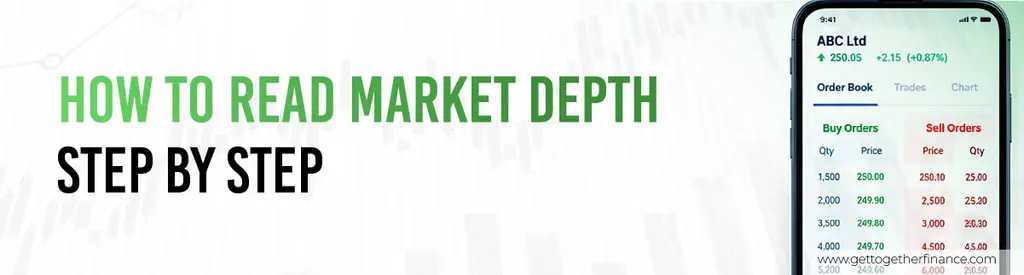
Reading market depth becomes easy once you follow a fixed routine instead of staring at the numbers. Let us use a simple example of a stock called ABC Ltd, which will help us in every step below.
| Buy Quantity | Bid Price (₹) | Ask Price (₹) | Sell Quantity |
| 1,500 | 250.00 | 250.10 | 1,200 |
| 2,200 | 249.95 | 250.15 | 1,800 |
| 3,000 | 249.90 | 250.20 | 2,500 |
| 1,800 | 249.85 | 250.25 | 3,100 |
| 9,000 | 249.80 | 250.30 | 2,000 |
| 17,500 (total) | 10,600 (total) |
Step 1: Check the Best Bid and Best Ask
Start with the first row, because it shows the prices that matter right now. In our table, the best bid is ₹250.00 and the best ask is ₹250.10. This means that if you place a market order to sell, you will most likely get around ₹250.00, and if you place a market order to buy, you will most likely pay around ₹250.10.
Step 2: Measure the Bid-Ask Spread
Next, subtract the best bid from the best ask, which gives a spread of ₹0.10 here. A small spread like this means the stock trades smoothly. Whenever you see the spread getting wider than usual, be careful, because it often means that fewer people are willing to trade at fair prices.
Step 3: Compare Total Buy and Sell Quantity
Now look at the totals at the bottom. ABC Ltd has 17,500 shares on the buy side and 10,600 on the sell side, so buyers are clearly more eager at the moment. This is the first hint of buying pressure, although, as we will see later, it is only a hint and never a promise.
Step 4: Look for Large Orders at Key Price Levels
After that, scan each row for any quantity that looks much bigger than the rest. Here, there is a block of 9,000 shares waiting to buy at ₹249.80, which is far larger than the other bids. Traders often treat such a block as a possible short-term support, since a big buyer sitting there may slow down a fall in price.
Step 5: Watch Whether Orders Are Added or Removed
A single screenshot of market depth tells you very little, so watch it for a minute or two. If buyers keep adding quantity at higher prices, the demand is real and growing. But if that big 9,000 order suddenly disappears when the price comes close to it, then it was never a true support, and you have just saved yourself from a bad trade.
Step 6: Confirm With Price and Volume
Finally, always check what the price and the volume are doing. If market depth shows strong buyers and the price is also rising on healthy volume, the signal is much more reliable. When the depth and the price tell different stories, it is better to wait. Once you can read the screen like this, the next question is how to judge the liquidity of a stock before you trade it.
How to Check Liquidity Using Market Depth?

One of the best uses of market depth in the stock market is to check liquidity before you put your money in. A stock may look attractive on a chart, but if it is hard to sell, you can get stuck at a bad price. Market depth helps you avoid this by showing how much quantity is really available around the current price.
Signs of a Liquid Stock
A liquid stock usually shows a very small bid-ask spread, often just a few paise for large companies. The quantities on both sides are big, and the prices at each level are close to each other, so even a large order can be filled without moving the price much. Another good sign is that the depth refills quickly after someone buys or sells a big lot. Stocks in the Nifty 50 are the best examples of this.
Signs of a Low-Liquidity Stock
A low-liquidity stock looks very different. The spread is wide, the quantities are small, and there may be big gaps between one price level and the next. In such a stock, a single market order can eat through several levels and push the price against you, which is exactly how slippage happens. You may also notice that buy orders sit on one side while the sell side is almost empty, which makes exits difficult. If you must trade such a stock, using a limit order is much safer than a market order, and keeping your quantity small is wise as well. Liquidity matters most for traders who enter and exit within the same day, so let us see how intraday traders use market depth.
How Intraday Traders Use Market Depth?

Intraday trading is all about timing, and a few paise can decide whether a trade ends in profit or loss. That is why many intraday traders keep the market depth window open next to their chart. It does not give them a trade signal on its own, but it helps them understand the mood of the market in that exact moment and manage the overall risk management.
Spotting Buying and Selling Pressure
When buy quantity stays much higher than sell quantity and keeps increasing, it points to buying pressure, because more people want to buy than sell. In the same way, heavy sell quantity with thin buying shows selling pressure. Intraday traders watch how these numbers change along with the price, since a shift in pressure often comes just before a short move.
Short-Term Support and Resistance
Large buy orders sitting below the current price can act as short-term support, while large sell orders sitting above the price can act as short-term resistance. For example, if a stock is trading at ₹500 and a big sell order of 20,000 shares is waiting at ₹502, the price may struggle to cross ₹502 unless that order gets absorbed. These levels are not permanent, but they give a useful idea of where the price may pause during the day.
Reducing Slippage Before You Place an Order
Slippage is the difference between the price you expected and the price at which your order actually got filled. Market depth lets you check, in advance, whether the quantity you want to trade is available at the price you see. If you want to buy 5,000 shares but only 1,000 are available at the best ask, the rest will be filled at higher prices. Knowing this beforehand, you can reduce your quantity, split your order, or place a limit order instead. Of course, buying pressure and selling pressure can also be measured in a more direct way, and that brings us to order book imbalance.
What Is Order Book Imbalance?

Order book imbalance means that the quantity on one side of the order book is clearly larger than the quantity on the other side. It is a simple way of measuring whether demand or supply is stronger at the moment. Traders often compare total buy quantity with total sell quantity and look at how the gap changes over time.
Buy-Side vs Sell-Side Imbalance
A buy-side imbalance happens when buy quantity is much higher than sell quantity, which suggests that buyers are more eager. A sell-side imbalance is the opposite, where sell quantity is much higher and sellers are in control. In our ABC Ltd example, 17,500 shares on the buy side against 10,600 on the sell side is a mild buy-side imbalance. The bigger the gap, the stronger the imbalance looks, but a strong-looking imbalance still needs to be checked against the price.
Does More Buy Quantity Mean the Price Will Rise?
Not always, and this is one of the most common beliefs that new traders get wrong. Orders in the book can be cancelled or changed at any time, and some large orders are placed only to create an impression. A stock can show huge buy quantity and still fall if sellers are aggressively hitting the bids with market orders. So treat the imbalance as one clue among many, and never as a guarantee. The same depth can also look very different depending on the time of the day, which we will cover next.
Market Depth in Different Market Conditions
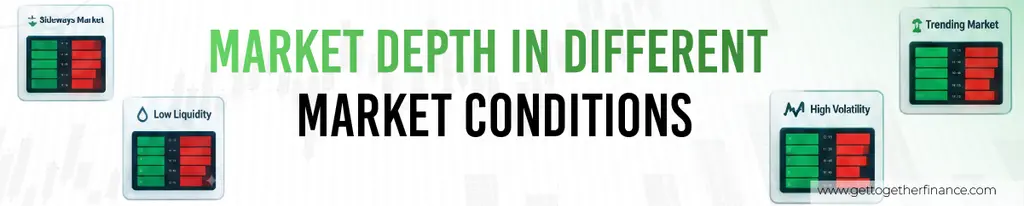
Market depth does not look the same all day, because the number of buyers and sellers keeps changing with the market mood. If you learn how the depth behaves in different situations, you will be less likely to get confused by what you see.
At Market Open
In the first few minutes after the market opens, orders are coming in very fast and prices are jumping around. The depth can look thin or confusing, and the spread is often wider than usual. Many traders therefore prefer to wait a few minutes until the price settles and the order book fills up properly before they trust what market depth is showing.
During High Volatility
When news hits or a stock moves sharply, buyers and sellers become nervous, and many of them cancel their orders. As a result, the depth becomes thin, the spread widens, and even a small order can move the price. This is the time when slippage is highest, so using limit orders and smaller quantities is a much safer approach.
Near Upper and Lower Circuits
Every stock in India has a daily price band, and the exchange stops trading in that direction when the price touches it. When a stock hits the upper circuit, you will usually see a large queue of buy orders and almost no sell orders in the depth. At the lower circuit, the picture is reversed, with a long line of sellers and hardly any buyers. In both cases, it becomes very difficult to trade against the move, so market depth near a circuit is mostly a way of watching the queue, not of finding an easy entry. To see how all of this looks in practice, let us go through a few examples.
Market Depth Example: Reading an Order Book

The numbers below are made up for learning, but they show three situations that you will meet again and again while looking at market depth in the stock market.
Example of Strong Buy-Side Depth
Imagine a stock where the best bid is ₹120.00 with 8,000 shares, and there are two more bid levels with 6,000 and 7,000 shares. On the sell side, the best ask is ₹120.05 with only 1,500 shares. Here, buyers clearly outnumber sellers, and the price has a good chance of moving up if the buyers stay active. A cautious trader would still wait to see whether the buy orders remain in place and whether the volume supports the move.
Example of Strong Sell-Side Depth
Now take a stock where the best ask is ₹80.00 with 15,000 shares waiting, and more large sell orders sit just above it. The buy side shows only 2,000 shares at ₹79.95. This tells us that sellers are heavy, and any attempt to push the price up may fail because each higher level has a wall of supply. In this case, a trader who wanted to buy would probably avoid chasing the price, or would at least wait for the sell orders to reduce.
Example of a Wide Bid-Ask Spread
Finally, picture a small-cap stock with a best bid of ₹45.00 and a best ask of ₹46.00. The spread is ₹1.00, which is more than 2% of the price, and the quantities on both sides are only a few hundred shares. If you buy at ₹46.00 and the price does not move at all, you can sell only at ₹45.00, so you are already down by about 2%. This is why a wide spread is a hidden cost, and why checking it should always be your habit. Even with good examples like these, market depth has clear limits, which we will discuss now.
Limitations of Market Depth and Mistakes to Avoid

Market depth is a helpful tool, but it is not a crystal ball. Most of the losses that traders face with it come from expecting too much from it, so it is worth knowing exactly where it can go wrong.
Orders Can Disappear in a Second
Every order you see in the depth can be changed or cancelled at any moment. A big buy order that looks like strong support may vanish just as the price reaches it, and some traders place large orders only to give a false impression. This is why watching how orders behave over time is more useful than trusting a single snapshot.
Market Depth Shows Orders, Not the Future
Market depth tells you what people want to do right now, but it cannot tell you what will happen in the next five minutes. News, sudden market moves, and big institutional trades can change the picture instantly. For this reason, market depth should always be combined with price action and volume, which show you what traders are actually doing, not just what they are planning to do.
Common Mistakes to Avoid

The first mistake is trading only on the basis of buy and sell quantity, which ignores everything else on the chart.
The second is ignoring the bid-ask spread, even though it is a real cost that comes out of your profit.
The third is treating a large order as guaranteed support or resistance, when it can be cancelled in a second.
The fourth is forgetting the overall market trend, because a strong buy side in a falling market often fails to hold.
If you avoid these four mistakes, you are already ahead of most beginners. Now let us clear up a few common doubts in the FAQs.
Conclusion

Market depth in the stock market is one of the simplest ways to see the real demand and supply behind a price. By checking the best bid and ask, the spread, the buy and sell quantities, and the large orders at key levels, you get a much clearer idea of how easily you can enter and exit a trade. At the same time, remember that orders can change in a second, so always confirm what you see with price action, volume and the overall trend. Start by simply watching the market depth of a few liquid stocks every day, and in a couple of weeks you will notice patterns that no chart alone can show you.
Market Depth FAQs
Here are quick answers to the questions that traders ask most often about market depth in the stock market.

What does 20 market depth mean?
20 market depth means that you can see 20 price levels of buy orders and 20 levels of sell orders, instead of the usual 5. This gives you a deeper view of the order book, so you can spot large orders that sit further away from the current price. Availability depends on your broker, and it is mostly useful for active traders.
What is the difference between market depth and order book?
The order book is the complete list of all pending buy and sell orders for a stock. Market depth is the part of that order book that your trading app shows you, usually the top 5 or 20 levels on each side. So the two terms are closely related, and many people use them in the same sense.
Does market depth predict stock prices?
No, market depth cannot predict prices with certainty. It shows the current demand and supply, but orders can be cancelled and new information can change the picture at any time. It works best as a supporting tool along with price action, volume and the overall market trend.
What does high buy quantity indicate?
High buy quantity indicates that many buyers are waiting to purchase the stock, which can point to buying pressure or possible support. However, it does not guarantee that the price will rise, because those orders can be removed or may never get tested. It is always safer to confirm the signal with the price movement and volume.
Is market depth useful for intraday trading?
Yes, market depth is quite useful for intraday trading, especially for judging liquidity, spotting buying and selling pressure, and reducing slippage. It should not be used alone to take a trade, though. Most intraday traders use it along with charts and volume to decide their entry and exit.