How to Find Stocks for Intraday Trading Using a Real-Time Stock Scanner
- Updated on :
- 13 Views
- by Charul Shakya

 Instagram
 Linkedin
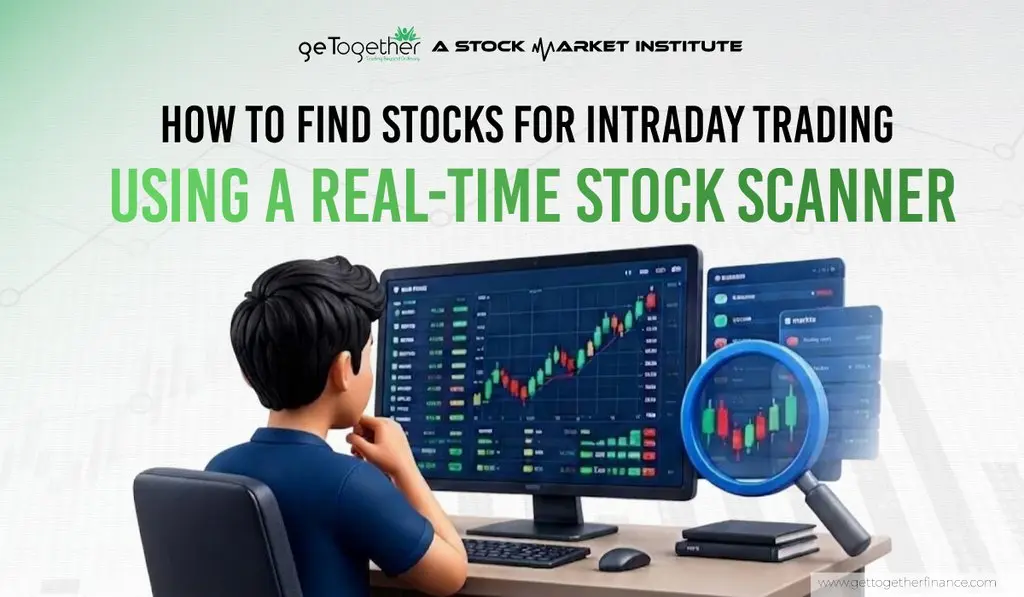
In the market, hundreds of stocks move every day, and checking each one manually takes a lot of time. This makes finding the right stocks for intraday trading difficult. When you finally find a stock that looks interesting, its price may have already moved. An intraday stock scanner simplifies this process. It helps you find stocks based on conditions like volume, price movement, and market activity.
You don’t have to check every stock. Just look at a smaller list that matches your needs. But just because a scanner shows you a stock, you don’t need to jump into the trade. First, look at the chart, understand the market’s direction, and decide how much risk you can take. Let’s learn how to use a real-time stock scanner to find stocks for intraday trading.
What Makes a Stock Suitable for Intraday Trading?

In intraday trading, a stock that shows a big price change is not always the right choice. As intraday traders buy and sell on the same day, they need stocks that are active and moving enough to make the trade worth it. By understanding these qualities, traders can choose the right filters more easily when using a stock scanner.
High Trading Volume and Liquidity
Trading volume shows you how many shares were traded in a given time. When a stock has high trading volume, many people buy and sell it, making it easier to enter or exit a position. This usually means the stock has good liquidity, so it’s easier for traders to buy or sell at their preferred price.
Sufficient Price Volatility
Intraday traders want stocks that move enough in a day to create trading chances. If a stock’s price hardly changes, there are fewer chances to make a trade. But sudden, sharp price changes can be risky too, so it’s better to pick stocks that are easier to understand.
Tight Bid-Ask Spread
The bid-ask spread is the difference between the highest price a buyer will pay and the lowest price a seller will accept. When the gap is small, it’s easier to buy and sell, but when the gap is big, trading can cost you more. That’s why traders need to check the bid-ask spread more carefully.
Clear Intraday Trend or Momentum
Some stocks rise or fall, while others just stay in a range without a clear direction. When a stock’s price moves in a clear direction, it’s easier to understand. Before deciding whether to watch a stock, traders should check its chart to see how the price is moving.
What Is a Real-Time Stock Scanner?
A real-time stock scanner filters stocks based on conditions like market activity, price changes, and trading volume. It helps intraday traders spot stocks worth watching, so they don’t have to check every chart manually. Traders can focus on stocks that match their selected conditions instead of searching the entire market. This saves time and helps traders make a watchlist to study further. But scanner results are only a starting point, so traders should study the charts and see if each stock suits their plan.
How Does an Intraday Stock Scanner Work?
An intraday stock scanner checks stocks against your chosen filters and lists the ones that fit. You can also combine different filters to get a shorter list. For example, if a stock’s volume rises while its price moves above a recent resistance, an intraday scanner with the right filters can help you find it. Then, you can check the chart to see if the move is confirmed or may reverse. The scanner helps you find stocks faster, but it does not tell you when to enter or exit a trade.
Stock Scanner vs Stock Screener: What’s the Difference?
A stock screener usually picks out stocks based on criteria you choose, such as trading activity, price, and company size. An intraday stock scanner pays more attention to live market moves, such as sudden price changes and rising volume.
| Feature | Stock Scanner | Stock Screener |
| Main purpose | Helps you find stocks as the market changes | Shortlists stocks based on selected criteria |
| Common criteria | Fast price moves, rising volume, and live market action | Share price, volume, and market size of the company |
| How it helps | Helps you track stocks that fit your conditions as the market changes | Shows only the stocks that fit your needs |
| Example | Finding stocks with a sudden rise in volume during the day | Finding stocks within a specific price range |
Why Real-Time Data Matters for Intraday Trading
In a trading day, prices can move quickly. That’s why real-time data helps traders keep track of market activity. It allows traders to notice changes as they happen, but they should still look at the chart before deciding to trade. For example, a stock may meet your volume filter early in the day but lose strength later, so updated data helps you track these changes and review your watchlist. But real-time data cannot predict the next move, so always confirm scanner results on the chart and check the risk before you trade.
What Filters Should You Use to Find Intraday Stocks?

The best filters depend on how you trade, how much experience you have, and which stocks you want to trade. When you use an intraday scanner, start with a few filters to find active stocks, and add more only when you need them.
Volume and Relative Volume Filter
Intraday traders can start with the volume filter because it shows how actively a stock is being traded. If a stock trades much more than usual, it may be getting more attention. But traders should also look at its price chart to understand why it is moving.
Liquidity and Price Range Filter
It shows how easily traders can buy or sell a stock. After looking at how actively a stock is traded, use a price filter to pick stocks that match your budget and your plan. But a lower-priced stock isn’t always the better choice, so traders need to consider both liquidity and price movement.
Volatility and ATR Filter
Volatility shows how much a stock’s price goes up and down over time. The Average True Range (ATR) helps traders see how much a stock normally moves in a day, but it can’t tell you if the price will rise or fall. When traders check ATR, it can help them find stocks that move enough, without relying only on big, quick price jumps.
Percentage Price Change and Gap Filter
Percentage price change shows you how much a stock’s price has risen or fallen since the last close. A gap occurs when a stock opens at a much higher or lower price than its previous close, and one of the main reasons behind this is news. A gap does not promise that the price will keep moving in the same direction, so traders should check the chart and volume before a trade.
VWAP Filter and Momentum Filter
VWAP shows the “real” average price most traders paid during the day, based on where most of the buying and selling happened. If a stock’s price is above VWAP, it may be strong, but if it’s below VWAP, it may be weak. Momentum shows how strong a price move is, but traders should check the chart before entering a trade
How to Find Intraday Stocks Before and After Market Opens

By preparing a watchlist before the market opens, you can save a lot of time during trading hours. An intraday stock scanner can help you pick stocks that match your trading conditions, then watch how their prices move after the market opens.
Identify Gap-Up and Gap-Down Stocks Before the Open
If a stock opens above yesterday’s close, it is a gap-up, and if it opens below yesterday’s close, it is a gap-down. The main reason for these gaps is news or a change in investor sentiment. But the price can reverse after the market opens, so add these stocks to your watchlist first. Don’t enter a trade right away.
Check News, Events, and Previous-Day Highs and Lows
Company news and announcements can tell you why a stock is suddenly getting attention. To gauge how strong that interest is, mark yesterday’s high and low, then watch how the price reacts near these levels at the open. Then check the trading volume and the chart to decide whether the move is worth a closer look.
Identify Unusual Volume and Pre-Market Activity
If a stock is traded more than normal, it may mean more people are showing interest in it. Traders can use an intraday stock scanner to find these stocks and check whether the activity continues after the market opens. Different platforms show different pre-market data, so traders should check the volume during regular trading hours to see how active the stock is right now.
Scan High-Volume Stocks After 9:15 AM
Trading in the Indian stock market takes place between 9:15 AM and 3:30 PM IST. As the price can move quickly after the market opens, traders need to check the volume, price direction, and how the stock reacts near important levels before making a decision.
Find Opening Range Breakouts
The opening range is the gap between a stock’s highest and lowest price in the first few minutes of trading. Traders can use n intraday stock scanner to find stocks that break above or below this range with strong volume. Then they can check the chart to see whether the price keeps moving in the same direction.
Track Stocks Above or Below VWAP
VWAP is the average price at which a stock trades during the day, with more weight given to prices with higher volume. If a stock trades above VWAP, it may be strong, while if it trades below VWAP, it may be weak. A trader can use an intraday stock scanner to find these stocks and then analyse them for potential trade setups.
Identify Stocks With Developing Intraday Momentum
Intraday momentum tells you how strong a stock’s price move is in one direction (up or down) during the day. A scanner can help traders find stocks that are being traded more and whose prices are clearly changing. They can then study the chart to check if the price move is still going strong or starting to slow down, before thinking about a trade.
How to Shortlist Intraday Stocks Using Scanner Results

An intraday stock scanner helps you find stocks based on your conditions, but you should check every result before deciding to trade. You need to check the market trend, the stock’s chart, and make sure that your possible profit is bigger than your possible loss.
Check the Overall Market Trend and Relative Strength
Traders should first check whether the overall market is moving up or down, then compare the stock’s movement with the market and its sector. If a stock is going up faster than the market, or going down more sharply, it may be worth a closer look.
Confirm the Setup on the Price Chart
After you check the market, open the stock’s chart and look at how the price is moving and how many shares are being traded. Find a pattern on the chart that is easy to see and matches your strategy. If the price is not going clearly up or down, wait for a better opportunity before you trade.
Mark Important Support and Resistance Levels
Mark key support and resistance levels while studying the chart. Support is a price level where a stock usually stops falling, while resistance is a price level where it usually stops rising. These levels show you where the price might slow down, change direction, or keep going through.
Evaluate Risk-to-Reward Before Entry
After you understand the chart and the key levels, it’s time to check whether the trade is worth the risk. For this, you need to estimate your possible loss and your possible profit before you enter the trade. Setting a stop-loss and a target before you enter is important because it protects you from big losses.
Wait for a Valid Trading Setup
A stock may pass every scanner condition, but that does not mean you must buy or sell it immediately. Traders need to wait until the price shows a clear pattern that fits their trading plan. If the right opportunity does not come, it’s better to skip the trade instead of deciding in a hurry.
Intraday Stock Scanner Setup Examples
An intraday stock scanner can help you find stocks whose prices are moving in many different ways. Here are some examples that help traders use scanner results to find stocks they can study more closely.
High-Volume Momentum
Let’s assume a stock’s price starts to rise, and its trading volume is much bigger than normal. A scanner can help you find it. Then look at the chart to see if the price is moving clearly or is close to resistance. If the price has already gone up a lot, it’s better to wait before you trade.
VWAP Breakout
Imagine a stock was trading below VWAP, and then it moves above VWAP while more people are trading it. You can use a scanner to find this change, then look at the chart and see whether the price holds above VWAP or slips under it again.
Opening Range Breakout
During the first few minutes of trading, a stock sets its high and low, which is called the opening range. When the price moves above that high or below that low while more people are trading, you can use a scanner to catch it. Before considering a trade, traders need to check whether the price continues in that direction.
Gap-Up and Gap-Down With Volume
Sometimes a stock starts the day above or below its last closing price, with higher trading volume. A scanner can show you these stocks, but after that, the price may keep moving in the same direction, or it may change direction.
Which Stocks Should You Avoid for Intraday Trading?
Besides finding stocks to trade, it is also important to know which stocks to avoid. This helps you make better decisions. An intraday stock scanner may show you some stocks that are not a good fit for intraday trading because they have low volume, high trading costs, or unclear price movements.
Low-Volume or Illiquid Stocks
When only a few people trade a stock, it can be hard to buy or sell at the price you want. This may also delay your exit or lead to a less favourable price, so you should check the stock’s trading volume before deciding to trade it.
Stocks With Wide Bid-Ask Spreads
If the gap between the buying price and the selling price is large, trading that stock becomes more expensive. A small price move may not be enough to earn you a profit, so you may earn less from the trade. That’s why it is important to check the spread before adding a stock to your watchlist.
Stocks Without a Clear Trading Setup
Just because a stock appears in a scanner after a big price move, it does not mean you should trade it. If the price move is not clear or does not suit your strategy, be patient and wait for a better trade instead of rushing in.
Common Intraday Stock Scanner Mistakes
An intraday stock scanner helps you find stocks, but using it the wrong way can cause mistakes. By avoiding the mistakes given below, you can make better use of the scanner.
Using Too Many Filters
If you add too many filters, you may get very few results and miss some useful stocks. To avoid this, first use only the filters that matter most to your plan, like volume and price movement. Then, if needed, you can change the filters later to get better results.
Trading Every Stock That Appears in the Scanner
A stock that shows up in the scanner is not always a good trade. Traders should check the chart and see if the price is moving as per their plan before trading. This helps you focus on the right stocks, rather than trading every stock that is listed.
Entering After the Move Has Already Happened
Sometimes the scanner shows a stock late, after the price has already moved sharply. If you enter at this point, you may earn less profit, and the price may start moving in the opposite direction. So, before trading, check whether the stock still gives you a good entry.
Ignoring Risk Management
A stock may match your plan perfectly, but the trade can still end in a loss. That’s why That’s why risk management is important in intraday trading. Traders need to plan their entry price, stop-loss price, and exit price before trading. They should also choose a quantity that is safe to handle.
Conclusion
An intraday stock scanner helps you find stocks that fit your trading needs, so you don’t have to check every stock by yourself. By using filters like volume, price movement, and VWAP, you can make a watchlist of stocks that are worth studying. But finding a stock is just the beginning. You still need to study the chart, mark the key levels, and decide your entry price and stop-loss. Start with just a few filters and pick stocks that fit your plan. Always remember, the scanner only gives you ideas; you still need to check the chart and control your risk before you trade.
FAQ’s
Which scanner is best for intraday trading?
The best intraday stock scanner is different for each trader. It depends on your trading strategy and what you need. Pick a scanner that shows live prices and has filters like volume, price movement, and volatility. This helps you find stocks that are worth studying.
How do I select stocks for intraday trading?
Pick stocks with high volume, good price movement, a small bid-ask spread, and a clear up or down trend. You can use a scanner to make a short list of stocks, then check charts, important price levels, and risk before you enter a trade.
What volume is good for intraday trading?
There is no single volume number that is right for every stock. Pick stocks that many people are trading, and check if today’s volume is higher or lower than normal. If the volume is higher than normal, it may show that more people are interested in the stock.
How many stocks should I track for intraday trading?
Start by watching 5 to 10 stocks, and increase this number later depending on your experience and strategy. Make a small watchlist, as it gives you more time to study each stock’s chart and price moves before you trade.
Can stock scanners predict which stocks will rise?
No, a scanner cannot know which stocks will rise. It only shows you stocks that match your conditions, such as higher volume or price movement.