Bullish Candlestick Patterns: Types, Common Reversals & Trading Strategies
- Updated on : May 23, 2026
- 7859 Views
- by Arun Singh Tanwar

 Facebook
 Instagram
 Youtube
Overview
Trading in the stock market is majorly based on technical analysis. This technical analysis comprises of different skills and attributes. Traders need a strong command or grip on chart analysis, trade theories, and price action to make the right move at the right time. In technical analysis, one of the major skills taught is analyzing candlestick charts and identifying the forming patterns.
Though there are numerous candlestick patterns, they have been categorized well. But, One of the most studied categories is the bullish candlestick patterns. This pattern of the candlestick indicates that the stock is going to see a positive uptrend as the buying pressure is increasing.
What are Bullish Candlestick Patterns?

Bullish candlestick patterns are chart shapes that suggest the price may move upward. These patterns indicate that the buyer takes control, and prices may rise. These patterns are made up of one or more candles and highlight when the market is moving from selling to buying.
In technical analysis, a lot of candlestick chart patterns are involved. One of them is the bullish candlestick patterns. This pattern forecasts the upward movement of stock. Though nothing can be guaranteed with any chart pattern, it just gives an idea or roadmap for the trading strategy. There are several bullish candlestick patterns that can be observed in charts, they all indicate different types of movement. One needs to have in-depth technical knowledge of charts to understand those patterns and predict the movement of stock.
Types of Bullish Candlestick Patterns
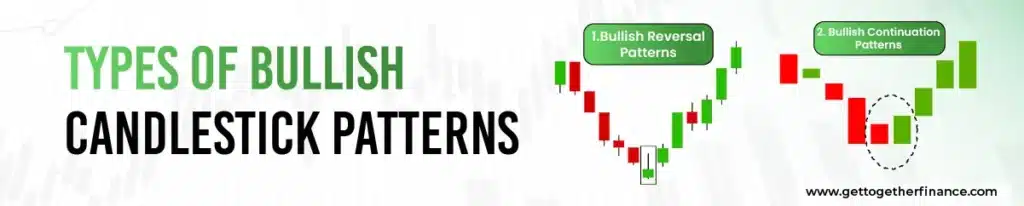
Bullish candlestick patterns are mainly categorised into two types: reversal patterns and continuation patterns. Traders need to understand the difference between these two to know whether the trend will continue or stop.
1. Bullish Reversal Patterns
Bullish reversal patterns are chart patterns that indicate a change in stock price direction from downward to upward. These usually appear when a downtrend is about to end. In this, sellers are losing their strength, and buyers are slowly coming into power.
Why they occur:
- Sellers are running out of power
- The traders started thinking positively instead of negatively
- Buyers start buying when prices are lower
Example: Morning Star, Hammer, Bullish Engulfing,
2. Bullish Continuation Patterns
Bullish continuation patterns are chart formations that signal a stock price tends to keep moving upward after a short rest. They appear when prices are rising but take a small rest or drop a little before going up.
Why they occur:
- Prices pause for a while after a big move
- Several people start buying, which pushes the price higher
- Profit booking or a small correction occurs
Example: Bullish Flag-type structures, Rising Three Methods
Key Insight: Successful traders don’t assume what will happen. They wait for confirmation before entering a trade.
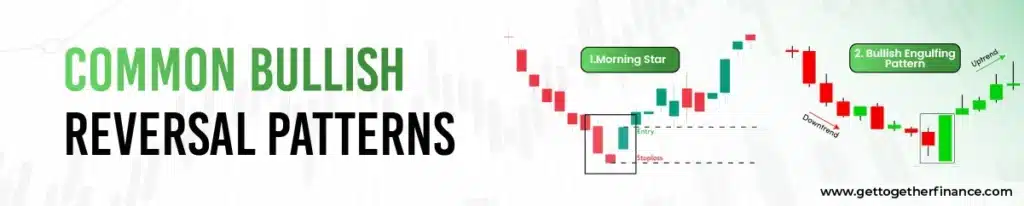
Common Bullish Reversal Patterns
These patterns indicate a potential change from a downtrend to an uptrend. These patterns usually appear after prices go down, which suggests that sellers are losing control and buyers are coming into power.
Below are the well-known bullish reversal patterns given:
Morning Star
The Morning Star is a three-candlestick pattern that shows the price slowly moves from a downtrend to an uptrend. It has:
- A large bearish candle
- A small-bodied candle
- A strong bullish candle
It shows that sellers are losing strength, and buyers step in strongly. Also, the third candle indicates strong buying, which is crucial to confirm the pattern.
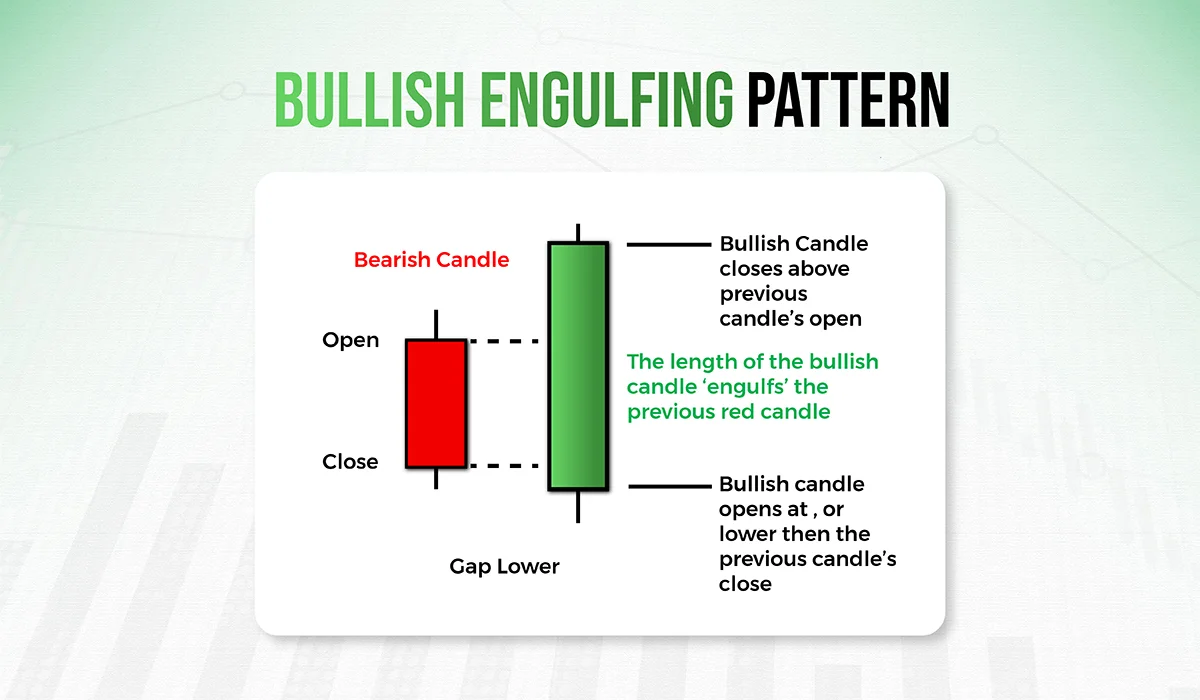
Bullish Engulfing Pattern
This pattern has two candles: a small red candle follows a bigger green candle and fully covers it. A bullish engulfing candle reveals that buyers have taken over from sellers, and the price direction is likely to change. To confirm the signals, traders look for:
- Confirmation from the next candle
- High trading volume during a green candle
- Support level nearby
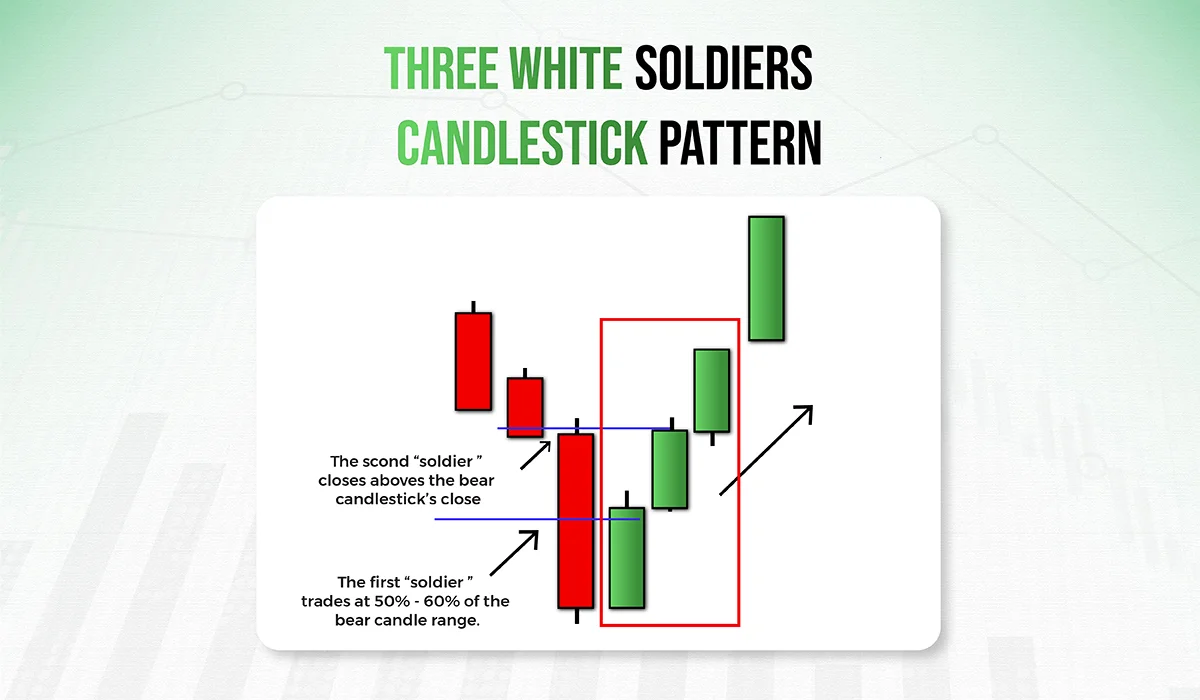
Three White Soldiers
This pattern is made up of three strong green candles that appear one after another. It reveals strong buying after a price drop. In the three white soldier pattern, each candle opens inside the previous candle and closes near its top. These green candles do not have long wicks, instead have a long body indicating positive buying behavior. After moving from the support zone, the formation of three white soldiers can increase the probability of successful trade.
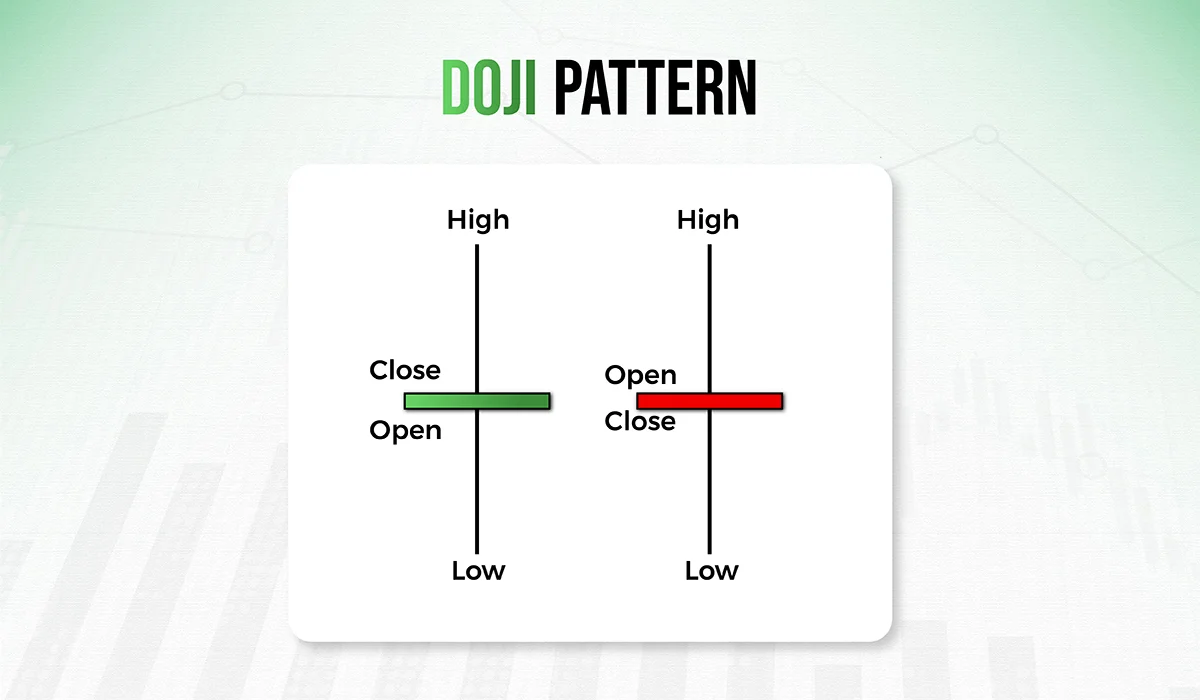
Doji
This pattern of candlesticks has long wicks on both sides and a very small body, indicating the nominal difference between the opening and closing price. A Doji candlestick is a price action pattern that can be found both on support and resistance zones and traded respectively. When this pattern is formed in an uptrend, then the buyers are getting indecisive about selling the stock, thus indicating a reverse trend. Whereas, the opposite can be experienced in a downtrend. Whereas, the Doji pattern is less significant in non-trending markets as it creates indecision for the traders, as markets are not certain during these times time.
Piercing Pattern
The piercing pattern has two candles. The first one is red and moves downward. The second one is a green candle that starts below where the first candle opened, but closes above the middle of the first candle. It indicates that buyers are coming into control after a sharp decline. The higher the green candle closes into the red candle, the stronger it indicates a reversal.
Hammer
The Hammer is a single candle that forms at the lowest part of a downtrend. The candle is small at the top but has a very long tail below it. During that time, sellers struggled to push the price lower, but buyers pushed back and covered most of the losses. Buyers are actively buying at low prices, which suggests prices may increase.
Inverted Hammer
The Inverted Hammer forms when the price goes down. It has a small body and a long tail pointing upward. It signals that buyers tried to push prices higher, but the prices closed near where they started.
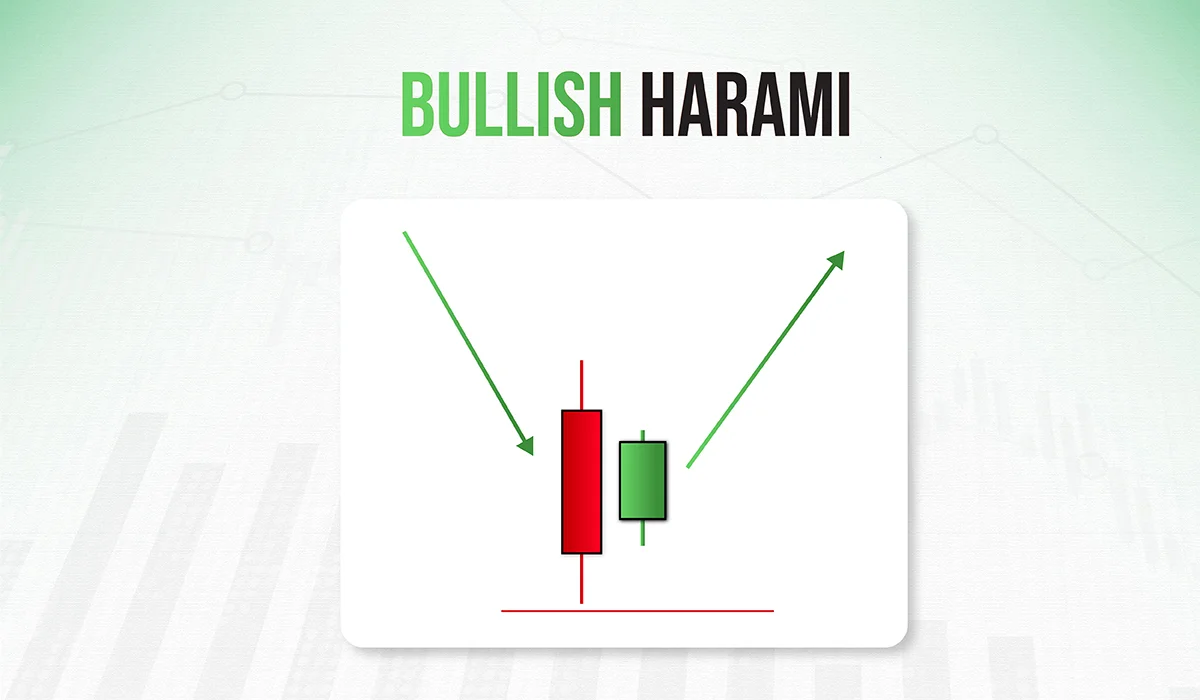
Bullish Harami
It is a candlestick pattern that indicates a reversal of a bearish trend. A green candle is formed after a downtrend. This green candle is smaller than the previous red candle, indicating the reversal trend in the stock movement. Traders take advantage of this bullish candlestick patterns and take entry into the trade, as the price is forecasted to go up after this pattern.
Pros and Cons of Candlestick Patterns

Pros
Visual representation of price movement: The candlestick chart helps in knowing the opening and closing price with the actual movement of the price. It helps in checking what stimulated the price movement.
Signal Confirmation: When combined with other technical trading strategies like price action, and demand and supply candlestick patterns can help in confirming the direction of price.
Market sentiments: Candlestick patterns very well portray the market psychology and sentiments by showcasing the buying and selling patterns
Easy to understand: The basics of candlestick patterns are easy to understand (till advanced technical analysis is not involved) for beginners.
Cons
Subjectivity: Different trader interpret candlestick patterns with varied visions and it may impact their trading if strong strategies are not aligned in their study.
False Signal: The charts are full of false signals. A good eye for top-notch strategies with advanced technical analysis is needed to filter out the best patterns.
Market Noise: There are times when patterns fail because of increased market noise. The manipulation is easy with extreme noise, leading to fair patterns.
How to Trade Bullish Candlestick Patterns?

Trading bullish candlestick patterns is not just about identifying them: it’s about verifying the indicator and implementing the correct strategy. Here is a step‑by‑step guide including breakout, trend‑reversal, and trend‑locating strategies.
Step 1: Identify the Market Context
A trader should always understand the pattern before reacting to it.
- In a downtrend, spot reversal patterns like Hammer, or Bullish Engulfing which may indicate an upward movement
- In an uptrend, spot continuation patterns like Rising Three Methods to follow the ongoing trend
- In a sideways market, it is best to pause and observe: only act when a breakout is confirmed
Step 2: Identify a reliable Bullish Pattern
Let the candle pattern fully develop before taking action. A reliable pattern generally has:
- A full-bodied candle that shows conviction
- A clear formation (e.g., in a bullish engulfing pattern, the green candle fully covers the previous red candle)
- A pattern that forms near the support level is more trustworthy
Step 3: Utilise Breakout Entry Strategy
Just looking at the pattern is not sufficient. It is crucial to wait until the price breaks out before entering.
How to enter:
- Purchase when the price reaches the highest point of the pattern
- This shows buyers are taking control
Example: When a bullish engulfing candle appears, don’t act immediately. Let the next candle cross the high first, then enter.
Step 4: Apply Trend-Reversal Strategy
Here are some steps given for reversal setups that occur after a downtrend
- Make sure the price is falling before you act
- Spot a bullish reversal pattern
- Wait for the price to break above the pattern’s highest point
- Enter trade
- Put your stop-loss just below the lowest recent price
The objective of this step is to hold the trade through the trend and extract the maximum possible profit from the move.
Step 5: Use Trend-Continuation (Trend-Locating) Strategy
Here are some steps given for continuation setups that occur during an uptrend:
- Spot an existing uptrend
- Wait for the price to pause or pull back a little before entering
- Identify a bullish continuation pattern
- Enter the trade when the price breaks above the pattern
The objective of this step is to follow the trend and hold the trade long enough to maximize the profit.
Step 6: Confirm with Volume
Volume is the most crucial tool for confirming a bullish candlestick pattern. A bullish candle with high trading volume indicates strong buying interest. On the other hand, a bullish candle with low volume indicates a weak signal, which increases the chances of a false breakout. If the traders monitor the volume properly, they can distinguish between a real price move and a false one.
Step 7: Use Technical Indicators for Confirmation
Always use a candlestick pattern with indicators for higher accuracy:
- Moving Averages: When the price moves above the 50 EMA, it gives a good signal, and the market rises
- Support & Resistance: Strong support adds strength to any pattern forming near it
- RSI (Relative Strength Index): Look for the RSI to be below 30 before taking a reversal trade
- MACD: A bullish crossover makes the signal stronger and more trustworthy
Using these indicators with candlestick patterns increases traders’ confidence and lowers the risk of false signals.
Step 8: Manage Risk Properly
No setup is perfect. Even strong ones can fail; that’s why risk management is essential:
- Always put your stop-loss just below the lowest point of the pattern to minimise possible losses
- Maintain a risk-reward ratio (at least 1:2) to make sure rewards are greater than risks
- Avoid overtrading and focus only on the best setups because discipline plays an essential role in consistent success
Bottom Line
Candlestick patterns are far more advanced and reliable than the other types of charts in the stock market. The technical analysis of trading is based on candlestick patterns, they showcase the market sentiments along with the price movement. This greatly helps in predicting the further movements of the stock. The bullish candlestick patterns act as signals for traders. They significantly help traders in predicting an uptrend in the stock price. Though, a trader should thoroughly learn about technical analysis from experts to excel in trading.
FAQ
What are candlestick patterns?
Candlestick patterns are price chart formations that represent a financial asset’s open, high, low, and close prices during a given time period. These patterns enable traders to interpret market mood and forecast future price fluctuations.
What makes a candlestick pattern bullish?
A bullish candlestick pattern appears when the closing price exceeds the starting price, indicating purchasing pressure and probable upward momentum in the market.
What is a ‘Hammer’ candlestick pattern?
A Hammer is a bullish reversal pattern with a small body, long lower wick, and little or no upper wick. It shows that selling originally pushed the price lower, but purchasers later pushed it back up, indicating a possible bullish reversal.
How does the ‘Bullish Engulfing’ pattern look and what does it indicate?
A Bullish Engulfing pattern consists of a huge bullish candlestick that totally engulfs the preceding smaller bearish candlestick. It signals a possible bullish turnaround, with strong purchasing demand outweighing earlier selling pressure.
What is the ‘Piercing Line’ candlestick pattern?
The Piercing Line pattern is formed when a bullish candlestick follows a bearish candlestick, opening below the previous candle’s low and closing above its midway. It indicates a potential bullish reversal, or a movement in market sentiment from negative to positive.
Can you describe the ‘Morning Star’ pattern?
The Morning Star is a bullish reversal pattern made up of three candlesticks: a long bearish candlestick, a small-bodied candlestick with a lower low and higher high, and then a long bullish candlestick. It indicates a possible reversal from a downtrend to an uptrend.


