What is Stock Market Volatility? Causes, Types & How to Manage It (2026 Guide)
- Updated on : May 23, 2026
- 3162 Views
- by Arun Singh Tanwar

 Facebook
 Instagram
 Youtube
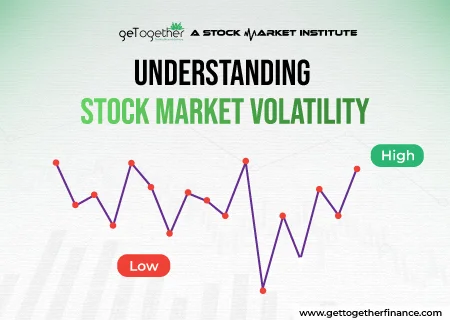
Overview
Stock market volatility carries both exceptional risks and rewards. In high volatile markets, numbers make dramatic movements, whether it is an uptrend or downtrend.
Many might believe that volatility sets the winds, moods, and direction of the market.
The statement holds no truth!
Volatility does not change the mood or direction of the market, rather helps a trader in finding the perfect trading strategy to swim in the market waves.
But how does the concept work, how is it calculated, and what factors drive stock price volatility?
Let’s begin with the basics first.
What Does Volatility Mean in the Stock Market?

When we talk about finance, volatility is the most crucial concept because it helps in measuring how quickly and frequently stock prices fluctuate. Volatility is the rate at which market or stock prices go up and down over a specified period of time. It is calculated by methods like variance or standard deviation, and can be monitored over different time periods such as daily, weekly, monthly, or annually.
In simple words, volatility shows the rises and falls of stock prices in the market. Also, it shows how much risk and instability investors face.
The concept gained popularity when Harry Markowitz introduced it in his study “Portfolio Selection” in 1952. He suggested that the performance of a stock should be judged on the basis of the amount of risk it takes. Also, he used volatility, measured through variance or standard deviation, as a main indicator of risk. Later, Harry Markowitz won the Nobel Prize because of his work and became the foundation of modern investment theory.
High volatility means the price fluctuates quickly, and low volatility means prices change slowly. When the price of a share changes very quickly and by a large amount, it is considered riskier.
For example, If a stock price increases from ₹120 to ₹150 and then suddenly falls to ₹100 within a few days, it indicates volatility.
Types of Stock Market Volatility
When it comes to types, volatility is divided mainly into two parts: historical and implied volatility. Both of these are important to analyze and give in-depth insights to traders, helping them make more informed decisions. Let’s get started and understand this simply:
- Historical Volatility
It is also known as statistical volatility because historical volatility is calculated by using statistical methods based on previous price movements. Historical volatility uses the standard deviation method to measure the difference between earlier and current returns of stocks. It helps investors examine how the stock performed in the past and understand its risk level. If historical volatility is higher, then the price is moving unpredictably, while if it’s lower, then the price is moving calmly. It measures daily price changes over a period of 10 to 180 trading days.
- Implied Volatility (IV)
This type of volatility is also known as projected volatility. Implied volatility is one of the crucial metrics for option trading because it represents what investors expect from the market to do in the future. Also, it directly impacts the option pricing. Implied volatility helps traders understand how much a stock price may move in the future, but it cannot accurately predict.
Unlike historical volatility, which focuses on the past, implied volatility focuses on the current option price and represents traders’ future expectations.
Also Read: Implied Volatility
How is Volatility Calculated?

Aforesaid, a common way to measure stock market volatility is to get the standard deviation of price fluctuations over a specific time period. The calculation allows you to find out the difference of numbers from an average value.
What’s left is another important aspect, which is variance. But what is the formula?
vol = σ√T
In detail:
Volatility = standard deviation of returns ✕ √number of periods in time horizon.
Standard deviations are crucial as they not only reveal how much value may change but also offers a system for the odds it will occur.
Remember, the higher the standard deviation, the higher the rate of movement of the portfolio in either direction.
Example of Volatility
No education is complete without an example. So let’s assume that you want to measure the volatility of a stock over the past five days.
Step 1: Gather Data
List down the closing price of the stock in the last five days. the closing prices of the stock for the past five days.
Day 1: ₹100
Day 2: ₹105
Day 3: ₹98
Day 4: ₹102
Day 5: ₹100
Step 2: Calculate Daily Returns
Find out the daily return by measuring the difference in closing price each day, relative to its previous day close. For example, if the first day closing is ₹100 and second day closing is ₹105, the daily return is estimated at 5%.
Step 3: Calculate Average Daily Return
Find out the average of daily returns to make a pattern in price fluctuations. Add all the daily returns and divide the sum by the number of days. It will help you average your daily return.
Step 4: Calculate Volatility
Calculate the variance of the daily returns. This tells you how much the stock price is changing each day. The higher the variance, the more volatile the stock is.
To get the volatility, take the square root of the variance. This gives you a measure of how much the stock price is likely to change in the future based on its past performance.
What are the Causes of Stock Market Volatility?

Stock Market Volatility is the fundamental part of investing that shows how prices fluctuate. This fluctuation in prices can happen due to numerous reasons, such as economic, global, and others. By understanding the causes of volatility, you can make better decisions and stay prepared if the market becomes uncertain.
- Economic and Macro Factors
It refers to the general circumstances and external forces that impact the overall economy and, in turn, the stock market. These comprise factors such as government policies, inflation, interest rates, global events, economic growth (GDP), and unemployment. Economic and macro factors are the biggest reasons why stock market prices keep fluctuating. If there are changes in these factors, then it affects the corporate performance and investors’ trust.
For example: When inflation or interest rates increase, people and companies spend less money, which decreases a company’s profit. Because of this, investors sell their stocks, leading to a decline in stock prices. Similarly, events like global crises create unpredictability, causing unexpected price swings. Thus, these economic and macro factors resulted in fluctuations in stock prices, which make the market more volatile.
- Company-Specific Events
Events related to a specific company can cause stock market volatility because they directly impact how well that business performs and how investors perceive it. These events include mergers, quarterly earnings reports, major announcements, financial results, and acquisitions, which can lead to unexpected price swings.
For example: If a company earns higher profits, buyers start buying stocks, which leads to an increase in the stock price. On the other hand, if the company does not earn profits, then sellers start selling their stocks, which leads to a decrease in the stock price. Therefore, earnings related to a specific company create quick fluctuations in stock prices and make the market volatile.
- Global Events and Geopolitical Triggers
Political tensions and worldwide events are the main reasons for stock market volatility, because they create unpredictability across the world. These include events, such as pandemics, wars, trade conflicts, or political instability, that can impact investors’ trust and hamper business operations.
For example: During the COVID-19 pandemic, stock markets around the world fell sharply because people were scared and unsure about the future. Similarly, political conflict between countries can affect economic stability, trade, and supply chains. Thus, such events lead to unexpected buying or selling in the market, which causes quick price swings and increased volatility.
How is Stock Market Volatility Measured?
There are so many ways through which stock volatility can be measured. These include standard deviation, beta, and VIX, which show how much and how quickly prices fluctuate. It helps investors to evaluate the level of risk and unstable market conditions. When you analyse price swings by using different indicators, you can make better decisions. Below, the method is explained briefly:
- Standard Deviation
This is the main method that traders use to measure volatility. It is generally denoted by (σ ) and measures how gains or losses of stocks differ from normal returns over a period of time. A higher standard deviation means high volatility, while a lower standard deviation means low volatility. Here’s a formula for standard deviation:

The standard deviation can be calculated by using the following steps:
- Find the mean by adding all the data points together and dividing them by the total data points.
- Find the variance by subtracting each data point from the mean.
- Square each variance and then add them all together.
- Divide the sum of squared variance by one less than the number of data points.
- Find the square root of the variance, which gives you the standard deviation.
Example: An investor is monitoring the company’s stock performance over 5 trading days. The investor wants to know whether the stock is stable or risky by using the standard deviation method.
| Day | Data Points |
| 1 | 4% |
| 2 | 8% |
| 3 | 6% |
| 4 | 10% |
| 5 | 2% |
Step 1: Find the Mean
Add all the data points: 4+8+6+10+2 = 30
Divide by total data points: 30 ÷ 5
Mean = 6%
Step 2: Find the Variance
| Day | Data Points | Data Point − Mean | Variance |
| 1 | 4% | 4 – 6 | -2 |
| 2 | 8% | 8 – 6 | +2 |
| 3 | 6% | 6 – 6 | 0 |
| 4 | 10% | 10 – 6 | 4 |
| 5 | 2% | 2 – 6 | -4 |
Step 3: Square each variance and add them together
| Day | Variance | Squared Variance |
| 1 | -2 | (-2)² = 4 |
| 2 | +2 | (+2)² = 4 |
| 3 | 0 | (0)² = 0 |
| 4 | 4 | (+4)² = 16 |
| 5 | -4 | (-4)² = 16 |
| Sum of Squared Variance 40 | ||
Step 4: Divide by one less than the number of data points
Sum of Squared Variance = 40
Number of data points = 5
One less than data points = 5-1= 4
Variance = 40 ÷ 4 = 10
Step 5: Find the Square Root of the Variance
Variance = 10
Square Root = √10
Standard Deviation = 3.16%
2. Beta
The Beta coefficient shows how much a stock goes up and down as compared to the overall market. It helps investors decide whether the stock is riskier or safer than the market. In simpler words, beta tells you how much a stock reacts when the market moves.
If Beta = 1, then the stock moves exactly like the market. If the market increases or decreases by 1%, the stock will also move by around 1%.
If Beta > 1, then the stock is more unpredictable than the market. The stock goes up and down faster than the market.
If Beta < 1, then the stock is less risky. Also, it moves more slowly and more stably compared to the market.
Example: If a stock has a beta of 1.5, it shows that the stock fluctuates 1.5 times more than the market. So, if the market increases by 10%, the stock tends to rise by 15%. Similarly, if the market falls by 10%, the stock tends to decline by 15%. This means that when the market moves, the stock moves even more.
3. Volatility Index (VIX / India VIX)
The India VIX is known as the “fear index” because it shows the anxiety of investors about the market. This method measures how much volatility is expected in the market in the future. If VIX is high, then it shows increased fear and uncertainty, which leads to higher market fluctuations. If VIX is low, then it shows a stable market with lower risk levels and price swings.
Example: If the volatility index is at 15, it represents a stable market with low market uncertainty. However, if it increases to 30, it indicates high fear and instability. It means that the market is more likely to move than usual, and stock prices will rise or fall quickly.
Is Volatility Always Bad?

No, volatility is not always bad because when it rises, it creates opportunities like short-term trading profit for traders and investors. In high volatile market, prices are moving fast, which can lead to big losses but also big profits. For example, during high volatility, traders buy at low and sell at high, which makes them earn short-term profit.
On the other hand, In low volatile market, prices are moving slowly, which is safer, but you cannot make big profits quickly. Thus, volatility is neither good nor bad; it depends on several factors, such as an investor’s strategy, goals, and risk level. You just need to understand and manage volatility to make informed investment decisions.
Risks and Opportunities in Volatility
Volatility is a part of the stock market that shows how quickly prices fluctuate. While it is risky, but also creates opportunities to earn profit for traders and investors. In order to do successful investing, it is essential to properly understand both the risks and opportunities of volatility.
Risks in Volatility

In the stock market, volatility can cause big losses for traders who buy and sell in the short-term. Also, it makes inventors scared, and because of this, they sell their stocks in panic. When prices constantly fluctuate, it becomes difficult to estimate the future and make better decisions. Additionally, volatility increases risk, which makes the investment more uncertain and affects the overall portfolio.
Opportunities in Volatility

In the stock market, volatility creates multiple opportunities for both traders and investors. It gives traders a chance to buy stocks at low prices and sell them at higher prices. In the highly volatile market, investors can purchase quality stock at a cheaper rate. Additionally, in this market, options become more expensive, which gives traders opportunities to make a profit. Moreover, when prices move strongly, traders can earn huge profits if they buy and sell shares at the right time.
How to Manage Volatility?
As they say, the turbulence tempts you to make whimsical decisions, making the strongest one doubt oneself. During volatile times increase the urge to take actions, whether buying or selling, but in reality, this is the time to review your strategy and trust your place. Such times will test your true risk tolerance and check on your investment strategies.
Best way to face the volatile market is investing in a long-term strategy. Some investors get influenced by slight turbulence due to greed or fear. But as the stock market echoes that growth of the market is inevitable in the long run. The trick is to stay calm in the panic and add more with every dip. Another way to stay safe in the volatile market is owning a diversified portfolio. For example, if your portfolio includes the metal sector, PSU banks, and auto sector. Now due to major global events, the auto sector takes a deep dip, you can still enjoy a green portfolio with other shares you strategically picked.
Some investors suggest hedging during the volatile markets, such as trading options puts or future puts to average their losses without having to sell your shares. A trader might get lost after seeing the market turn red but wise investors believe in transforming risks into opportunities. A little tip – short-term price dip may offer long-term opportunities.
How to Invest During a Volatile Market?
During a volatile market, traders find it difficult to invest. Therefore, they need to stay calm and use strategic approaches instead of making decisions emotionally.
Also, it is essential to diversify your investment across multiple asset classes and sectors in order to lower the risk of losses. When the price goes down, investors can buy quality stocks at cheaper rates, which gives them huge profits in the future.
Additionally, a systematic investment plan (SIP) is one of the best strategies that you can use to invest in a volatile market. Moreover, by regularly monitoring your portfolio and properly allocating the assets, you can stay safe during unpredictable markets.
In A Nutshell
It is completely okay to be concerned by periods of stock market volatility. It is one of the most interesting, valuable, yet scary phases of the market which might make or break your investment, if you choose to enter the market. While this seems tempting to give in to this fear, experts recommend learning technicalities of the stock market and preparing robust risk management and trading strategy to enter and book profit.
FAQs
How much market volatility is normal?
Volatility is inevitable for investors and markets frequently face heightened volatility. As per the observation, in a year, one should plan on seeing average 15% of volatility and 30% drip in once every five years. This is the average volatility and an investor should be able to stomach this if entering the equity market. In general, a bullish market is related with low volatility and a bearish market is calculated with unpredictable price swings, typically found downward.
What is the VIX?
VIX, or the fear index, is one of the most common ways to measure stock market volatility. It measures the expectations of investors and sentiment of the market on the specific stock or market indices. Often VIX aims to measure how much traders expect mood swings in S&P 500 prices in the upcoming month.
What is volatility?
Volatility, in simpler terms, is a rate on which the price fluctuation in the stock or market index occurs. This measures the key factors such as market sentiments (calm/panic), active traders, historical price average, trading volume, liquidity, global factors, etc. to gauge the volatility rate and anticipate the price swings in either direction. Volatility doesn’t claim to identify the potential market direction but helps figure out the potential price behavior.
Is volatility the same as risk?
Volatility often goes with another name, ‘risk’ in the market. However, both have no correlation. According to expert traders, volatility only speaks of significant price movement or signifies stable market vibe. If traded with a strong trading set-up along with good risk management, one can enjoy the high peaks of market waves, despite the direction.
Is volatility good or bad?
There is no good or bad in the stock market as the one who learned the tricks to dive deeper knows how to play with every tide. If you’re a trader with a good strategy and strong risk appetite, it might change the way you see things. For instance, long-term market investors might see it as a bad omen but short-term traders, option traders, or day traders, this is like a pool of opportunities.


