What Is a V-Shaped Recovery? Meaning, Phases, Examples & Investor Strategy
- Updated on : May 23, 2026
- 1075 Views
- by Arun Singh Tanwar

 Facebook
 Instagram
 Youtube
Overview
What if the secret to a strong economy is its ability to bounce back from tough times, just like a rubber ball? This is where the idea of a V-shaped recovery comes in—a pattern that shows hope and strength when economies face downturns. This recovery shape looks like the letter “V,” and it has real-world effects that can influence our financial futures. Knowing what makes V-shaped recoveries tick is important for government leaders, investors, and businesses, as it can guide their choices during uncertain times. In this blog, we will explore the definition, characteristics, and real-world examples of V-shaped recoveries, highlighting their importance.
What Is a V-Shaped Recovery?
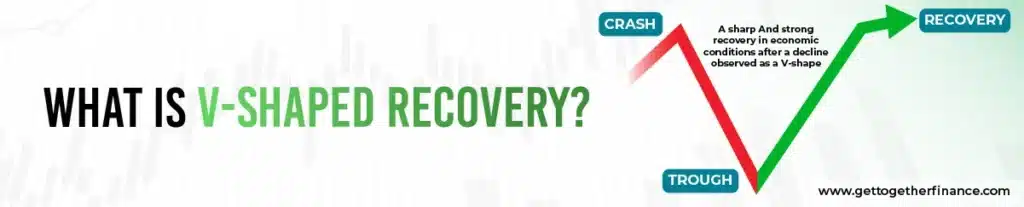
A V-shaped recovery is when the economy or the stock market falls sharply and then rises back up just as quickly. On a chart, it literally looks like the letter “V,” a steep drop followed by a steep rise. It is considered the best kind of recovery because it means the damage did not last long. The economy went down fast, hit a low point, and then came right back up, getting back to where it was before the crisis.
Now, what kinds of things cause this sharp drop in the first place? Usually, it is something sudden and unexpected, like a pandemic, a war, or a natural disaster. These events shake up things like:
- How much the country is producing and earning (GDP)
- How many people have jobs (Employment Rates)
- How the stock market is doing (Stock Market Indexes)
- How much people are earning (Income Levels)
- How many goods factories are making (Manufacturing Output)
- How much people are buying in shops (Retail Sales)
When these numbers fall suddenly and then recover just as fast, you are looking at a V-shaped recovery.
How Does a V-Shaped Recovery Form?
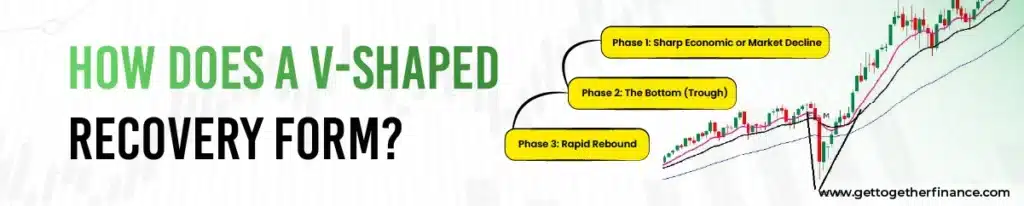
A V-shaped recovery does not just happen all at once. It goes through three clear stages. Understanding these stages helps you see where the economy is in the cycle and what might come next.
Phase 1: Sharp Economic or Market Decline
This is the left side of the V—the fall. Something bad happens suddenly. Factories shut down. People lose jobs. Stock prices drop. Companies stop hiring. Everyone gets scared and pulls back.
This fall is usually fast. It is not a slow slide; it is a steep drop. That is one of the things that makes a V-shaped recovery different from other types. The fall happens quickly, which sets the stage for a quick recovery, too.
Phase 2: The Bottom (Trough)
This is the lowest point, the very bottom of the V. It is the moment when things stop getting worse. The selling in the stock market slows down. Businesses start figuring out how to survive. People start waiting to see what happens next.
This phase can be short, sometimes just a few days or weeks in the stock market or a few months in the broader economy. Spotting this bottom is really important for investors, because this is where the opportunity starts.
Phase 3: Rapid Rebound
This is the right side of the V, the bounce back. And this is the part that makes a V-shaped recovery so exciting. Things start moving up fast. Markets rally. Businesses reopen. People start spending again. Jobs come back.
This rebound is usually driven by government support, cheaper loans, and people feeling hopeful again. The faster and stronger this bounce, the more it earns the name V-shaped recovery.
Key Characteristics of a V-Shaped Recovery
Not every market bounce is a true V-shaped recovery. Here is what makes it different from just a temporary jump in prices:
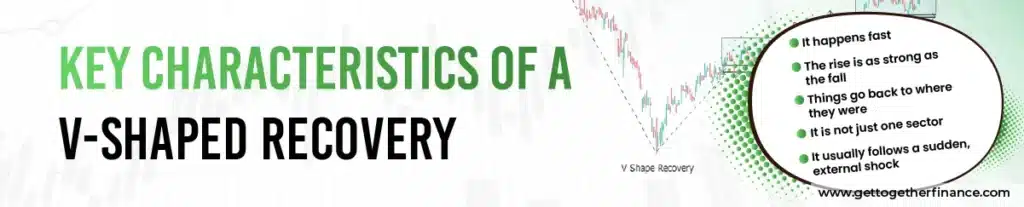
It happens fast. The economy does not stay down for long. It falls, hits a low, and climbs back up without sitting at the bottom for months or years.
The rise is as strong as the fall. If the drop was steep, the recovery is steep too. A slow, gentle climb after a sharp crash is not a V-shaped recovery.
Things go back to where they were. A proper V-shaped recovery means the economy or market gets back to its old levels or even higher. A partial bounce does not count.
It is not just one sector. A real V-shaped recovery is visible across the whole economy, not just in tech stocks or one industry.
V-shaped recoveries happen most often when the problem was caused by something temporary from outside, like a pandemic, not a deep, long-term problem in the economy itself.
V-Shaped Recovery vs Other Recovery Patterns
When the economy takes a hit, it does not always come back the same way. Here is how a V-shaped recovery compares to the other common patterns you will hear about.
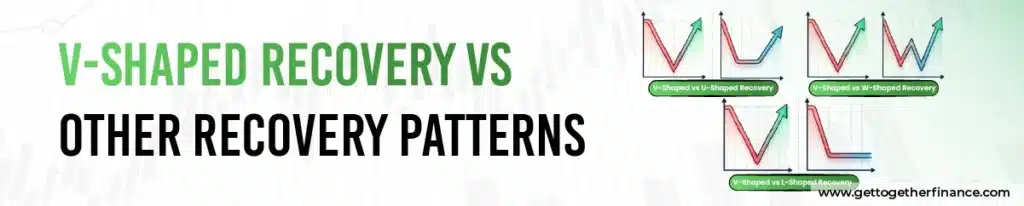
V-Shaped vs U-Shaped Recovery
A U-shaped recovery also has a sharp fall, but the difference is what happens next. Instead of bouncing straight back up, the economy stays stuck at the bottom for a long time before slowly recovering. It looks like the letter “U” has a rounded bottom, not pointed.
The 2008 global financial crisis is a good example of this. The economy fell hard, took years to stabilise, and only gradually came back. That is a U-shaped recovery, much slower and more painful than a V-shaped one.
V-Shaped vs W-Shaped Recovery
A W-shaped recovery is sometimes called a double-dip recession. What happens here is that the economy looks like it is doing a V-shaped recovery, it falls, bounces back and then falls again before making a full recovery. The chart ends up looking like the letter “W.”
This can catch investors off guard. They think the worst is over, put money back into the market, and then get hit by a second wave of losses. This is why it is important not to assume a V-shaped recovery is happening until there is strong evidence behind it.
V-Shaped vs L-Shaped Recovery
The L-shaped recovery is the worst case. The economy falls sharply and then stays flat for a very, very long time, sometimes years or even a decade. There is no real recovery, things just do not get back to where they were. It looks like the letter “L.”
Japan went through something like this in the 1990s, often called the “Lost Decade.” A V-shaped recovery is basically the opposite of an L-shaped one. One means hope and a quick bounce; the other means a long, difficult road with no clear end.
Real-World Examples of V-Shaped Recovery
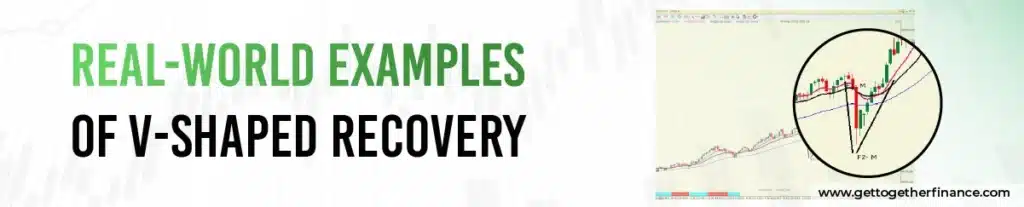
Indian Stock Market V-Shaped Recovery After COVID-19 (2020)
The clearest and most recent example of a V-shaped recovery in India happened during the COVID-19 pandemic in 2020. In March 2020, when lockdowns were announced across the country, the BSE Sensex crashed badly. It lost more than 8,000 points and fell to around 25,000 points by the end of March. For many investors, it was a scary and confusing time.
But then something remarkable happened. The market did not stay down. It started climbing. And by December 2020, just nine months later, the Sensex had crossed 47,000 points. That is a V-shaped recovery in plain sight.
What made this happen so fast?
- Lockdowns were lifted. As restrictions eased, shops, factories, and offices reopened. Life slowly came back to normal, and so did business.
- The RBI stepped in. The Reserve Bank of India cut interest rates and made loans easier to get. This gave businesses the breathing room they needed.
- The government helped. Stimulus packages and financial support kept many businesses and workers going during the tough months.
- Vaccine news gave people hope. When news came that vaccines were being developed, investor confidence came back quickly.
- More people started investing. A surge of retail investors entered the market during and after the lockdown, adding fuel to the recovery.
This is a perfect example of a V-shaped recovery: a hard fall, followed by a fast and strong bounce back.
Global Examples of V-Shaped Recoveries
India was not the only country to see a V-shaped recovery after COVID-19. It happened in many parts of the world:
- United States: The US economy shrank sharply in early 2020, but bounced back strongly by mid-2020, supported by large government relief packages and fast action from the Federal Reserve. The S&P 500 stock index hit an all-time high by August 2020.
- China: China was the first country to feel the COVID-19 shock and the first to come out of it. After a sharp drop in early 2020, China’s economy bounced back strongly by the second quarter of the year, making it one of the earliest V-shaped recoveries globally.
- Post-9/11 US Market (2001): After the September 11 attacks, US markets fell sharply on fear and uncertainty, but within weeks, buyers came back in, and markets recovered quickly, showing a shorter but clear V-shaped recovery.
What Causes a V-Shaped Recovery?
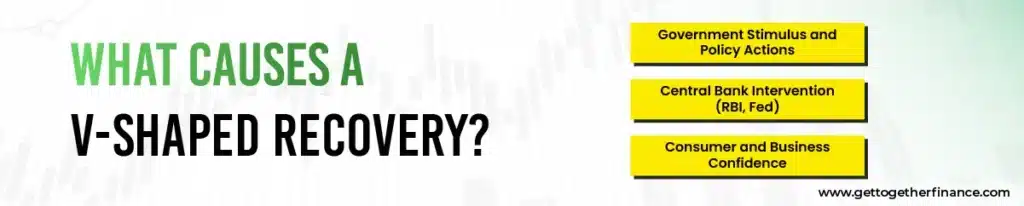
A V-shaped recovery does not just happen by chance. Certain things need to fall into place to make the bounce as fast and strong as it is.
Government Stimulus and Policy Actions
When the economy is falling fast, governments often step in with money. This can look like direct cash payments to people, cheaper loans for businesses, or big spending on roads and infrastructure. The idea is simple if people and businesses have money to spend, the economy keeps moving.
This kind of government support is often what turns a potential L-shaped recovery into a V-shaped one. The bigger and faster the support, the better the chances of a quick bounce. The COVID-19 relief packages seen in India and around the world in 2020 are a great example of how government action can make a V-shaped recovery possible.
Central Bank Intervention (RBI, Fed)
Central banks like the RBI in India or the Federal Reserve in the US play a big role in a V-shaped recovery, too. When they cut interest rates, borrowing becomes cheaper. Businesses can take loans more easily. People can get home loans or car loans without paying too much in interest.
Central banks can also pump money into the financial system directly, making sure banks have enough to lend out. All of this keeps things moving and helps the economy and markets bounce back faster. During COVID-19, both the RBI and the Fed acted quickly, and that speed was a big reason why the V-shaped recovery happened as fast as it did.
Consumer and Business Confidence
Here is something that does not always make it into economics textbooks, but is just as important as how people feel.
If people think things are going to get better, they start spending. Businesses start hiring. Investors start buying. And when everyone starts doing this at the same time, the economy actually does get better. Confidence becomes its own engine.
Vaccine news, falling case numbers, easing restrictions, these things change how people feel. And when they feel better, they act differently. That change in behaviour is often what gives a V-shaped recovery its final push.
How to Identify a V-Shaped Recovery Using Technical Indicators?
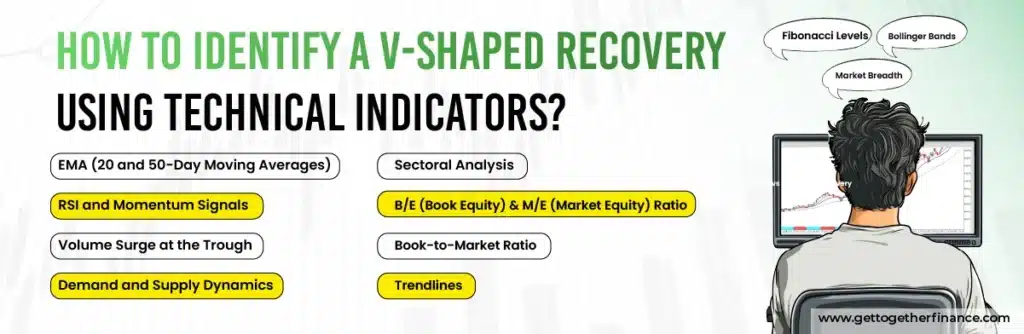
If you invest in stocks or are just trying to understand what is happening in the market, these indicators can help you spot a V-shaped recovery before it fully plays out.
EMA (20 and 50-Day Moving Averages)
EMA stands for Exponential Moving Average. Think of it as a running average of a stock’s price over the last 20 or 50 days, with more importance given to recent prices. During a V-shaped recovery, one of the first signs is when the 20-day average line crosses above the 50-day average line. This is called a “golden cross”, and it tells you that the short-term trend is now going up, a good early sign of a V-shaped recovery beginning.
RSI and Momentum Signals
RSI stands for Relative Strength Index. It is a number between 0 and 100 that tells you whether a stock or market has been sold too much (oversold) or bought too much (overbought).
When the RSI drops below 30, it usually means the market has been beaten down too hard and a bounce is likely. In a V-shaped recovery, you will often see the RSI fall well below 30 during the crash, and then start rising quickly as the recovery begins. That sharp rise in RSI is a good signal that the V-shaped recovery is underway.
Volume Surge at the Trough
Volume is simply how many shares are being bought and sold in a day. When you see a sudden spike in volume during a market crash, especially at the lowest point, it often means big investors are stepping in and buying. In a V-shaped recovery, this volume surge at the bottom is an important signal. As the recovery picks up, you want to see more buying volume on the days when prices go up that shows there is real interest and momentum behind the bounce, not just noise.
Demand and Supply Dynamics
Every market has price levels where a lot of buyers or sellers tend to show up. These are called demand zones (where buyers come in) and supply zones (where sellers tend to sell). When the market drops hard and hits a demand zone, a level where buyers have historically stepped in, there is a good chance the V-shaped recovery starts from there. Traders who look at weekly or daily charts can spot these zones and watch for signs of the bounce beginning.
Sectoral Analysis
When a V-shaped recovery begins, not all industries recover at the same speed. Some sectors bounce back faster than others.
For example, after COVID-19, technology and pharma stocks bounced back quickly in India, well before banking or real estate. If you notice a few key sectors starting to climb while others are still flat, that can be an early sign that a V-shaped recovery is starting in those areas. Watching which sectors are leading the recovery helps you find the best opportunities.
B/E (Book Equity) & M/E (Market Equity) Ratio
These ratios help you see whether a stock is cheap compared to what the company is actually worth on paper. During a market crash, many good companies see their stock prices fall much lower than their actual value. A high Book Equity compared to Market Equity means the stock might be priced too low and could bounce back sharply in a V-shaped recovery. Value investors often look for this kind of gap when trying to spot recovery opportunities.
Book-to-Market Ratio
This works in a similar way. It compares what a company is worth according to its books versus what the market is currently valuing it at.
A high Book-to-Market ratio during a downturn often means the stock is being sold at a discount. These stocks tend to bounce back hard during a V-shaped recovery, making them worth keeping an eye on when markets are falling.
Trendlines
A trendline is just a line you draw on a chart along the series of highs during a fall, or the series of lows during a rise. When the market is falling, you get a downward trendline.
When the market price breaks above that falling trendline, especially with good volume, it is a simple but powerful sign that the direction has changed. In a V-shaped recovery, this breakout above the trendline often marks the beginning of the strong upside move.
Fibonacci Levels
Fibonacci levels are specific percentage levels like 38.2%, 50%, and 61.8% that traders use to predict where a falling market might pause or reverse.
In a V-shaped recovery, markets often stop falling right at these levels and then bounce back strongly. If you see the market drop to a 50% or 61.8% Fibonacci level and then show signs of turning around, it could be an early signal that the bottom is in and the V-shaped recovery is starting.
Bollinger Bands
Bollinger Bands are three lines on a chart: a middle line showing the average price and two outer lines showing how far the price has moved from that average. When the market is very volatile, the outer lines move further apart.
During a sharp crash, prices often fall well below the lower Bollinger Band. That is an extreme reading. The market has moved much further than usual. When prices start coming back inside the bands after this extreme fall, it is often a sign that the panic is over and a V-shaped recovery may be beginning.
Market Breadth
Market breadth is about asking whether most stocks are going up, or just a few? During a crash, almost everything falls together. But as a V-shaped recovery begins, you start to see more and more stocks turning upward.
When the majority of stocks are rising, not just the biggest names, it tells you the V-shaped recovery is broad and real. If only a handful of large stocks are going up while most others are still falling, the recovery might not be as solid as it looks.
How Investors Can Trade or Prepare for a V-Shaped Recovery?
Spotting a V-shaped recovery early can create real opportunities, but it also requires patience and discipline, because not every sharp bounce becomes a full recovery. Here are some practical ways to think about it:
Watch for panic-selling signals first. Before a V-shaped recovery begins, there is usually a phase of extreme fear, heavy selling, rapidly falling prices, very high volume, and RSI deep in oversold territory. When you see multiple signs of panic all at once, it is worth paying close attention to whether a bottom might be forming.
Do not put everything in at once. Instead of waiting for full certainty and missing the early move or jumping in all at once too early, build your position slowly. Start small, and add more as the signs of a V-shaped recovery become clearer.
Stick to strong companies and leading sectors. During a V-shaped recovery, companies with less debt, solid earnings, and a strong position in their market tend to bounce back the most. So do the sectors that lead the recovery. Focus there first.
Use the EMA crossover and RSI as timing tools. When the 20-day EMA crosses above the 50-day EMA, and RSI starts rising from below 30, those two signals together tell you the market momentum has shifted. That is a good point to get more confident about the V-shaped recovery being underway.
Always have a plan if things go wrong. Not every promising bounce becomes a full V-shaped recovery. Sometimes it turns into a W or falls to new lows. Decide in advance at what price you will exit if the trade does not work out. This protects your money if the recovery does not materialise the way you expected.
Keep an eye on the big news. V-shaped recoveries tend to be pushed forward by big announcements, interest rate cuts, government aid packages, vaccine approvals, or major policy changes. Staying aware of what is happening at the macro level helps you understand whether the conditions for a V-shaped recovery are in place or not.
Limitations and Risks of Assuming a V-Shaped Recovery
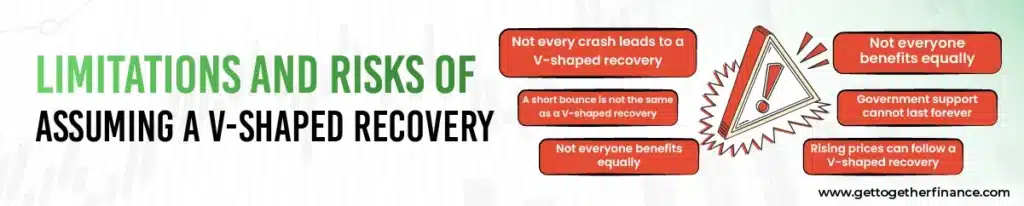
A V-shaped recovery is a great outcome, but assuming one will happen just because the market bounced can be a costly mistake.
Not every crash leads to a V-shaped recovery
If the economy has deep, long-term problems like a broken banking system, too much debt, or a structural shift in how the economy works, the recovery will likely be slower. The 2008 financial crisis is a reminder of that. Many people expected a V-shaped recovery back then and were surprised by how long it actually took.
A short bounce is not the same as a V-shaped recovery
After a big crash, markets often jump up briefly before falling again. This is called a “dead cat bounce,” and it looks like the start of a V-shaped recovery, but it is not. Jumping in too early based on this can lead to losses when the market drops again.
Government support cannot last forever
Some V-shaped recoveries happen mostly because of stimulus money and cheap loans, not because the economy is truly back on its feet. When that support is reduced or removed, problems can come back. A V-shaped recovery built on stimulus alone may not hold.
Not everyone benefits equally
Even when the market shows a V-shaped recovery, it does not mean everyone’s financial situation recovers the same way. Some sectors bounce back fast, while others stay struggling. Some investors do very well, while others miss out completely. This uneven recovery, sometimes called a K-shaped recovery, can hide behind the headline numbers of a broader V-shaped recovery.
Rising prices can follow a V-shaped recovery
When the government spends a lot, and interest rates are kept low to support a V-shaped recovery, prices in the economy can start going up; this is inflation. After COVID-19, inflation rose significantly in many countries. Investors need to be aware that a V-shaped recovery can sometimes be followed by a period of rising costs.
Conclusion
To wrap up, it’s important to note that the economy is in what many expect to be a V-shaped recovery after the recession caused by the COVID-19 pandemic. The pandemic led to travel restrictions, the closure of non-essential businesses, and social distancing measures, all of which have significantly impacted the economy, including stock market and global businesses.
However, efforts by governments around the world are showing signs of a quick recovery, with the second half of the “V” starting to take shape. While 2021-22 may mark a strong recovery, the exact path of the economy is still uncertain.
FAQs

Are V-shaped recoveries common?
They are relatively rare, as not all economies can bounce back quickly from a downturn. The specific conditions needed for a V-shaped recovery don’t always align.
Is a V-shaped recovery sustainable?
While the initial recovery can be strong, sustaining it depends on underlying economic fundamentals, such as consumer confidence and business investment.
Can a V-shaped recovery lead to inflation?
Yes, if demand rebounds too quickly while supply lags, it can lead to inflationary pressures.
Can a V-shaped recovery be predicted?
It’s difficult to predict with certainty, but economists look for signs like strong policy responses and resilient economic fundamentals.


