
Sideways Market: What It Is, How to Identify & Trade It Profitably
- Updated on : August 11, 2026
- 2482 Views
- by Manaswi Agarwal

 Instagram
 Linkedin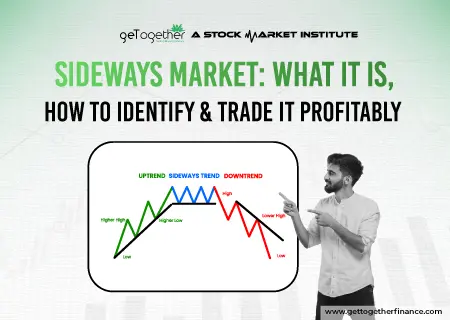
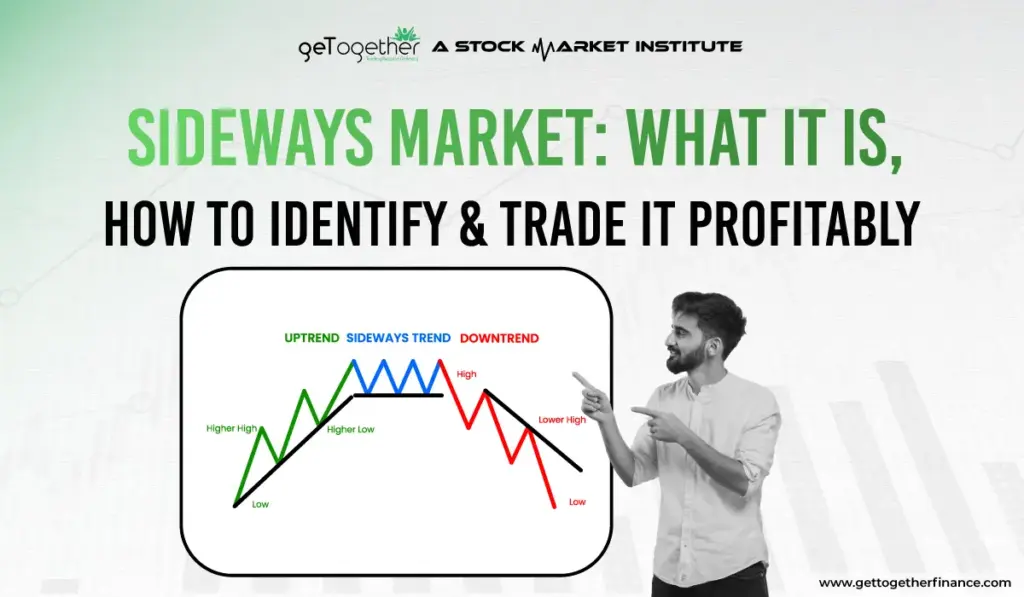
In the world of financial markets or trading, you must have heard someone saying “today’s market was trending”, “there was not much movement in the market today”. Both the situations describe the trend of the market for that particular trading session. When the market shows a trend, it can be either bullish or bearish, in the other case, the market is sideways.
What is Sideways Market?

A sideways market is a phenomenon that takes place when the prices of securities fluctuate between a fixed range for an extended period. The price follows a sideways trend where the range of a security is fixed which it cannot break. Basically, this is described by a move which falls in between the support and resistance levels within which the price oscillates.
Sideways market impacts traders psychologically as it can be quite confusing and frustrating as the market lacks to give a move in a single direction. In a trending market, the prices tend to follow a single direction either upwards or downwards. The price continues to move in the trend by breaking small support or resistance levels, however, for an extended period it moves in a single direction.
Characteristics of a Sideways Market: 4 Key Signs

Many unique features of the sideways market make it different from an uptrend or a downtrend. When traders recognize these characteristics, they can adjust their strategies and avoid making investment decisions based on deceptive market movements.
1. Limited Price Movement Within a Defined Range
A sideways market occurs when prices fluctuate within a defined range, moving between support and resistance levels instead of showing a clear trend.
- Support is the level where prices stop declining
- Resistance is the level at which prices stop increasing
- The market is continuously moving between these two levels without forming a clear trend
2. Market Indecisiveness: Buyers and Sellers in Balance
A sideways market occurs when both buyers and sellers have the same strength, which keeps prices within a range.
- Buyers prevent prices from falling further
- Sellers prevent prices from rising further
- Because of this, the market does not move strongly up or down
This usually happens when traders wait for new information before entering trades.
3. Low to Moderate Trading Volume
When the market is lower in a sideways market than in a strong uptrend or downtrend.
- There is no strong buying or selling pressure in the market
- Prices do not move much
- Fewer traders actively participate in the market
If trading volume rises sharply, it indicates that a breakout is coming.
4. Duration: How Long Can a Sideways Market Last?
There is no fixed time for a sideways market. The market can remain stable within a certain range for days, weeks, or months. Some common reasons are:
- Lack of strong buying or selling pressure
- Uncertainty in the economy
- Mixed investor sentiment
- Major news or events approaching
Best Technical Indicators for Sideways Market Trading

It is very difficult to trade a sideways market because there is no clear direction for price movements. Technical indicators can help traders decide when to buy and sell in a sideways market.
1. Relative Strength Index (RSI)
RSI is an indicator that traders use to spot potential buying and selling opportunities.
- When RSI rises above 70, the asset may be overbought, and the price could decline
- When RSI falls below 30, the asset may be oversold, and the price could increase
- Several traders look for buying opportunities at low RSI levels and selling opportunities at high RSI levels
In a sideways market, RSI performs well because prices stay within a range.
2. Bollinger Bands
This indicator helps traders track price movements and measure market volatility.
- The price may move down after touching the upper band
- The price may move up after reaching the lower band
- When the bands become narrow, it means that the market is quiet, and a breakout is about to happen
Many traders rely on Bollinger Bands to find entry and exit points when prices move within a range
3. Stochastic Oscillator
This indicator shows if a stock is close to the top or bottom of its recent price range.
- If the indicator is above 80, the asset may be overbought and could move lower.
- If the indicator is below 20, the asset may be oversold and could move higher
- A crossover may indicate a possible buy or sell signal
The stochastic oscillator helps traders when prices move within a range.
4. Support and Resistance Levels
These levels help traders decide when to buy and sell in a sideways market.
- Support is a level where buyers come in and prevent the price from dropping further
- Resistance is a level where sellers come in and prevent the price from increasing further
- Many traders seek to buy when prices are near the support level and sell when prices are near the resistance level
These levels make it easier for traders to find buying and selling opportunities.
5. Average Directional Index (ADX)
ADX shows the strength of a market trend.
- When ADX is below 25, the market has a weak trend or is moving sideways
- When ADX rises above 25, it may indicate the beginning of a new trend
Traders use ADX to spot sideways market conditions before making range-based trades.
Moving Averages in Sideways Markets
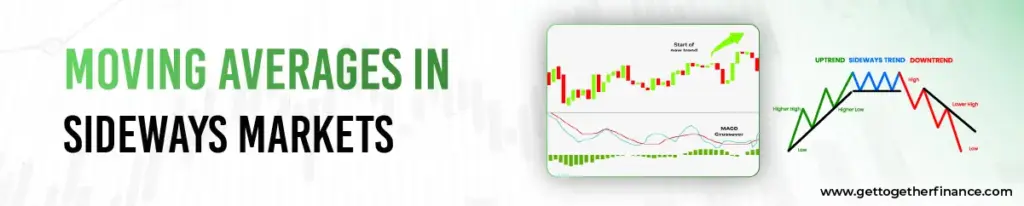
Traders use moving averages to spot trends. In a sideways market, the EMA remains flat because prices are staying within a range.
- The EMA moves sideways instead of up or down
- Prices often move up and down around the EMA
- There is weak buying and selling pressure in the market
How to Read Flat EMAs
When the EMA is flat, it means the market is not clearly going up or down, and prices are moving within a range. Traders use it to stay away from false signals and trade in sideways markets. After understanding flat EMAs, it becomes easier for them to detect price zones for buying and selling.
1. EMA Has No Clear Direction: When the EMA is flat, it means that the market is neither strongly going up nor down. Prices move around the EMA without forming a strong direction.
2. Frequent Price Crossings: In this, prices cross the EMA again and again, which shows that the market is uncertain and has no clear trend.
3. Sideways or Range Market Signal: A flat EMA signals that there is no strong trend, and prices are moving within support and resistance levels.
4. Low-Momentum Market: When the EMA is flat, it shows that the market has weak momentum and price moves slowly.
Bollinger Bands
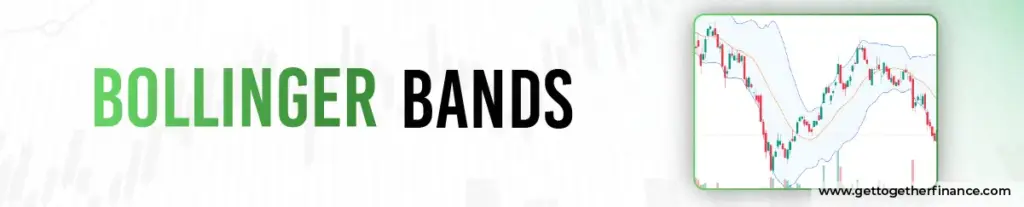
Bollinger Bands are a common tool that traders use to measure price ranges and market volatility. They show when prices are stable and when a strong move may be coming.
Bollinger Bands include three lines:
- A middle line (moving average)
- An upper band
- A lower band
Also, these bands change their size based on how much prices move.
In order to identify two vital market conditions: spotting consolidation and breakout zones, traders use Bollinger Bands. By understanding these signals, they can spot potential trading opportunities.
Spotting Consolidation
When the market moves sideways, Bollinger Bands get closer to each other, which shows low volatility. During this period, price movement is small, and market activity is low. This situation is called consolidation, where the market pauses or rests before a bigger move.
Breakout Zones
A breakout happens when the price moves out of its normal range. During this time, Bollinger Bands start getting wider, which shows that price movement is increasing. When the prices break above or below the bands with strong volume, it shows that market activity has increased, and a new trend could begin.
How to Trade in a Sideways Market: 3 Practical Strategies

A sideways market is one where the price moves within a set range instead of in a clear upward or downward direction. Under these conditions, traders gain preferences for range-bound and breakout strategies rather than trend-following approaches.
1. Observe and Map the Support-Resistance Range
First, traders need to spot the trading range. Support is the level where fewer people want to sell, and it makes the price stop declining. While resistance is the level where fewer people want to buy, and it makes the price stop climbing. After marking these levels, traders plan their trades by buying near support and selling near resistance. This allows them to make a profit from the price that continuously fluctuates within the same range.
2. Watch for Breakout Points with Volume Confirmation
When the price stops moving sideways and starts moving consistently in one direction, it is referred to as a breakout. Traders confirm a breakout through volume; if volume is high during the move, it indicates that the breakout will continue. This helps them weed out false breakouts and make more accurate trading decisions.
3. Placing Stop-Loss Orders in Sideways Markets
In sideways markets, risk management plays a crucial role because misleading price movements are very common. When buying, traders place their stop-loss just below support, and when selling, they place it just above resistance. This reduces losses in case the price suddenly moves against the trade.
Advantages and Limitations of Trading the Sideways Market

Sideways markets appear calm, but they still give trading opportunities for active traders. Within this market, price moves in a fixed range instead of moving in any one direction. As a result, it becomes easier for them to find buying and selling areas. Several traders prefer this market because price movements are stable and more predictable. Traders who want to bet on the safer side can make certain profits by picking frequent trading opportunities. Here are the benefits of trading in sideways markets:
1. Strategic Trading Opportunities: As the price moves in a fixed range, traders can capitalize on this predictability using technical indicators in the sideways market, enabling traders to spot potential entry and exit points.
2. Lower Volatility = More Predictable Entry Points: In a sideways market, the price moves only within a small area, which keeps volatility low compared to trending markets. This makes price movements more predictable and easier to understand. This allows traders to plan their entries and exits more effectively, as the price tends to react at the same levels again.
As we have discussed the advantages of trading in a sideways market, let us now look at its limitations. By understanding these two, traders can avoid trading errors and manage trades more carefully.
1. High Transaction Costs from Frequent Trading: In a sideways market, traders are more active because prices keep moving between support and resistance levels. Because of this, their brokerage charges and other trading fees increase. Over time, these expenses can minimize profit, especially when price movements are small.
2. Time-Intensive Monitoring Required: In order to spot trading opportunities and potential breakouts, traders should track price movements in a sideways market. As prices can reverse quickly, missing a crucial move can negatively affect trading results. This means traders need to monitor charts and continuously check the market.
Sideways Market vs Trending Market: Key Differences
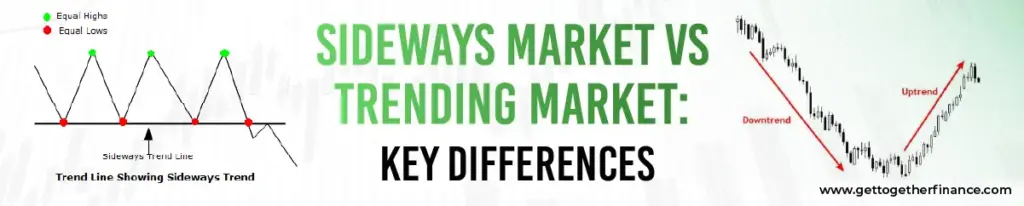
There are 2 ways in which the market generally moves: it either move in a clear direction or sideways within a fixed range. By understanding the difference between these market conditions, traders can manage their risk more effectively and pick the right strategy.
| Basis | Sideways Market | Trending Market |
| Market Direction | No clear direction | Strong bullish or bearish trend |
| Volatility | Low to moderate | Higher during strong trends |
| Technical Indicators | RSI, Bollinger Bands, and Support/Resistance perform better | Moving Averages, MACD, and Trendlines perform better |
| Risk of False Signals | Higher due to repeated price reversals | Lower when the trend is strong |
| Price Movement | Moves within a fixed range | Moves continuously in an upward or downward direction |
| Support and Resistance | Price consistently fluctuates between support and resistance | Price tends to break beyond support or resistance levels |
| Trading Strategy | Buy near support and sell near resistance | Follow the trend and trade in its direction |
| Breakouts | Traders keep an eye on potential breakouts from the range | Traders look for trend continuation |
| Trader Focus | Sideways trading and breakout chances | Trend-following opportunities |
Best Stocks and Sectors to Trade in a Sideways Market

In a sideways market, different stocks react differently. When the market has no strong trend, and the price remains in a range, traders focus on stocks that show steady movements and clear trading ranges.
1. Large-Cap Stocks
These stocks are shares of well-known companies that have high market value. These stocks tend to be more stable and are less likely to be affected by sudden price changes. Large-Cap stocks have high trading volume, which makes them easy to buy and sell. Also, they tend to have clear support and resistance levels, and their prices move in a clear range.
2. Banking and Financial Stocks
When the market is moving sideways, such stocks can offer trading opportunities. Banking and financial stocks generally have good liquidity, which makes it easy for traders to buy and sell shares. As their prices tend to fluctuate within a predictable range, they continuously provide short-term trading opportunities to active traders.
3. Consumer Goods Stocks
The companies that deal with consumer goods sell everyday products that people regularly use, such as beverages, household items, etc. As the demand for these products always stays, their stock prices remain more stable and are less affected by sudden market shifts. This makes them suitable for sideways markets.
4. Utility and Defensive Sectors
Such sectors offer basic services such as healthcare, electricity, water, and consumer products. No matter how the market behaves, people never stop needing these services; that’s why their stocks always remain calm and steady when the market is uncertain.
Key Takeaways: Trading the Sideways Market Successfully

Even without a strong trend, a sideways market can still offer good trading opportunities. Here, the main thing to understand is the price range and the right tools to use to make better trading decisions.
There are some points given below that you need to keep in mind:
- Monitor the breakouts closely, particularly when trading volume rises sharply
- Use indicators like RSI, Bollinger Bands, and ADX to better understand market conditions
- Use a stop-loss to minimise your risk and capital
- Don’t depend on just one indicator; use multiple tools for confirmation
- Buy near support and sell near resistance when prices are moving within a range
What is a Sideways Market or Sideways trend?
A sideways market or trend in the security represents the consolidation phase where the prices of an asset roam around a narrow range without any significant price movements.
How to detect a sideways market?
You can make use of moving averages to correctly detect the sideways market. Observe if the price is moving between the support and resistance levels within a narrow range to look for a sideways trend in the market.
How to trade in the sideways market?
To trade in the sideways market or sideways, follow demand and supply theory which helps you to find out the breakout in prices after the end of consolidation phase.



