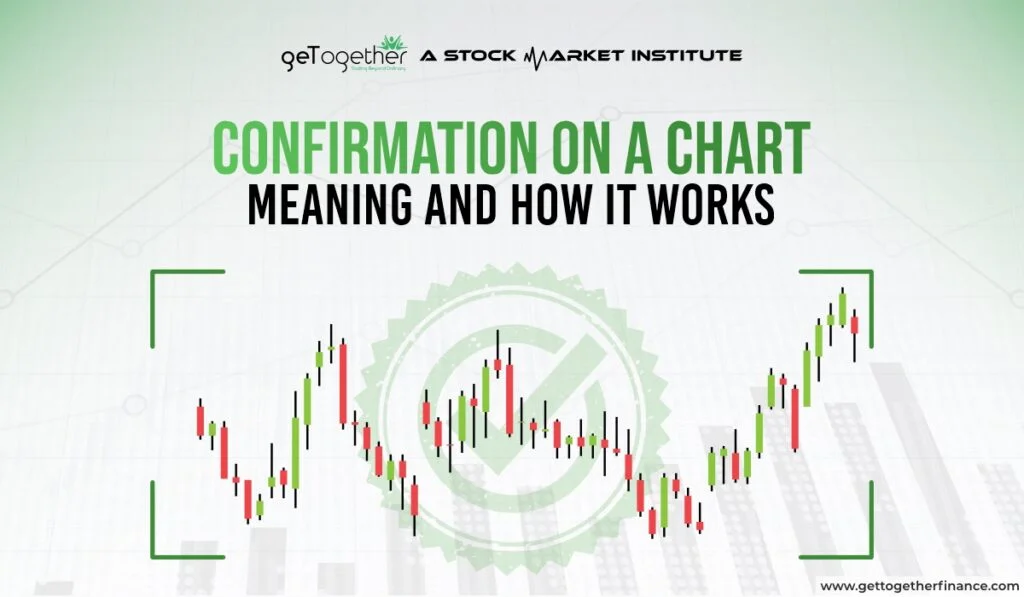
Confirmation on a Chart: Meaning and How It Works
- Updated on : January 6, 2026
- 1127 Views
- by Manaswi Agarwal

 Instagram
Buying shares during a dicey situation psychologically impacts your decisions. A trader has to follow some important rules and one of them is to be conservative about the trades. A conservative trader tends to wait for the confirmation in a chart pattern which assures them of a certain move in the security prices. How does the confirmation work in a chart pattern? Deep dive into this blog to know the benefits of working with confirmation on the charts.
What do you mean by confirmation in the chart pattern?

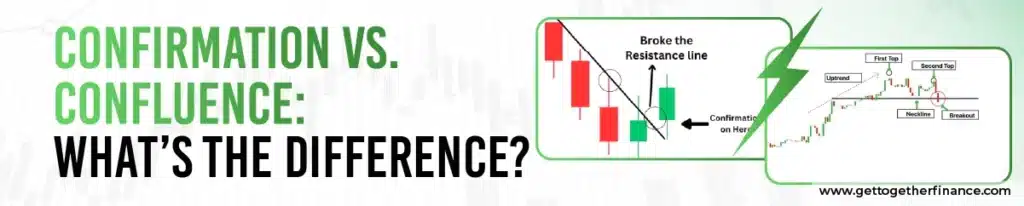
Confirmation is a way to technically analyse the price movements in a security, which substantiates a trend while predicting its future actions. As the move of an asset is never consistent and reliable, which requires traders to feel secure and confident, they hence receive signals from confirmation. A confirmation is required to execute a trade successfully, as it helps traders to confirm certain moves in a security or the market. Whereas, when two or more confirmations support the same trade idea, then it is known as confluence. More confirmation means a higher chance of trade.
Confirmation vs. Confluence: What’s the Difference?
| Aspects | Confirmation | Confluence |
| Definition | It is proof that a particular trade signal or trend is acceptable and likely to reverse or continue. | It refers to the situation where several analysis indicators, tools, and signals align to reinforce trading decisions. |
| Purpose | Confirm the starting signal to lower false moves. | Higher confidence by merging multiple types of evidence. |
| Number of Signal | Generally one main pattern confirm the trend | Multiple patterns, levels, and indicators agreeing at once. |
| Strength | Presents that a particular signal is real | Presents stronger or multi-layered support for the trade system. |
| Usefulness | Decrease risk of misleadings signals | Increase confidence and accuracy within trading decisions. |
| Trading Approach | Verify individual signal | Creates stronger trading patterns by merging numerous confirmations. |
| Example | Breakout confirmed by high volume | Breakout at resistant+bullish moving average crossover+RSI bullish signal |
How to identify confirmation signals?

Confirmation signals are analyzed by using several other technical indicators like moving averages, volume indicators and relative strength index.
Indicator Confirmation
Moving Averages: It is one popular indicator that confirms the trend, reversals, or breakouts in several methods. When combined with the demand zone, trend breakout or reversal is confirmed.
Exponential and simple moving average are the commonly used moving average indicators that form a pattern of death or golden crossover to signify the bearish or bullish reversal in the security respectively.
Relative Strength Index: A confirmation in the security can be received from the relative strength index as it helps to identify overbought and oversold levels in the market.
Volume Indicator: Volume indicator confirms the trend of a trade as it signifies an increased or decreased volume in the asset. It is essential for traders to consider volume while confirming breakouts as well as use trend indicators such as moving average and the volume weighted average price.
Trend Line Analysis: Confirmation on the pattern is received from trend lines as they help to validate trends and contribute to recognize significant highs and lows on the chart pattern. The trend line formation confirms the potential trend reversal or the continuation of existing trend in the security prices.
Also Read : Types of stock market indicators
Price Action Confirmation
A confirmation is received by a trader through price action when the stock breaks above a resistance level and closes above that level waiting for an increased volume to confirm a genuine breakout in the pattern.
As per the demand in supply theory, a trader seeks to achieve the confirmation from the daily time frame when the demand zones continuously try to breach the supply zones. When the demand zones are able to breach at least two supply zones, it makes the traders sure about a bullish reversal in the security.
Volume as a Confirmation Signal

Within the stock market, volume serves as an important confirmation candle signal by showcasing the power or certainty of price movements. When a price goes up with increasing or high volume, then it shows a powerful market certainty. This also indicates that the price is more likely to go up as more traders are eagerly involved in the trade.
On the other hand, price movement on low or decreasing volumes shows low interest among traders. This indicates that the trend is changing soon.
“High volume reveals confidence of buyers, while low volume reveals a lack of traders’ dedication. If you mark high volume during a surge in price, it indicates buyers are stepping into the market.” — Get Together Finance.
Candlestick-Based Confirmation Signals

Candlestick-based confirmation signals assist traders in confirming price trends or reversals by utilizing particular candlestick patterns, as well as other tools such as indicators and volume.
Main points comprise:
- A bullish confirmation chart frequently emerges after a downtrend and represents a practicable upward reversal, such as bullish engulfing.
- A bearish confirmation candle signals a reversal or downtrend from an upward trend, like three black crows.
- Doji and other crucial patterns indicate market uncertainty and possible trend changes.
Confirmation chart signals enhance trading decisions by lowering false signals and outlining trustworthy exit and entry points.
Pro Tip: Always make sure that the next candle closes before doing a trade on a confirmation candle pattern.
Importance of Confirmation Signals

In trading, when performed with technical analysis, it becomes essential to consider the element of confirmation, as it is additional evidence of the decision-making process. A confirmation trade allows and validates the potential outcome of a pattern. Trading without confirmation on a pattern with just a breakout can be very risky, as it can turn into a false breakout or might reverse in the opposite direction. Let us know why confirmation is important in technical chart patterns.
Increased Reliability
The sole purpose of a confirmation signal is to act as a filter and increase the reliability of a chart pattern to move in the desired direction. For example, let us once consider an inverse head and shoulder bullish pattern which gives a confirmation signal during a breakout with a significant surge in trading volume.
Reduced False Breakouts
Confirmation trades are essential as it reduces false breakouts in the pattern which is the common occurrence in the financial markets. Getting confirmation on a trade minimizes the risks of false breakouts and leading traders towards a trap. In a breakout situation you must consider getting confirmation through indicators and price action to increase the probability of a favorable move in the price direction and avoid false breakouts.
Timeframe Matters in Confirmation
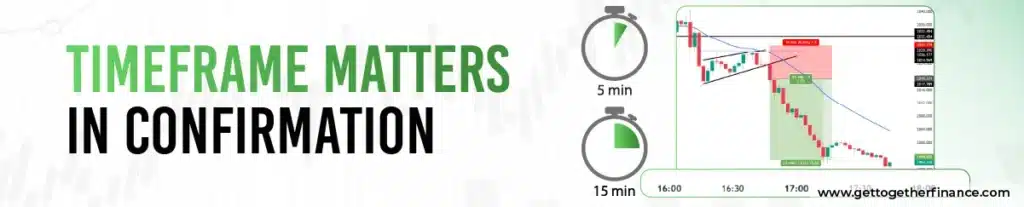
Within the stock market, the use of tools to verify a bullish trend is vital, as different timeframes represent different perspectives of the market trend. Higher timeframes, such as weekly charts, disclose the approaches and guidance. This helps in confirming that the bullish trend is strong and likely to continue. The shorter timeframes, like hourly or daily charts, assist in adjusting exit and entry by displaying more instant price actions.
Higher timeframes have higher accuracy by about 60%-80% in comparison with lower timeframes. Using several timeframes together provides a transparent confirmation of a bullish trend. For instance, if the weekly chart presents an uptrend and the daily chart indicates bullish force, then it gives a stronger confirmation of a trend.
Mistakes Traders Make With Confirmation

Common mistakes that traders make while confirming patterns are:
- Ignoring Price Action
- Overreliance on Confirmation
- Emotional trading
- Using Too Many Indicators.
- Chasing Confirmation.
- Ignoring Market Context.
Popular Tools Used for Confirmation

The popular tools used by traders for candle confirmation are:
- MACD (Moving Average Convergence Divergence).
- Pattern Recognition and Signal Platform.
- Relative Strength Index (RSI).
- Volume.
- Moving Averages (MA, EMA).
- Bollinger Bands.
- Stochastic Oscillator.
Pitfalls of Confirmation Indicator

Confirmation provides valuable insights to make informed decisions while increasing trader’s confidence towards tool indicators. However, there are several pitfalls that need to be taken care of as a trade for more in depth knowledge about a confirmation trade.
Lagging Nature
Confirmation indicators are lagging in nature as they react to the price movements that have already occurred in the charts. It is one of the drawbacks of confirmation indicators that they do not provide real time signals to enter or exit the positions.
Over Reliance
One of the drawbacks of confirmation is that traders sometimes become over reliant on confirmation indicators. Trading solely based on confirmation indicators can be quite disastrous as it is just a piece of the puzzle, various other indicators and factors must be considered as well.
False Signals
Confirmation indicators can generate false signals or whipsaws as the market might move in an opposite direction due to some uncertainties. To avoid these kinds of risks, a trader should focus on mitigating the impacts of false signals.
The Bottom Line
As we have discussed above, a trader requires confirmation to predict the future price movements in a security. A confirmation entry through the demand and supply zones ensures that the price moves in the favorable direction.


