
Dow Theory in Technical Analysis: Meaning, 6 Tenets, Phases and How to Apply It
- Updated on :
- 4462 Views
- by Manaswi Agarwal

 Instagram
 Linkedin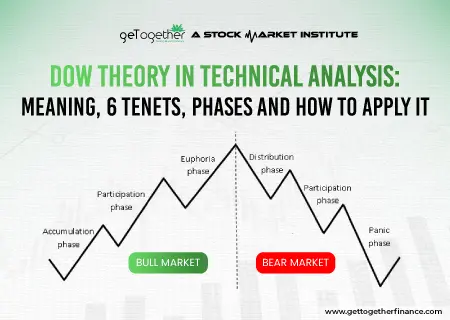
Dow Theory is one of the oldest and most trusted ideas in technical analysis. It was created by Charles Dow, the founder of Dow Jones & Company, in the late 1800s. Simply put, Dow Theory says that stock prices move in trends, and by studying these trends, traders can understand where the market is headed.
The theory rests on 6 core tenets (rules), which we will explain one by one. In this guide, you’ll learn what Dow Theory means, how it works, its different phases, and how to actually apply it, including examples from the Indian stock market.
What Is Dow Theory and Why Is It the Foundation of Technical Analysis?

Dow Theory in the stock market is a way of studying price movements to understand market trends. Its core idea is simple: stock prices already reflect all available information, news, earnings, interest rates, and investor mood are all “priced in.”
This is why Dow Theory in technical analysis is still relevant today; nearly every modern trend-following tool, from moving averages to trendlines, is built on the base that Dow laid down over 100 years ago.
Origin of Dow Theory: Charles Dow, William Hamilton and Robert Rhea

Charles Dow founded Dow Jones & Company along with the Wall Street Journal in 1882. In the late 1890s, he began sharing his market ideas through a series of editorials in the WSJ.
Dow never wrote a single book calling it “Dow Theory.” After his death, two other analysts—William Peter Hamilton and Robert Rhea — collected, organised, and named his ideas “Dow Theory.”
Dow is also known for building two market barometers: the Dow Jones Industrial Average (DJIA) in 1896, and the Dow Jones Transportation Average (DJTA). These two indices were central to how he tested and confirmed market trends.
How Is Dow Theory Used in Technical Analysis? The 6 Core Tenets Explained
Dow Theory in technical analysis is built on 6 simple rules, called tenets. Together, they form a complete framework for how prices behave, to how trends are confirmed, to when a trend is truly over. Let’s go through each one.
Tenet 1: The Market Discounts Everything
This is the starting point of the Dow Theory. It means the current stock price already includes all known information, company earnings, interest rates, inflation, and even investor sentiment.
In practice, this means a trader should not rush to trade purely on a news headline, since the price has often already moved before the news is public. For example, ahead of an RBI rate decision, the Nifty often starts moving in a direction days before the announcement, as informed money positions itself early. By the time the news is out, much of the move may already be over.
Tenet 2: There Are Three Kinds of Market Trends
Dow Theory says every market moves in three trends at the same time:
- Primary trend: the big, main direction, lasting months to years
- Secondary trend: a correction within the primary trend, lasting weeks to months
- Minor trend: small day-to-day noise within the secondary trend, lasting days to weeks
A simple way to remember this: think of it like ocean currents (primary trend), waves (secondary trend), and ripples (minor trend). The current decides the real direction, while waves and ripples are just short-term movement on top of it.
Tenet 3: Primary Trends Have Three Phases
Every primary trend, be it bull or bear, passes through three phases.
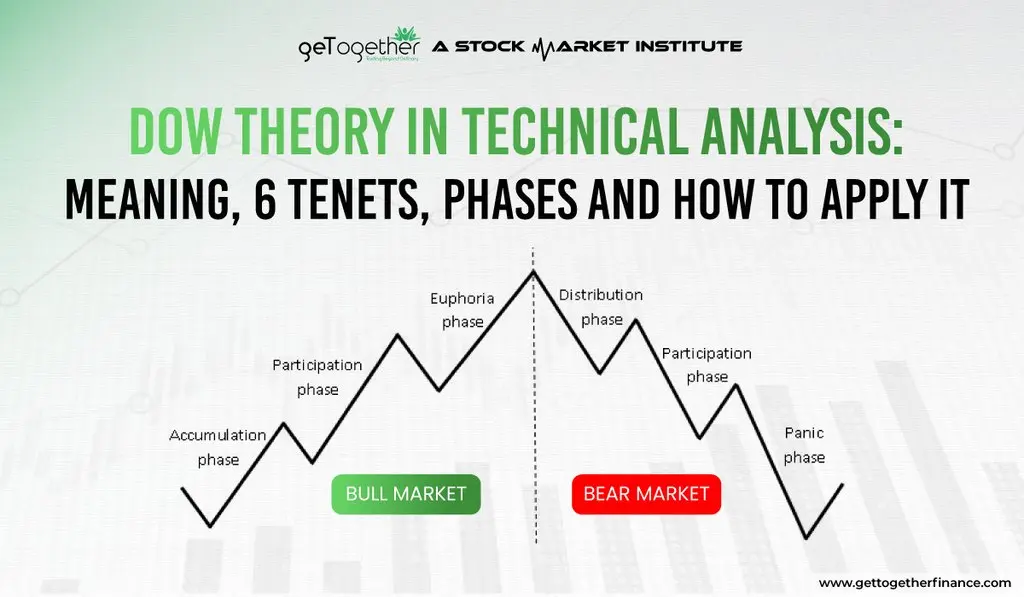
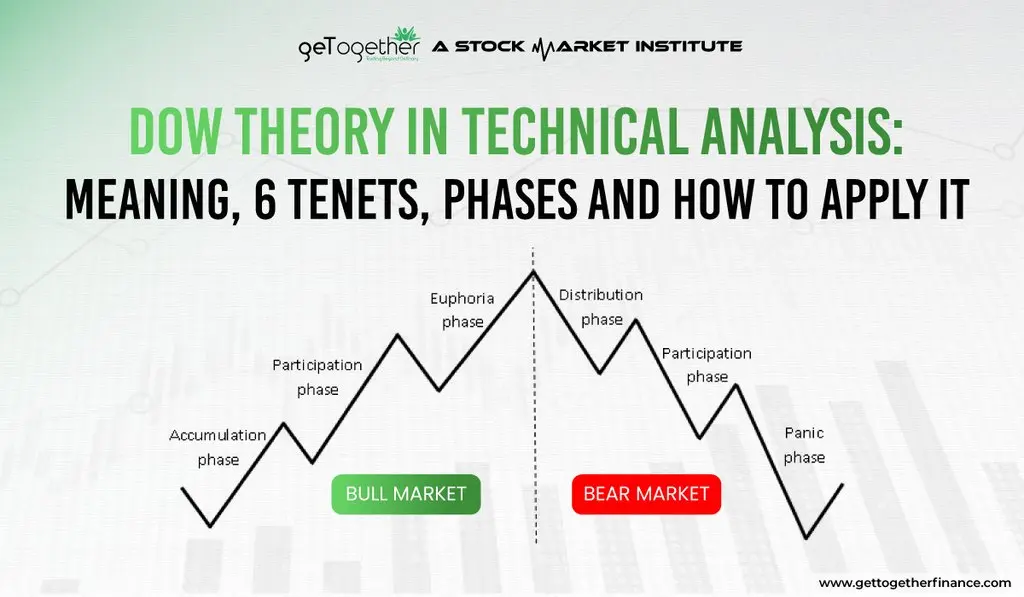
In a bull market: Accumulation → Public Participation → Distribution
In a bear market, the cycle mirrors this in reverse: Distribution → Public Participation (selling) → Panic/Capitulation
Tenet 4: Indices Must Confirm Each Other
Dow believed that one index alone isn’t enough proof of a trend. In his time, both the DJIA (industrial companies) and the DJTA (transport companies) had to hit new highs or lows together for a trend to be considered valid. If only one index confirmed the move, the trend was seen as weak or doubtful.
In the Indian stock market, traders apply the same idea, using the Nifty 50 as the main index and the Nifty Bank or the Nifty Midcap 150 as the confirming index. For example, if Nifty 50 makes a new high but Nifty Bank fails to confirm with a new high of its own, it’s often a sign the broader trend may be weak or running out of steam.
Tenet 5: Volume Must Confirm the Trend
Volume tells us how strong a trend really is. Here’s how it works:
| Market Condition | What Price Does | What Volume Should Do | What It Means |
| Healthy uptrend | Prices rise. | Volume rises on up-days | The trend is strong |
| Healthy uptrend correction | Price dips slightly | Volume falls on down-days | Normal, healthy pause |
| Healthy downtrend | Price falls | Volume rises on down-days | The trend is strong |
| Healthy downtrend bounce | Price rises slightly | Volume falls on up-days | Normal, healthy pause |
When price and volume don’t match this pattern, for example, when price makes a new high, but volume actually drops, it’s called a divergence, and it’s often an early warning that the trend may be losing strength.
Tenet 6: A Trend Continues Until a Definitive Reversal Signal
Once a trend is in place, Dow Theory assumes it stays in place until there’s clear proof it has reversed. A few important rules here:
- A genuine reversal in an uptrend usually shows up as a lower high followed by a lower low, not just one bad day
- A secondary trend (a normal correction) is not the same as a reversal; don’t confuse the two
- The reversal should ideally be confirmed by rising volume in the new direction
- It’s usually wise to wait for this confirmation rather than reacting to the very first sign of weakness
For example, when Nifty finally confirmed a trend reversal after a long bull run, it wasn’t on the first sharp fall; it was only after the index made a clear lower high and lower low, backed by strong selling volume, that the reversal was considered confirmed.
The Three Market Trends in Dow Theory: Primary, Secondary and Minor

Here’s a quick side-by-side look at all three trends:
| Trend Type | Duration | Direction | Purpose | How to Identify |
| Primary | Months to years | Main market direction | Shows the big bull or bear market | Series of higher highs & higher lows (or lower highs & lower lows) |
| Secondary | Weeks to months | Opposite to primary trend | Healthy correction/pause | Price retraces part of the primary move |
| Minor | Days to weeks | Opposite to secondary trend | Short-term noise | Small daily price swings |
As a simple rule for traders: always trade in the direction of the primary trend and use secondary corrections as entry opportunities, rather than trying to trade every minor swing.
Primary Trend in Dow Theory: Bull Market and Bear Market Explained
The primary trend is the main, long-term direction of the market, usually lasting 1 to 3 years. When Nifty forms its first higher high followed by a higher low after a long downtrend, that’s typically the start of a new primary uptrend. This early stage lines up closely with the Accumulation Phase (explained below), where smart money starts buying before the broader market notices.
Secondary Trend in Dow Theory: Corrections, Duration and How to Identify Them
Secondary trends are corrections within the primary trend. In Indian markets, these corrections in Nifty typically last around 3 to 8 weeks.
The biggest challenge traders face is telling a secondary correction apart from an actual primary trend reversal. A useful rule of thumb: a correction that retraces roughly 33% to 66% of the prior primary move is usually just a secondary trend, not a full reversal.
Minor Trend in Dow Theory: Short-Term Fluctuations and Market Noise
Minor trends are the smallest moves, typically lasting 1 to 21 days. Dow himself dismissed these as “market noise”, too short and unpredictable to trade reliably.
However, in modern markets, minor trends are exactly what day traders use for intraday entries, as long as they trade in the same direction as the larger secondary and primary trends. This is how a 100-year-old theory still connects to modern intraday trading.
The Three Phases of Dow Theory: Accumulation, Public Participation and Distribution

A full market cycle under Dow Theory has six phases in total, three in a bull cycle and three in a mirrored bear cycle. Each phase closely tracks institutional (big player) behaviour: Accumulation is when institutions quietly buy at demand zones, Public Participation is when retail traders join the trend, and Distribution is when institutions start exiting while retail is still buying.
Accumulation Phase in Dow Theory: When Smart Money Enters the Market
This phase begins after a long downtrend, when experienced buyers start entering quietly. On a chart, price usually looks flat or sideways, and volume is low but steady — not falling further. This is also when institutional demand zones typically form.
Most retail traders miss this phase completely since the price looks flat and “boring”; there’s no exciting news to draw attention. A Nifty accumulation phase, for instance, often looks like a long, quiet sideways range before a fresh uptrend begins.
Public Participation Phase in Dow Theory: The Longest and Most Profitable Phase
Once the trend becomes visible, retail traders start joining in, and momentum-based tools start working well. This is usually the longest phase of the cycle, and it’s when most trend-following strategies make their biggest profits. Historically, this phase on Nifty has often stretched across many months as the broader market keeps climbing.
Distribution Phase in Dow Theory: Warning Signs Before the Market Turns Bearish
This is the final phase, where early investors and institutions start booking profits while retail traders are often still buying. Key warning signs to watch for:
- Price makes new highs, but volume does not confirm (a divergence)
- Market breadth narrows, fewer stocks are actually participating in the rally
- Supply zones start appearing on higher timeframes
This phase is exactly where the exact reversal areas usually form, right before a market correction begins. A real distribution phase on Nifty typically shows a series of new highs on weakening volume, just before a notable correction follows.
Pros and Cons of Dow Theory: Strengths, Limitations and When to Use It

Dow Theory makes tracking market trends easier, but it has some limitations. By understanding both its advantages and disadvantages, traders and investors can use it more effectively.
| Pros | Cons |
| Gives a clear, long-term market framework | Lagging indicator, signals often come late |
| Based on real, observable price and volume data | Doesn’t give precise entry or exit points |
| Works across markets, including India | Originally built on US indices, it needs adapting for other markets |
| Time-tested for over 130 years | Identifying phases can be subjective |
| Offers objective rules to identify trends | Doesn’t account for individual stock-specific factors |
How Is Dow Theory Applied to the Indian Stock Market: Nifty 50 and Nifty Bank?

Indian traders adapt Dow’s original US-based framework to local indices:
- Nifty 50 is used as the primary trend indicator, the same role DJIA played for Dow
- Nifty Bank (or sometimes Nifty Midcap 150) acts as the confirming index, the same role DJTA played
- A trend is considered strong when both Nifty 50 and Nifty Bank move in the same direction and confirm new highs or lows together. If Nifty 50 rallies but Nifty Bank doesn’t confirm, the rally may be weak
- On an actual Nifty 50 chart, you can mark out the Accumulation, Public Participation, and Distribution phases to see exactly where the market currently stands in its cycle
By tracking the Nifty 50 alongside a confirming index and watching for the phase the market is currently in, traders can apply the century-old logic of Dow Theory to the modern Indian stock market.
The Bottom Line
Dow Theory is used to conduct technical analysis, identify market trends, and understand potential future market movements. The theory has been used for a long time and continues to be relevant in modern technical analysis. Apart from this, demand and supply is another technical approach that can help identify market movements and assess potential price movements of assets. Both approaches can provide useful insights into market behavior when used appropriately. However, risk management is an essential part of trading and investing that should never be ignored.
FAQs
Q1. What is the Dow Theory?
Dow Theory, originated by Charles H. Dow helps to recognize market trends. Investors can make their decisions about buying or selling based on this theory.
Q2. What are the trends in the Dow Theory?
The trends in the Dow Theory help to recognize market movements. There are three trends in the Dow Theory: Primary trend, Secondary trend and minor trend.
Q3. Is Dow Theory still reliable?
Yes, it can be said that Dow Theory is still reliable but looking at the vast change in the market, advanced technical analysis methods like demand and supply theory can be more reliable.
Q4. What is the purpose of the Dow Theory?
The main goal of Dow Theory is to predict future market movements and analyze price action for investment purposes.
Q5. Can Dow Theory predict market movements?
Yes, the theory helps to predict market movements and analyze the market trends through which investors gain insights about future market conditions.



