DuPont Analysis: Formula, Components, Trend Analysis & Red Flag Detection
- Updated on : May 23, 2026
- 6738 Views
- by Arun Singh Tanwar

 Facebook
 Instagram
 Youtube
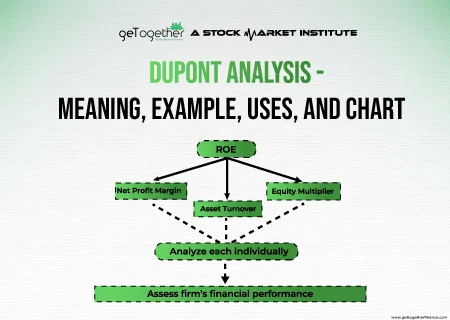
Stock market investors prefer safeguarding their capital resources to minting profits, especially during volatile times. As such, they mostly focus on blue-chip stocks. However, to identify and invest in such quality stocks, you must gather multiple financial data of numerous companies for a proper analysis. That includes balance sheets (opening and ending), actual accrual/accrual-adjusted income statements, and cash flow statements.
While performing such an in-depth assessment can get overwhelming, you can turn to the oft-used DuPont analysis to dig deeper into the underlying factors shaping a company’s overall performance.
This piece will walk you through the intricacies of DuPont analysis, exploring its significance, use cases, and drawbacks.
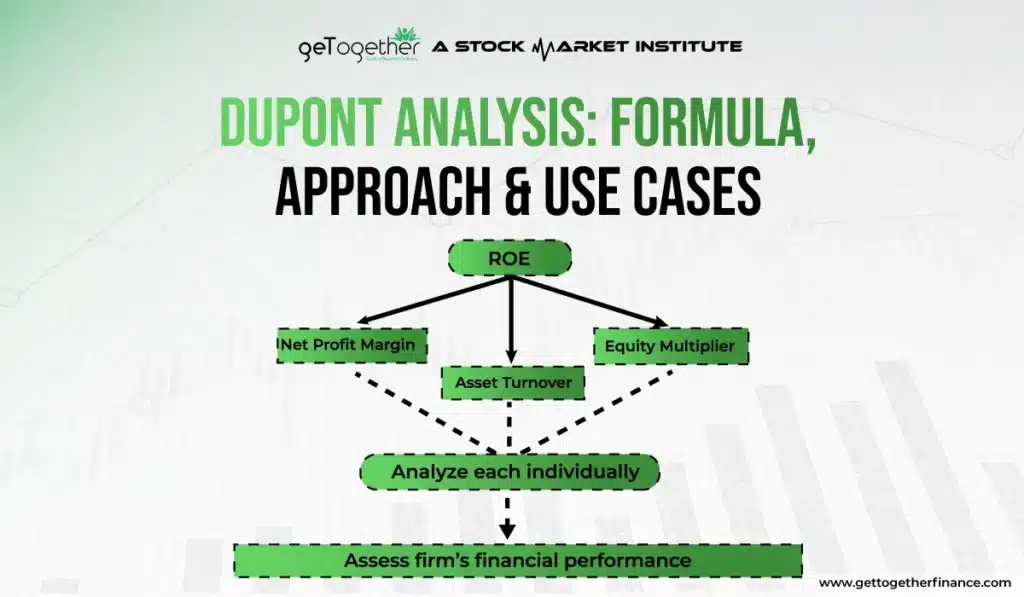
What Is the DuPont Analysis?
DuPont analysis is a financial ratio that breaks down a company’s return on equity (ROE) into three crucial metrics: profitability, asset turnover, and equity multiplier. That way, investors can separately determine key performance indicators (KPI) and distinguish between the company’s strengths and weaknesses.
DuPont analysis is like the Sherlock Holmes of financial metrics, unraveling the mystery behind a company’s overall performance by examining its various components.
Let’s turn back time.
About a century ago, Frank Donaldson Brown devised a formula that nicely deconstructs a company’s ROE into essential components that offer valuable insights. As Mr. Brown was a member of the American chemical giant DuPont’s Finance Committee, his formula was named DuPont Analysis or DuPont’s Pyramid, or DuPont’s Model.
Fast forward to today, this multi-equation framework has since become a critical tool for financial analysts, investors, and corporate strategists seeking a deep dive into a company’s financial health.
By decomposing ROE into its underlying components, DuPont analysis lets you pinpoint financial activities driving a company’s profitability and make informed decisions about investment, capital structure, and operational efficiency.
Key Components of DuPont Analysis

As mentioned earlier, the DuPont analysis comprises three important ratios:
Net Profit Margin (Profitability)
Net profit margin indicates how efficient an organization is at generating profitable sales. In other words, it depicts how much profit it generates from its revenue. You can calculate a company’s net profit margin using the formula:
[Net profit margin = Net Income/Sales or Revenue (from Operations)]
Where net profit is the cash left over after a firm has paid all its expenses, including taxes and payrolls.
Total Asset Turnover
Total asset turnover (TATO) demonstrates a firm’s efficacy in utilizing its assets to generate sales. Here is the formula to calculate it:
[Total asset turnover = Sales or Revenue/Total Assets]
This financial ratio is inversely proportional to the net profit margin. It helps investors compare a high-profit, low-volume business model of two companies within the same industry.
Equity Multiplier (Financial Leverage)
The equity multiplier measures how much liability and debt a company has taken. Organizations lock in debts from multiple financers – banks, venture capitalists, and bond markets – to fund their operations and corporate goals.
The equity multiplier can be calculated as:
[Equity multiplier = Total Assets/Shareholders’ Equity]
A high equity multiplier denotes that a company has taken a considerable amount of debt to purchase assets and, hence, poses a higher bankruptcy risk.
Also Read: Elliot Wave Theory
DuPont Analysis vs. Return on Equity (ROE)

DuPont analysis and ROE are related concepts in financial analysis, but they differ in their depth and focus.
ROE is a straightforward financial metric representing the percentage return a company generates on its shareholders’ equity. It is a high-level indicator of a firm’s profitability and efficiency in utilizing shareholder funds to increase sales. Mathematically,
[ROE = (Net Income/Shareholders’ Equity)*100]
A high ROE means that a company is clocking an impressive return on its equity, while vice versa indicates that it is not using its equity as optimally as possible.
On the flip side, DuPont analysis is the extended version of ROE. It takes a more granular approach by breaking down ROE into its fundamental components (already discussed). This breakdown offers a more detailed examination of the factors influencing a company’s ROE.
In a nutshell, ROE serves as the headline number, summarizing overall performance, while DuPont analysis is the tool that dissects and explains the story behind that number. Think of ROE as the destination on a map and DuPont analysis as the detailed route, guiding analysts and investors through the intricacies of a company’s profitability, asset management, and financial leverage.
Understanding the DuPont Analysis
The DuPont analysis calculates the ROE in two ways: 3-step and 5-step. Let’s get to the bottom of both the categories.
3-step DuPont Analysis

In the three-point method, the ROE is calculated using the following equation:
[ROE = (Net Profit Margin x Asset Turnover x Equity Multiplier)*100]
Here is an example to understand the formula better by comparing the financial metrics of two similar companies.
| Metrics | Company A | Company B |
| Net Income | ₹1000 | ₹1500 |
| Sales | ₹10000 | ₹12000 |
| Net Profit Margin | 0.1 | 0.125 |
| Total Assets | ₹3000 | ₹4000 |
| Asset Turnover | 3.33 | 3 |
| Equity | ₹2000 | ₹2500 |
| Equity Multiplier | 1.5 | 1.6 |
| ROE | 49.95% | 60% |
5-step DuPont Analysis
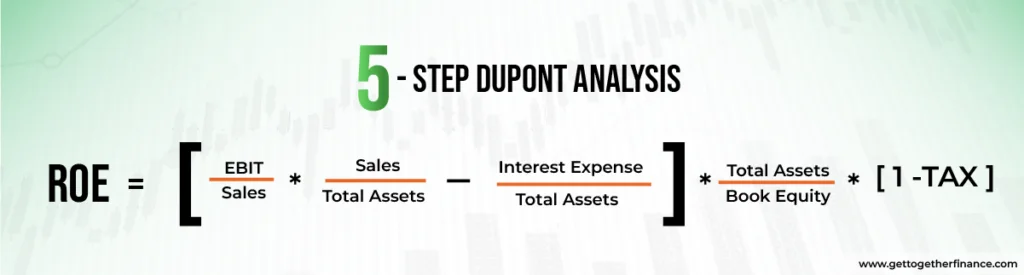
To calculate ROE using the 5-step method, you will need five pieces of information, which are:
- Tax Efficiency = Net Income/Earnings Before Tax (EBT) OR 1 – Tax Rate
- Interest Burden = EBT/Operating Income OR 1 − Interest Expense Ratio
- Operating Margin = Operating Income/Sales
- Asset Turnover = Sales/Average Total Assets
- Equity Multiplier = Average Total Assets/Average Shareholders’ Equity
Combining this information into the final equation, we get:
[ROE = (Tax Efficiency x Interest Burden x Operating Margin x Asset Turnover x Equity Multiplier)*100]
More elaborately,
[ROE = (EBT/Sales) x (Sales/Assets) x (Assets/Equity) x (1 – Tax Rate)]
The 5-step DuPont analysis incorporates two additional components as it further splits the net profit margin into three distinct metrics:
- Tax efficiency: The amount of net income retained after taxes.
- Interest burden: The impact of interest expenses on a company’s profit
- Operating margin: The operating profit (earnings before interest and taxes) retained per dollar of sales minus the operating expenses (OpEx) and cost of goods sold (COGS).
DuPont Analysis vs Other Profitability Ratios

Let’s understand the difference between DuPont Analysis, ROA, ROIC, and ROCE by the table given below:
| Basis of Comparison | DuPont Analysis | ROA (Return on Assets) | ROIC (Return on Invested Capital) | ROCE (Return on Capital Employed) |
| Key Focus | Financial leverage, profit margin, and asset efficiency | Assets utilisation | Value creation from equity and debt | Effective use of invested capital |
| Purpose | Describe why ROE changes by breaking into its elements | Shows how effectively assets are used to generate profits | Measure the return earned on total invested capital | Measure the efficiency of total capital usage |
| Level of insight | Detailed and deep | High-level | Moderate | Moderate |
| Investor Usefulness | Very high for fundamental analysis | Useful for an instant efficiency check | Useful for long-term investors | Useful for capital-intensive investors |
| Best Used For | Identify the factor behind management choice and profitability | Evaluate operational efficiency | Measure long-term value creation | Comparing capital efficiency across businesses |
| Account for Leverage | Yes | No | Partially | Yes |
Why DuPont Analysis Matters for Investors and Analysts
To understand what is DuPont Analysis, investors have to know that it goes beyond high-level profitability and explains why a company is generating a return on equity (ROE). Rather than considering ROE as a single number, this framework breaks it down into operational efficiency, financial leverage, and profitability. This allows analysts and investors to understand what actually drives a company’s performance.
For investors, DuPont Analysis discloses that strong returns are built on excessive results and sustainable operations. Companies that make good returns by using assets effectively and keeping healthy profit margins are generally more stable than those that majorly depend on debt. This difference is crucial for making long-term investment decisions and managing risk.
For analysts, this framework is a way to see how well a company’s management is performing. Changes in ROE are associated with management decisions that involve cost efficiency, capital structure, and asset utilization.
In essence, DuPont Analysis explains ROE clearly rather than just showing a single number. It assists investors in making better decisions and understanding performance better.
Key Insights: DuPont Analysis gives a more meaningful or better understanding when they are compared with industry peers.
Impact of Capital Structure Changes on DuPont Components

Changes in the company’s capital structure, mainly between equity and debt, directly influence the component of DuPont analysis and ultimately, return on equity (ROE).
Higher debt increases the equity multiplier, which boosts ROE even when operational performance and profitability remain the same. However, higher debt also results in increased interest expenses, which lowers the net profit margin if earnings don’t increase at the same time.
On the other hand, lower debt and strengthening equity financing reduced the equity multiplier, which makes ROE more dependent on asset efficiency and profit margins. While this leads to a lower ROE in the short term, it usually reveals a less risky and more stable financial position.
Changes in capital structure can also affect asset turnover.
DuPont Trend Analysis: How to Read Multi-Year ROE Decomposition

DuPont Trend Analysis involves evaluating the elements of return on equity (ROE) over several years to understand how a business’s financial performance is changing over time. Rather than relying on ROE as a single value, this approach describes the drivers of changes.
Analysis of Net Profit Margin Trend
A steady rise in net profit margin over the years signifies improved cost control, pricing power, and efficient operations. While declining margins indicate rising costs, weaker demand, and competitive pressure.
Understand the True Source of ROE Growth
By looking at all three elements, investors can understand why ROE is increasing. ROE growth is more sustainable when the company uses its assets in a better way instead of taking excessive debt.
Track Changes in the Equity Multiplier
The equity multiplier outlines changes in financial leverage. An increasing equity multiplier means that the company is dependent more on debt to finance its assets, which can boost ROE but also raise financial risk. A steady or lower equity multiplier generally indicates a balanced capital structure.
Use Trend Analysis for better decision-making
Looking at DuPont Analysis over multiple years helps investors understand how well a company is managed, how risky it is, and how it may perform in the future. It also depicts whether higher ROE comes from real business growth or just increased borrowings.
Evaluate Asset Turnover Trends
Trends in asset turnover show how effectively a company utilizes its assets to create income. An improving asset turnover ratio indicates better utilisation of assets. On the other hand, a declining trend shows inefficient operation or overinvestment.
Key Insights: For a complete picture, always use DuPont with liquidity analysis and cash flow.
How Management Decisions Influence DuPont Ratios

Management decisions play an essential role in shaping the main component of DuPont Ratios, which include profitability, financial leverage, and efficiency. Every strategic choice made by management indirectly or directly influences on company’s return on equity (ROE).
Impact on Asset Turnover (Efficiency)
Through operational and investment decisions, management influences asset turnover. Efficiently using assets and managing inventory well helps a company make higher sales from the same resources, as well as boost asset turnover.
Influence on Equity Multiplier (Financial Leverage)
How much a company uses its own money or debt affects the equity multiplier. Higher debt levels can enhance ROE but also increase financial risk. Borrowing cautiously leads to a safer financial position and a lower equity multiplier.
Impact on Net Profit Margin (Profitability)
Decisions related to product mix, cost control, pricing, and operational efficiency affect profitability. For instance, improving supply chain efficiency and lowering operational costs can increase net earnings.
Overall Effect on ROE:
Management aims to earn more, utilize assets wisely, and limit excessive borrowing. DuPont Analysis helps investors to understand whether profit came from a strong business or from using more debt.
Use Cases of DuPont Analysis
DuPont analysis is a powerful financial tool with versatile applications across various scenarios. Here are some notable use cases:
Performance Evaluation
You can determine whether the company’s performance is primarily owing to efficient operations, effective use of assets, or favorable financial leverage.
Comparison between Companies
When considering investments in a particular industry, DuPont analysis lets you compare the ROEs of various companies in the same industry more comprehensively. It provides insights into companies that are more operationally efficient, better at utilizing assets, and effectively managing their financial leverage.
Risk Assessment
Understanding the components of ROE through DuPont analysis helps you examine the risks associated with your investment. For instance, a company with a high ROE driven by excessive financial leverage could be riskier than one with a similar ROE driven by operational efficiency.
Analyzing Management Efficiency
DuPont analysis serves as a tool to evaluate the effectiveness of a company’s management. For example, suppose a company consistently improves its net profit margin and asset turnover over time. In that case, it means that management is successfully implementing strategies to boost profitability and efficiency.
Predicting Future Performance
With DuPont analysis, you can build multiple scenarios and understand how changes in specific components impact a company’s future ROE. That way, you can make more informed investment-related decisions.
Situations Where DuPont Analysis Fails or Gives Misleading Results

Here are some situations where DuPont analysis fails or gives misleading results:
- Differences in accounting methods, like revenue recognition, can reduce profit margins and asset values.
- DuPont Analysis may not work well for capital-intensive or financial industries.
- DuPont Analysis does not consider liquidity and cash flow problems.
- Using DuPont Analysis for one year can be misleading.
- A sudden change in business conditions or the market can reduce the accuracy.
- High debt levels can amplify ROE and hide the weak performance of the company.
- Temporary gains can make profit look better than it really is.
DuPont Analysis for Detecting Red Flags in Companies

DuPont analysis is a crucial tool for detecting red flags by indicating the real reason behind changes in ROE
- DuPont analysis helps investors identify warning signs by breaking down ROE into leverage, profitability, and efficiency.
- If the ROE suddenly increases because the company is using more debt, it signifies a higher risk.
- An unexpected change in the DuPont ratio may indicate a risky financial decision.
- A Higher ROE without better profit or efficiency can be misleading.
- Comparing DuPont elements over multiple years helps in spotting hidden problems early, before they become serious.
Limitations of Using DuPont Analysis

Despite the DuPont pyramid’s comprehensiveness, it has some drawbacks, including:
Subject to Accounting Methods
The DuPont model banks on financial statements, and the results can be subject to the accounting methods used by a company. Differences in accounting policies, such as depreciation methods or revenue realization, can impact the accuracy and comparability of the ratios.
Assumes Linear Relationships
DuPont analysis assumes that all the ROE components are linearly related. In reality, these relationships may not always be constant or straightforward, especially in dynamic business environments.
Ignores the Timing of Cash Flows
The analysis focuses on accounting measures and may not reflect the timing of cash flows. For example, changes in investment decisions or working capital can impact cash flow but may not be explicitly captured in DuPont analysis.
Limited Insight into Quality of Earnings
While DuPont analysis breaks down ROE, it may not provide a holistic picture of the quality of earnings. For instance, high financial leverage contributing to ROE might indicate increased risk and reliance on debt instead of sustainable operational efficiency.
Not Applicable for All Industries
Some industries have capital structures and business models that do not align well with the assumptions of DuPont analysis. Case in point, financial institutions or capital-intensive industries have different drivers for ROE that are not adequately captured by the traditional components.
Overemphasis on ROE
DuPont analysis focuses heavily on ROE. Even though it is a critical metric, you might overlook other important aspects of a company’s financial health, including liquidity, solvency, and cash flow, by solely depending on this parameter.
Limited Forward-looking Perspective
The analysis is derived from historical financial data and does not offer a robust forward-looking perspective. Changes in industry dynamics, market conditions, or management strategies might not be fully reflected in historical data.
Beyond the Numbers
The beauty of DuPont analysis lies in its precision and attention to detail, enabling you to paint a complete picture of a company’s performance. Whether you are an investor looking for opportunities or a business owner striving for growth, this analytical approach will be your compass in navigating the vast sea of financial data.
That being said, use DuPont analysis in conjunction with other tools and considerations to obtain a 360-degree view of a company’s overall position within its industry.
Conclusion
DuPont analysis is more than just a method to calculate return on equity. It is a powerful approach for understanding the real story behind the performance of the company. By breaking ROE into financial leverage, asset efficiency, and profitability it allows analysts and investors to understand where returns came from rather than relying on a single number.
FAQs
What is DuPont Analysis, and how is it used in financial analysis?
DuPont analysis is a financial technique that breaks down a company’s return on equity (ROE) into three components: profitability, operational efficiency, and financial leverage. It helps investors and analysts understand the sources of a firm’s financial performance by examining the impact of these factors. By doing so, DuPont analysis provides a more detailed and insightful assessment of a company’s overall financial health, aiding investors and analysts in making informed investment decisions.
What are the key components of DuPont Analysis?
DuPont analysis dissects a company’s return on equity (ROE) into three key components:
Profitability: Examines the net profit margin, indicating how effectively a company converts sales/revenue into profit.
Efficiency: Focuses on asset turnover, revealing how efficiently a company utilizes its resources to generate sales/revenue.
Leverage: Assesses the financial leverage, highlighting the impact of debt on ROE and the company’s overall financial fabric.
How does DuPont Analysis help in assessing a company’s performance?
Here are some ways DuPont analysis helps examine a company’s performance:
Determining the operational and asset use efficiency
Determining financial activities that mainly influence ROE
Checking a company’s management efficiency
Comparing the operational efficiency of similar firms
Checking whether a company’s ROE is lower as it is deemed riskier to invest in
Examining a company’s expenses and its effect on operating profit margin
What is the significance of the profit margin component in DuPont Analysis?
The profit margin component is critical as it examines a company’s ability to turn sales into profits. A high profit margin means the company can mint significant profits per every dollar of sales. This is a favorable sign for shareholders as the company will likely remain afloat over the long term.
How does asset turnover factor into DuPont Analysis?
Asset turnover represents how efficiently a company is leveraging its resources to register sales. A higher asset turnover ratio suggests optimal asset utilization, ensuring a positive ROE for shareholders.
What does the equity multiplier represent in DuPont Analysis?
The equity multiplier reveals how much debt a company is using to finance its operations. A higher equity multiplier indicates that a company is using more debt, which can be risky as it makes it susceptible to economic downturns and interest rate hikes.
Why is DuPont Analysis considered a comprehensive financial tool?
DuPont analysis goes beyond the surface-level assessment of financial performance, offering a deeper insight into a company’s strengths and weaknesses. It delves into finer details of profitability, efficiency, and financial leverage. Understanding these crucial ROE components helps investors better understand how a company is generating its profits. They can use this information to identify companies that are well-managed and likely to generate good returns in the future.
How can DuPont Analysis be applied to compare two or more companies?
You can apply DuPont analysis to compare the key growth drivers of various similar companies. After calculating ROE ratios, you can identify areas where one company is outperforming another. Moreover, you can monitor the financial performances of multiple firms over a certain period and compare the results for more accurate investment decisions.


