A Complete Guide to Elliott Wave Theory
- Updated on : May 23, 2026
- 5916 Views
- by Arun Singh Tanwar

 Facebook
 Instagram
 Youtube
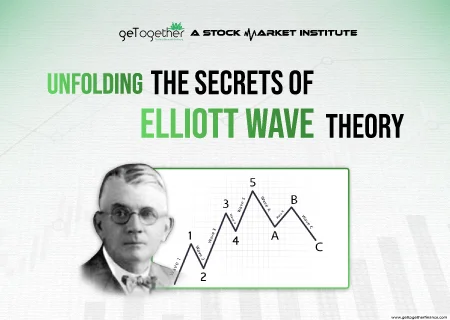
Overview
The financial markets, akin to the rhythmic ebb and flow of the ocean, show patterns that reveal a fascinating dance of investor sentiment. Among these patterns, the Elliott Wave Theory stands out as a fascinating tool for understanding market movements. Used for technical analysis of the stock market, the concept helps traders in exploring the market sentiments and psychology to create their trading strategy. But what is the origin of Elliott Wave theory, how does it work, and what is its interrelation with fibonacci retracement? Let’s dive into this concept without wasting a jiffy.
Origin of Elliott Wave Theory
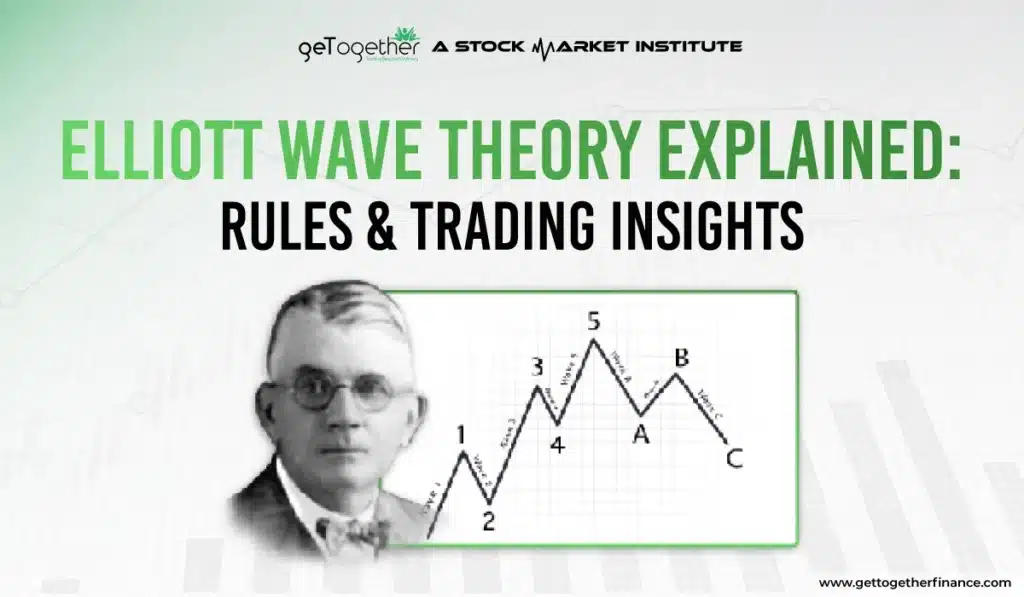
Back in the 1930s, American accountant and author, Ralph Nelson Elliott delved into market charts and noticed something interesting. After meticulously studying stock price data of over 75 years, he observed that the market moves in recognizable patterns. These patterns he refers to as ‘waves’. He further suggested that these predictable waves reflect the collective psychology of market participants.
Simply put, these waves show how people feel about buying and selling in the market.
Similar to Dow Theory, both theories recognize stock price movements in waves. However, the Elliott Wave Theory takes it a step further by revealing the “fractal” nature of markets. Fractals are the mathematical structures and market patterns repeating themselves on smaller levels, creating an organized and repeatable framework. Structured in the same way, the wave concept helps detect these repeating patterns and helps traders predict indicators of future market moves.
Note: It’s crucial to know that the Elliott Wave Theory is known for its predictive value. Those who follow the Elliott Wave Theory, often called chartists or Elliotists. They use these wave patterns to identify and predict stock price movements.
What is Predictive Value?
Predictive value means forecasting the market’s value by analyzing recognized patterns. It means that the methodology or approach used has the potential to provide insights into the likely direction or behavior of stock prices.
Types of Elliott Waves

In Elliott Wave Theory, there are two main types of waves: Impulse Waves and Corrective Waves. Let’s break down each type:
What is Impulse Waves?
Impulse waves are the strong, powerful moves in the direction of the main trend. These include the first five smaller waves and are commonly labeled as 1, 2, 3, 4, and 5. Among these, waves 1, 3, and 5 move in the direction of the trend, while waves 2 and 4 are corrective, representing temporary pullbacks. Impulse waves typically indicate the dominant force in the market.
What is Corrective Waves?
Corrective waves, as the name suggests, is the correction against the trend. They consist of three smaller waves and are labeled as A, B, and C. Corrective waves are a response to the former impulse waves. Wave A represents the initial counter-trend move, wave B is a partial correction, and wave C is the final move in the opposite direction. Corrective waves aim to balance out the preceding strong price movement. If the trend is upward, the corrective waves show bearish traits and vice versa.
Generally these waves are in triangles, diagonals, and zig-zag. Understanding these types of waves is crucial for Elliott Wave analysts, as it helps them identify the current market phase and anticipate potential future movements. Now let’s understand the theory a little thoroughly.
Understanding the Theory
Ralph Nelson Elliot studied 75 years of stock price data and spotted recognizable patterns in market charts, later famously known as Elliott Wave Theory. His groundbreaking work gained attention in 1935 when he accurately predicted a stock market bottom. Since then, thousands of portfolio managers, traders, and investors have embraced Elliott Wave Theory.
Elliott Wave International, the largest independent financial analysis and market forecasting firm. It depends on Elliott’s model for its market analysis and predictions. The essence of Elliott’s theory lies in identifying, predicting, and capitalizing on wave patterns. His rules, outlined in various books, articles, and letters, are compiled in “R.N. Elliott’s Masterworks,” published in 1994.
The theory concludes that markets move in recognizable patterns, which Elliott termed as waves. Understanding these waves becomes a valuable tool for interpreting market sentiment and psychology. At its core, the Elliott Wave Theory concludes that market trends unfold in a series of five impulsive waves followed by three corrective waves. These waves represent the natural rhythm of crowd psychology in buying and selling.
Also Read: Power of Open Interest
How Elliott Waves Work
Elliott Waves are not merely abstract concepts; they have practical implications for traders. Understanding wave patterns aids in predicting potential turning points, offering a roadmap for market analysis.
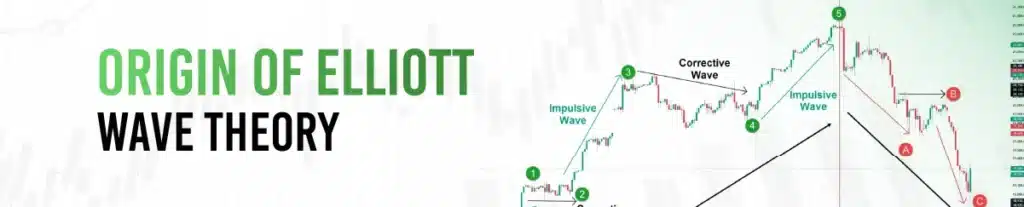
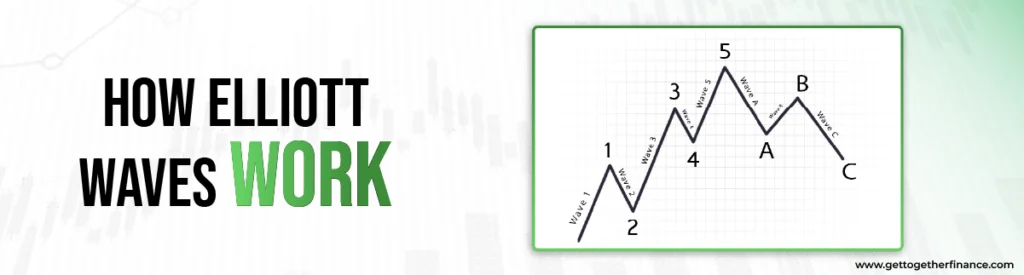
The Elliott Wave Theory works by identifying patterns in market charts, helping traders understand and predict market movements. For an instance, in an uptrend chart with 8 waves, the first five are motive waves, and the next three are corrective waves.
- Waves one, three, and five are primary movements, aligning with the primary trend.
- Waves two and four are corrections or retracements of these primary movements.
- A, B, C are considered corrective waves, labeled with alphabets. These waves show corrections in primary trends, showing a bullish trend.
The same principles/rules are applied in the downtrend but in vice versa. The theory is subjective and gives traders insights of the market trend and price movement.
Rule of Elliott Wave Pattern
Elliott Wave Theory has specific rules that are crucial for accurate interpretation. These rules serve as the basic foundations and must not be ignored for a precise understanding. Let’s take a closer look:
- Wave 2 should never retrace Wave 1 or touch the origin of Wave 1.
- Wave 3 can never be the shortest one, but it doesn’t mean that it should be the longest either.
- Wave 4 – The low of Wave 4 has to be higher than the high of Wave 1. Wave 4 cannot touch or invade the high of Wave 1.
Wave analysis is not like following a step-by-step guide. Instead, it gives you insights into how trends work and helps you understand how prices move. It’s not a strict set of rules but a way to see the dynamics of the market and make sense of how prices go up and down. Think of it as a tool to understand the patterns in the chaos of the stock market.
Subdivision of Elliott Wave Pattern
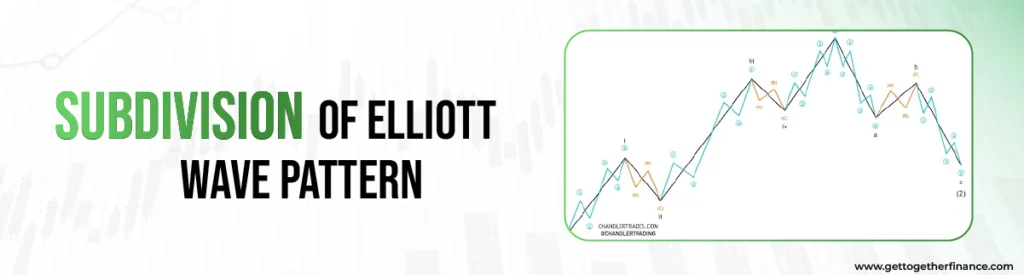
As shown in the above chart, the Elliott Wave Pattern can be subdivided into smaller waves, providing a more detailed breakdown of market movements. This subdivision allows analysts to examine the intricate dynamics within each wave, offering a comprehensive view of price actions. Whether observed on daily, weekly, or monthly charts, these subdivisions help identify the smaller components contributing to the larger wave patterns.
Elliott Wave Theory & Fibonacci Retracement

Elliott Wave measurements are like using special numbers from the Fibonacci sequence. This sequence is a set of numbers where each one is the sum of the two before it (0, 1, 1, 2, 3, 5, 8, 13, 21… and so on). These numbers have a cool connection to nature, math, and even the stock market.
Key Numbers:
- Golden Ratio: Around 1.618 (or 0.618), found by doing math with the sequence.
- More Numbers: Like 2.618, 0.382, 1.272, and 0.786, which are also found using the sequence.
Connecting to Waves:
- Wave 2: Often goes down between 61.8% and 78.6% of Wave 1. It might also be 38.2% or 50%. Usually, it goes down at least 50%.
- Wave 3: Often goes up to 161.8% of Wave 1. It could also be 127.2%, 200%, 261.8%, or 361.8%.
- Wave 4: Often goes down between 38.2% and 50% of Wave 3. Sometimes it might be 14.6% or 23.6%, but never below the top of Wave 1.
- Wave 5: Often goes up between 50% and 61.8% of the combined Waves 1-3. Also, it could be 161% of Wave 4 or equal to the length of Wave 1.
Remember these cool numbers—they show up a lot in Elliott Wave structures.
Elliott Wave Theory v/s Demand-Supply Theory
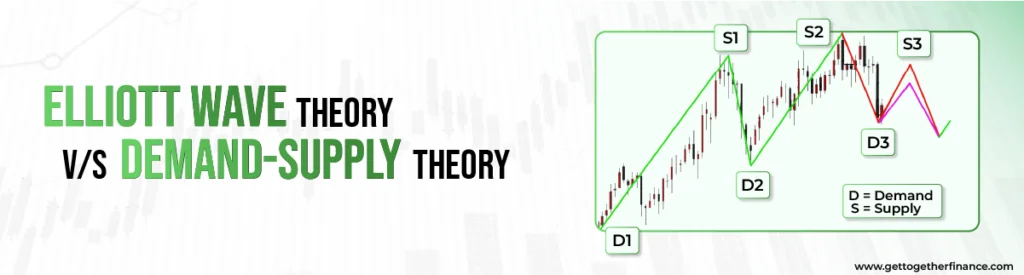
Elliott Wave theory helps in understanding the market’s mood and trader’s mindset. It tries to predict how the market will groove, but here’s the twist – you only catch the rhythm after the waves hit. But we all know – market dances funny – on its own beat. Its unique style sometimes makes interpreting Elliott Waves a bit tricky.
On the contrary, just like the dynamic duo of Kohli-Rohit, demand-supply traders ride with confidence when they spot the Elliott Wave pattern. Using this approach, traders can anticipate zones that trigger a bounce or drop of any stock’s price. Following the demand-supply theory, trading geeks can discover the origin story of Elliott wave patterns. The bottom wave? That’s the demand zones doing their thing. The higher curve? That’s the supply zones stealing the spotlight. And it is suggested to equip yourself with both theories and watch the market drama unfold.
What Does Critics Say
Critics of the Elliott Wave Theory argue that it’s not a foolproof method for predicting the stock market. They see it as too flexible and open to interpretation, leading to different analyses from different experts. Critics also point out that real-world events can disrupt the neat wave patterns the theory depends on. In essence, while some find it intriguing, others doubt its effectiveness in providing reliable predictions.
Conclusion
Elliot’s wave theory helps traders to understand market psychology rather than relying only on indicators. Although it requires practice and experience, it offers valuable insights regarding how the market moves. When combined with risk control and technical tools, it becomes a real trading strategy instead of just theory. Traders who learn and practice this method can make better and more confident trades.
FAQs
What is the Elliott Wave Theory?
Introduced by Ralph Nelson Elliott, the theory is a method to predict stock market trends by assessing repetitive long-term wave patterns based on investor psychology.
How Do You Trade Using Elliott Wave Theory?
Trading with Elliott Wave involves identifying wave patterns and making predictions based on the theory’s rules, helping traders make informed decisions. It helps traders or investors look beyond the market sentiments and make informed decisions when it comes to investing.
What Fibonacci Level Is the Elliott Wave?
Elliott Wave Theory uses Fibonacci ratios (like 61.8%, 50%, and 38.2%) to identify potential reversal or extension levels in market trends.
What Are the Disadvantages of Elliott Wave?
Critics argue that Elliott Wave Theory can be subjective, open to interpretation, and may not account for unexpected events affecting market patterns. Like any other theory, this is not foolproof and traders should back-up their findings with more reliable concepts like demand-supply dynamics to make more informed investing decisions.
How Do You Study the Elliott Wave?
Studying Elliott Wave involves learning its rules, understanding wave patterns, and applying the theory through practice and analysis. Bob Prechter, the founder of Elliott Wave International, focuses on understanding how groups of people act when it comes to buying and selling stocks.
What is the difference between Dow’s theory and Elliott Wave Theory?
Dow’s Theory focuses on trends and market movements, while Elliott Wave Theory specifically identifies repetitive wave patterns based on psychology. Besides, wave analysis breaks down the findings into fractals.
How important is Elliott Wave Theory?
While intriguing, the importance of Elliott Wave Theory is subjective; some find it valuable, while others question its reliability in predicting market trends. It depends on traders’ personal preference and understanding whether they want to opt the method or choose to not rely on it completely.
How to apply the Elliott wave theory?
Applying the Elliott Wave theory involves using technical analysis. Look for an upward or downward trend. Spot the impulse waves, and anticipate a potential reversal after five complete waves. Based on the market movement and your strategy, you can then make decisions on when to enter or exit a trade.


