Hanging Man Candlestick Pattern: Definition & Trader Tips
- Updated on : March 27, 2026
- 2638 Views
- by Manaswi Agarwal

 Instagram
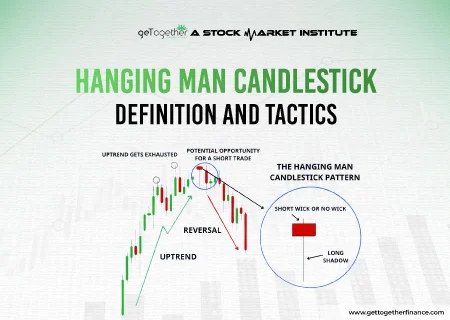
In technical analysis, as we all know candlestick patterns play a vital role in deciphering price movements in security. Traders can analyze a bundle of candlestick patterns and still the list would go on. So here with this blog, we will understand the depth of the hanging man candlestick pattern with its significance and importance in the stock market.
What is the Hanging Man Candlestick Pattern?
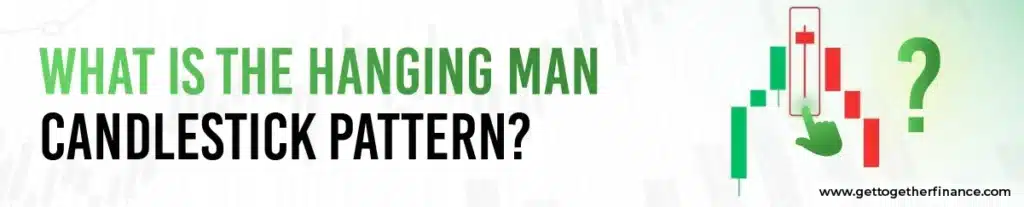
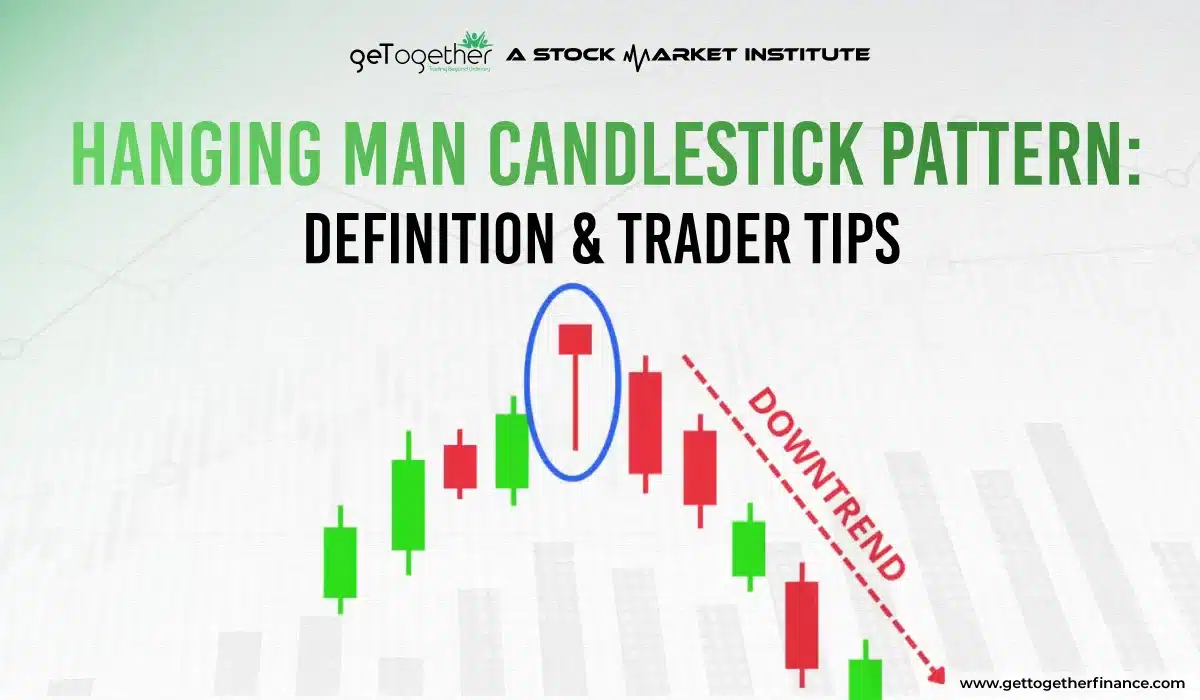
Hanging Man Candlestick Pattern is a technical chart pattern analyzed through candlesticks that signal a potential reversal in uptrend i.e. Bearish Reversal Pattern. The hanging man pattern develops during an upswing, where the buyers are active and hence make higher highs but after the occurrence of the pattern, traders get the warning of upcoming selling pressure in the security.
The candlestick resembles a man hanging upside down. It is determined by a small body at the top of the trading range and a long lower shadow. This indicates an increased selling pressure in the security to outweigh the buying momentum.
Hanging man candlestick pattern is a tale of market sentiments that represent the waning of buyers. A base candle after an ongoing uptrend warns buyers as the market becomes cautious or bearish because sellers find an opportunity to push back, testing the strength of the uptrend. This represents a shift of trend from buyers to sellers that also highlights the importance of vigilance in trading.
How to Identify Hanging Man Candlestick Pattern in Technical Analysis?
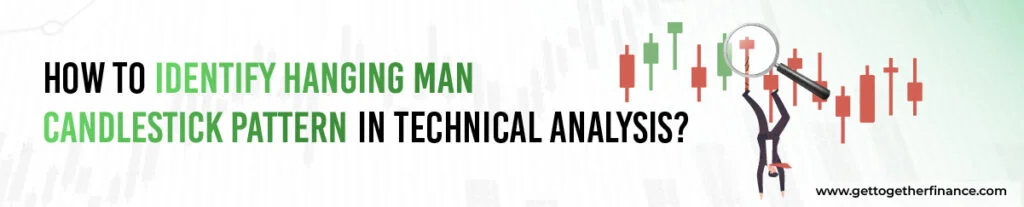
The Hanging Man pattern on the charts is a strong pattern to predict a reversal in security. Look for an uptrend in the security, when the price forms a small body with a lower long shadow which is twice the body, indicating a minimal price movement during the trading session.
Therefore; non-existent upper shadow, small body, closing near the top, lower long wick are the characteristics to depend on while finding out the hanging man candlestick pattern. However, the pattern is not confirmed until the price falls in the next trading session, the price ought not close above the high of the hanging man candle to continue the bearish move in the next trading session. If the prices fall, the pattern is confirmed which gives traders a signal to manage their position.
Read More – Outside Reversal: How does it work in Technical Analysis?
Is Hanging Man bullish or bearish?

The hanging man signifies a bearish reversal pattern as it forms after a continued uptrend in security. You can go short in the security when you identify a hanging man upside-down candle on the charts.
Can the Hanging Man Pattern fail?
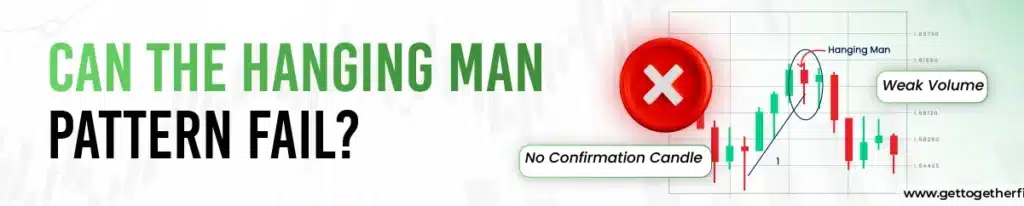
Yes, the hanging man candlestick patterns can fail, although it is a bearish reversal signal; if the buyers remain strong, then the market will continue to go upward. A hanging man pattern is not guaranteed trend reversal; it only notifies that selling pressure comes into the market.
There are various reasons through which a hanging candle can fail, which include
- Weak Volume
- Strong Uptrend Momentum
- No Confirmation Candle
- Support Level near the Pattern
Pro Tip: Always wait for a clear signal and don’t trade hastily. A hanging man candle gives the best outcomes with discipline.
Ideal Conditions for the Hanging Man pattern
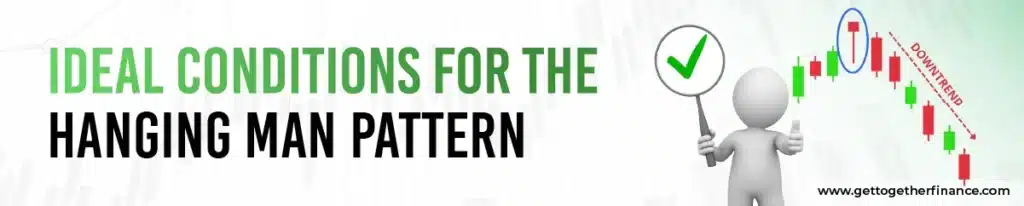
The hanging man candlestick pattern becomes more powerful when it appears in a strong bullish market and is showing signs of slowing down. Its influence rises when the price has already gone up and is reaching a crucial supply zone, trend line top, and resistance level, where new sellers generally enter the market. The pattern is stronger with high volume because it presents real selling, not just a normal pullback. Moreover, a hanging man candlestick formation is more reliable when it forms near a major resistance, after an uptrend, and with indicator and volume confirmation.
Hanging Man vs Other Bearish Patterns
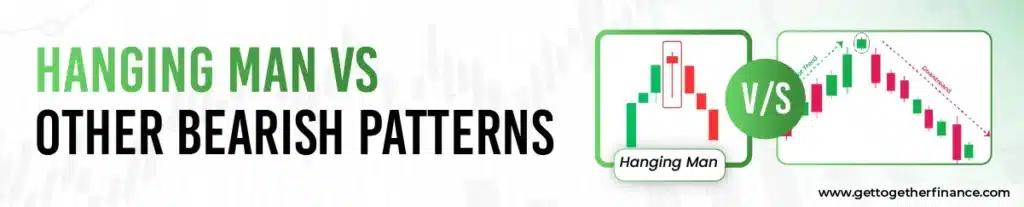
The Hanging Man, Shooting Star, and Evening Star are all bearish reversal patterns, but they indicate weakness in different ways. Let’s discuss it properly from the table below:
| Features | Hanging Man | Shooting Star | Evening Star |
| Number of Candles | 1 | 1 | 3 |
| Type of Pattern | Bearish reversal | Bearish reversal | Bearish reversal |
| Shape/Key Shadow | The hanging man candlestick pattern has a small body or a long lower shadow. | Shooting Star has a small body or a long upper shadow. | In the evening star, there are 3 candles: a strong bullish candle, an indecisive or small candle, and a strong bearish candle |
| Where it Forms | After an uptrend | After an uptrend | After an uptrend |
| Strength of a Signal | Moderate | Stronger than a Hanging Man | Most reliable and strong |
| Main Message | Sellers pushed the price down, but buyers pulled it back up, which indicates early weakness in the uptrend | Buyers failed to push the price up, but failed immediately | It shows that buyers are losing control and sellers are taking over across 3 candles |
| Confirmation Needed | Yes, have to wait | Recommended but not always necessary | The reversal is clear because the patterns form over 3 candles |
Which Indicators Best Confirm a Hanging Man Signal?
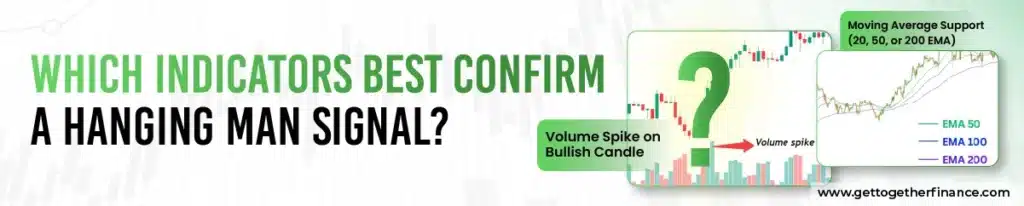
A hanging man candlestick formation is a bearish reversal candlestick that forms after an uptrend. To verify whether sellers are truly taking control, traders use indicators such as Volume, Moving Averages, Trendlines, and RSI. Let’s understand this properly from the table below:
| Rank | Indicator | Why it’s a Strong Confirmation Tool |
| 1 | Volume | If the hanging man form with high volume, then it indicates that several sellers actually entered the market during that candle. This indicates real selling pressure |
| 2 | RSI | The pattern becomes more trustworthy if the RSI displays an overbought zone above 70 and bearish divergence |
| 3 | Trendlines | It confirms resistance and supply zones, and if it is located on horizontal resistance and a trendline, then it makes the pattern more trustworthy |
| 4 | Moving Averages | Moving Averages help in checking trend change. After the hanging man, if the next candle closes below a short-term MA (like 10-20 MA), it supports a trend reversal. If the price remains above the MA, then the reversal may be weak. |
Pro Tip: A hanging man candlestick formation with high trading volume indicates strong selling pressure. Low volumes resulted in a false signal.
Trading with Hanging Man Candlestick Pattern
To trade the hanging man candlestick pattern with efficiency, consider the following:
Identify the Pattern
Look for the formation of uptrend in the security which is followed by the hanging man candle with dangling legs that respects the supply zone.
Confirmation
Receive the confirmation of the pattern when the price continues to fall in the next trading sessions. If buyers are able to sustain in the security breaching the high of hanging man candle, the pattern, the trade gets rejected. So confirm the trend with a potential reversal signal.
Entry or Exit Points
Once the confirmation of the pattern is received, traders exit for the long positions and enter into short positions. The stop loss order for the short position is placed above the high of the hanging man candle to avoid losses if the trade goes in the opposite direction. Be careful and manage your risks through stop loss as it defines an opposite direction of the trade. A proper risk management protects your capital and helps you to sustain the market in negative situations.
Demand and Supply
You can get better results when you trade the hanging man candle pattern associated with the demand and supply approach. When the pattern coincides with the supply zone, the credibility of the pattern increases as it strongly indicates a bearish reversal in the security. A supply zone of the higher time frame is more reliable when associated with this pattern.
Not only this, you can efficiently manage your risks by placing the stop loss order above the supply zone. Hence, demand and supply theory is one viable approach to protect your capital and gain maximum returns with calculated risks.
Complete Hanging Trading Setup
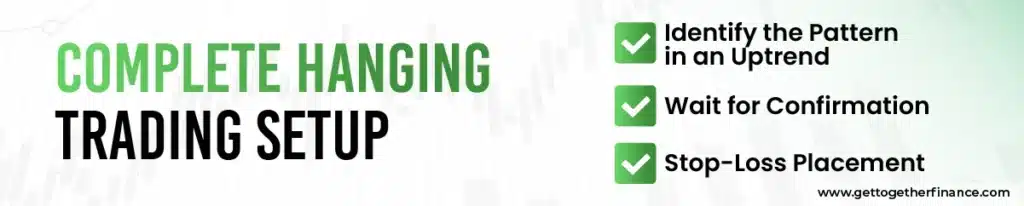
The hanging man candlestick pattern only becomes powerful when used with risk management, proper entry, stop loss, and confirmation.
A complete trading plan is given below:
Step 1: Identify the Pattern in an Uptrend
When identifying the hanging man candlestick formation, a trader has to make sure that the pattern appears during an uptrend, especially near the supply zone, resistance, or the top of a trendline. Furthermore, the candle should also have a long lower shadow and a small body.
Step 2: Wait for Confirmation
After detecting a hanging man candlestick pattern, traders don’t have to enter the trade immediately. They always have to wait to confirm selling pressure.
Step 3: Entry Rule
A trader always has to enter the trade only in 2 conditions:
- On a break below the hanging man’s low.
- Only after confirmation candle closes.
Step 4: Stop-Loss Placement
To avoid losses from false signals, traders have to place a stop-loss above the high of the hanging man candle. Also, you can place it a little higher with the help of an ATR buffer. Moreover, it provides a little extra space so that your stop-loss does not hit too early when the price suddenly spikes.
Step 5: Risk Management
Risk Management is very important to protect your money while trading. For this, you have to follow some simple rules, like:
- Take risk only for 1%-2% of your total account on one trade.
- Traders have to make sure that the reward is twice the risk.
Step 6: Target/Exit Strategy
Traders can exit when:
- RSI reaches oversold (below 30)
- Price hit the next support zone.
- Price touches 20/50 MA or trendline support.
Difference between the Hanging Man and the Hammer pattern?
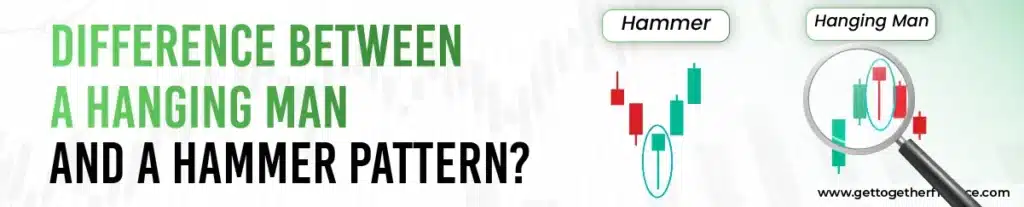
Let’s discuss it properly from the given table:
| Features | Hanging Man Pattern | Hammer Pattern |
| Signal Type | Bearish reversal | Bullish reversal |
| Trend Location | Forms at the top of a trend | Forms at the bottom of a trend |
| Confirmation Needed | Need strong bearish confirmation | Need bullish confirmation |
| Market Message | Buyers push the price higher, but sellers take control, so the price may decrease | Sellers lower the price, but buyers strongly come in, so the price may increase |
| Psychology | It shows that buyers become weak after the price increases | It shows that buyers are becoming stronger after the price decreases |
In short, hanging Man is quite similar to Hammer pattern while often leads to confusion among traders. A hammer pattern emerges in a falling trend which signals a bullish reversal in the security, conversely, the hanging man pattern appears in a rising trend indicating a bearish reversal.
Both of them look similar, but the formation is in a different direction. The prior move or the short-term trend distinguishes these two candlestick patterns.
Benefits of Hanging Man Candlestick Pattern
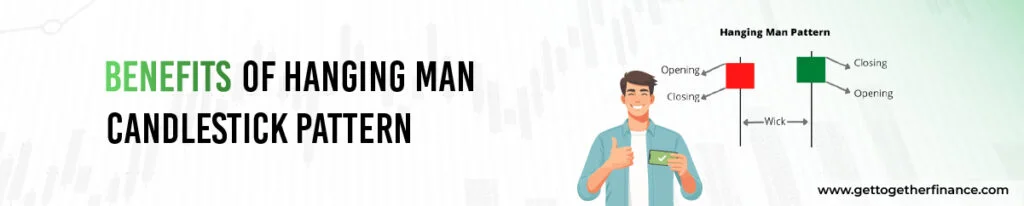
In technical analysis, hanging man candlestick patterns offer various benefits to the traders as they can trade with appropriate risk management activities.
Early Reversal Signals
The formation of the hanging man pattern suggests a potential reversal in the security quite earlier than the actual reversal starts. The candle strongly represents that buyers are waning which leads sellers to gain control over the security.
Wide Usage
The hanging man pattern can be used in a variety of financial markets that include stocks, forex and commodities. The technical pattern offers versatility to the traders to make successful use of this tool in financial markets.
Entry and Exit Points
There are clear and defined entry and exit points for traders that guide them when to buy and when to sell the asset keeping their risks aside.
Limitations of Hanging Man Candlestick Pattern
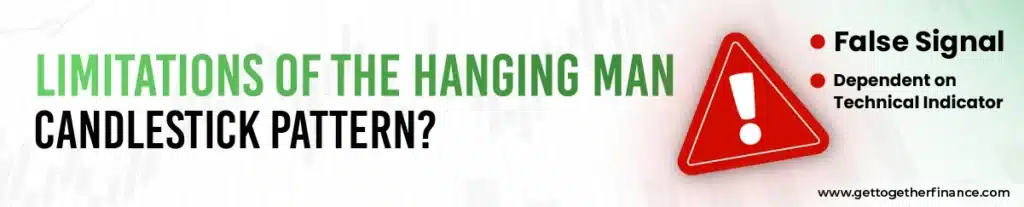
Like other technical chart patterns, hanging man candlestick pattern also has various drawbacks that must be carefully looked upon:
False Signal
The pattern might provide false signals sometimes as none of the patterns in technical analysis can be accurate. There are no defined target points which does not allow you to enjoy maximum profits in a chart. To exit at the target, it is preferable to associate with demand and supply theory and enjoy maximum returns.
Dependent on Technical Indicator
Relying solely on hanging man candlestick patterns is not recommended to trade as to increase the efficiency and reliability of trade, they have to take support of other technical indicators so that they can avoid losses.
Demand and Supply with Hanging Man Pattern
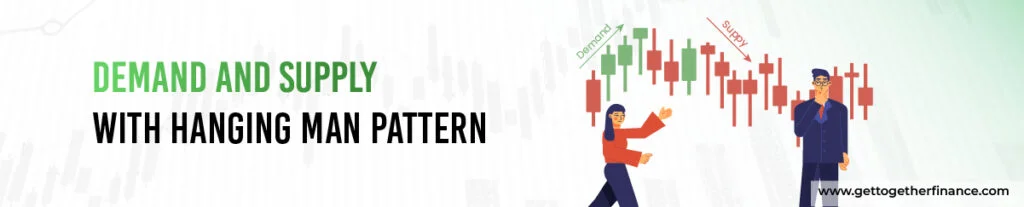
As we know, demand and supply is the base concept which drives buying and selling of securities in the market. Trades executed without the support of demand and supply zone can turn out to be a blunder and hence this needs to be avoided. To trade hanging man patterns, you must look for the supply zone with support of higher time frames. You can stay confident when you approach through demand and supply theory as you follow proper risk management techniques with entry, exit and targets.
Conclusion
The hanging man candle which looks like a man upside-down represents a bearish reversal in the security. To know how to trade efficiently through the demand and supply approach, you can watch the free Trading in the Zone course available on YouTube offered by GTF that is far more reliable and efficient.
FAQs
What is the Hanging Man Candlestick Pattern?
A hanging man candlestick pattern is a bearish signal that warns buyers to exit their long positions.
How to recognize Hanging Man Candlestick Pattern?
The hanging man candlestick pattern occurs after an uptrend represented by a candle with a small body and long lower shadow.
Can I use other technical indicators with a hanging man candlestick pattern?
Yes, using other technical analysis indicators increases the credibility of the pattern, on top of it, demand and supply is one of the best to consider.
How accurate is the hanging man pattern?
The accuracy of this pattern depends on a trader’s individual strategy. It is most reliable when using a demand and supply strategy.


