
How to Develop a Live Market Reading Habit as a Trader?
- Updated on :
- 24 Views
- by Juhi Sharma

 Instagram
 Linkedin

Many traders want to know how to read live stock market movements, yet very few develop the ability to read it effectively. They monitor price movements, follow indicators, and track multiple stocks throughout the session. However, when market conditions change, they often struggle to understand what is actually driving the move.
The reason is simple. Watching the market and reading the market are not the same skill.
Watching only tells you where price is moving. Reading helps you understand why the price is moving and what that behaviour may indicate next. The good news is that market reading is a skill that can be developed through a structured process. It does not require advanced indicators or complex strategies. It requires consistency, observation, and the willingness to study the market with intent.
Whether you are learning how to read live stock market movements for the first time or looking to improve your existing trading routine, developing a live market reading habit can significantly improve your decision-making process.
In this guide, you will learn what market reading actually means and what trading habits for beginners look like in practice.
Why Do Most Traders Watch the Market But Don’t Actually Read It?
We know that most traders spend significant time in front of charts, yet many struggle to improve their decision-making. The issue is rarely a lack of effort. Instead, the problem usually lies in how that screen time is being used.
Watching the market is a passive activity. A trader observes price movements, monitors indicators, and checks multiple stocks throughout the session. While this creates the impression of learning, very little understanding is actually being developed.
But in reality, reading the market requires a different approach. Rather than focusing only on where price is moving, a trader focuses on understanding the behaviour behind the move. Every breakout, rejection, pullback, and volume expansion becomes a source of information.
For example, consider a stock approaching a major resistance level. A trader who is simply watching may notice the breakout after it occurs. A trader who is reading the market will observe how price behaves near the level, whether volume increases, and how buyers respond during the test.
This difference may appear small, yet it has a significant impact on trading performance. Market reading helps traders identify strength, weakness, momentum, and participation before the move becomes obvious to everyone else.
The trader who asks questions throughout the session develops faster. Why did buyers become active at this level? Why did volume increase suddenly? Why did one sector outperform the broader market? Questions like these transform observation into learning.
In short, developing a live market reading habit begins with recognising this distinction. Success does not come from watching more charts. It comes from learning how to extract useful information from the charts you already watch.
What “Reading the Market” Actually Means (It’s More Than Watching Charts)
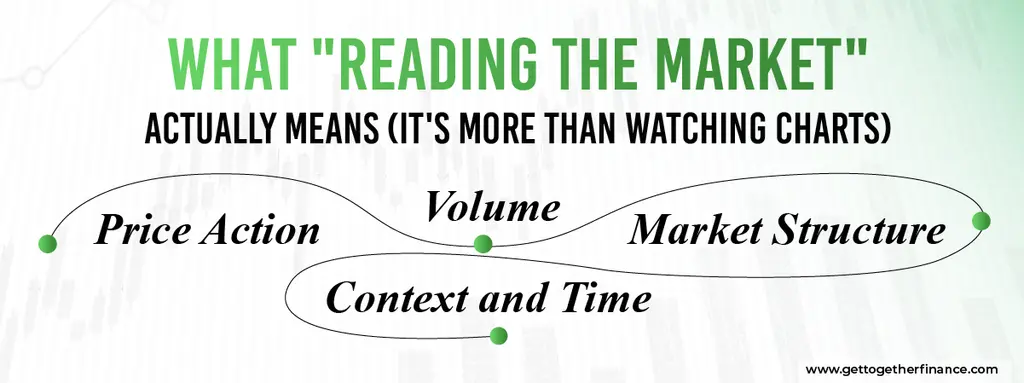
Market reading is something that goes beyond the identification of chart patterns and only tracking the movements of price. While those skills are important, they represent only one part of the process. Reading the market means understanding the information hidden behind price action. Here’s what it actually looks like in practice:
Price Action
Price action forms the foundation of market reading. It reveals how participants react at important levels and whether momentum is strengthening or weakening. A strong bullish candle near support often carries a different message than the same candle near a major resistance zone.
Volume
Volume adds another layer of understanding. Price can move in any direction, but volume helps measure the conviction behind that move. When price rises alongside increasing volume, participation is often stronger. When price moves without volume support, the move may lack strength.
Market Structure
Market structure is equally important. Traders should learn to identify whether the market is trending, consolidating, or reversing. Understanding the broader structure prevents traders from making decisions based on isolated candles or short-term noise.
Context and Time
Context also plays a major role. The same setup can produce completely different outcomes depending on overall market conditions. A breakout during a strong trending session often behaves differently from a breakout during a range-bound market. At the same time, traders should pay attention to sector performance and market participation. Strong moves become more reliable when supported by broader market strength. When multiple stocks within the same sector begin moving together, it often signals increased institutional interest.
The Key Elements to Observe During Live Market Hours
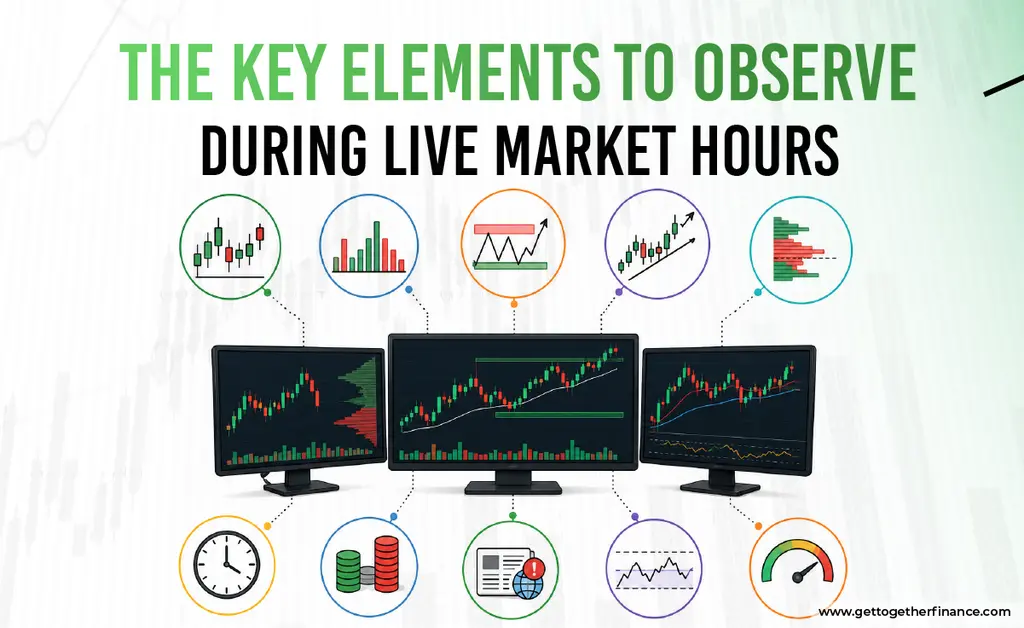
Developing the skill of how to read live stock market activity starts with knowing what deserves your attention. Many beginners attempt to monitor everything at once. As a result, they become overwhelmed by information and struggle to identify what actually matters. A more effective approach is to focus on a few important elements consistently.
Opening Range Behaviour
The first thirty minutes often provide valuable information about market sentiment. Observe whether the market accepts the opening direction or quickly reverses. A gap up that continues higher sends a different message than a gap up that immediately attracts selling pressure. The opening range frequently establishes important reference points for the rest of the session.
Key Support and Resistance Levels
Price levels become meaningful because traders react to them. Instead of focusing only on the level itself, observe how price behaves when it reaches that area. Strong rejection, hesitation, or aggressive buying activity can provide useful clues about market strength. The reaction often matters more than the level.
Volume Behaviour
Volume should always be analysed alongside price. When price moves higher and volume expands, participation is increasing. When price rises while volume declines, enthusiasm may be fading. Large volume spikes often deserve additional attention because they can indicate institutional activity.
Relative Strength and Relative Weakness
Some stocks remain strong even when the broader market struggles. Others begin weakening despite positive market conditions. Identifying these differences helps traders understand where money is flowing during the session. Strong stocks often continue attracting attention, while weak stocks frequently remain under pressure.
Sector Performance
Sector analysis provides valuable context for individual stock movements. For example, if banking stocks, financial stocks, and related indices are moving higher together, the probability of sustained strength often increases. Sector leadership frequently reveals where institutional participation is concentrated.
How to Structure Your Live Market Observation Sessions?

One of the most important trading habits for beginners is structuring your observation sessions instead of spending hours in front of charts without a clear process. Focusing on a structured observation routine helps traders focus on the information that matters most during market hours.
Before the Market Opens
Preparation begins before the opening bell. Review your watchlist, identify important support and resistance levels, and note any major news events that could influence market behaviour. This preparation provides a framework for the session and reduces unnecessary decision-making during live market hours. It is also helpful to write one simple market expectation before the session begins.
For example, you may expect Bank Nifty to remain strong if it holds the previous day’s high. The purpose is not to predict the market perfectly. Instead, it encourages active observation throughout the day.
The First Thirty Minutes
The opening phase often contains the most volatility. Here you’ll notice how price reacts to overnight developments, global market activity, and pending orders placed before the session begins. Therefore, rather than rushing into conclusions, focus on observing how the market responds during this period.
Pay attention to whether buyers or sellers are controlling the opening range. Observe whether gaps are being accepted or rejected. These early clues often reveal important information about market sentiment.
The Mid-Session Period
The middle portion of the trading day is usually more stable. This is often the best time to study market structure, sector strength, and relative performance. Observe which stocks continue showing strength and which begin losing momentum. Notice whether volume remains consistent or starts declining.
The Final Hour
The final hour deserves special attention. Institutional participants often adjust positions before the market closes. As a result, important trends may strengthen while weaker moves begin fading. Observe whether the market is closing near the highs, near the lows, or within a range. Closing behaviour frequently provides useful information for the next trading session.
Post-Market Review
The most important phase after the market ends is to ensure that the learning process continues after the market closes. Spend ten to fifteen minutes reviewing the day’s behaviour. Compare your observations with the actual outcome. Identify anything that surprised you and note any patterns that appeared repeatedly. This review process transforms observation into experience.
Building a Pre-Market Prep Routine That Sets You Up to Read Better

Your ability to read the live market is directly proportional to how well you’ve prepared before it opens. A strong pre-market routine is the foundation of the live market reading habit.
Step 1: Review overnight and pre-market activity
Global markets often influence local sentiment. Review major international indices, overnight developments, and any important events that occurred while domestic markets were closed. This step helps establish a broad understanding of market conditions before trading begins.
Check futures markets (S&P 500, Nasdaq, Dow). Are they up or down significantly? Is there major news driving the direction?
Step 2: Identify your watchlist for the day
Narrow your focus to five to ten stocks or instruments. Trying to track everything is a recipe for distraction. Quality beats quantity in market observation.
Step 3: Mark key levels on your charts
For each stock on your list, mark the previous day’s high, low, and close. Add any obvious support or resistance zones. This gives your eye an anchor during the live session.
Step 4: Note upcoming catalysts
Check the economic calendar for data releases (CPI, Fed minutes, employment reports). Check for any earnings announcements within your watchlist. Surprises are easier to digest when you half-expect them.
Step 5: Set your mental framework
Ask yourself: is the overall market in a risk-on or risk-off mode? Are we in a trending or range-bound environment? Having a directional bias (even a loose one) helps you filter out noise during the session. Fifteen to thirty minutes of focused pre-market prep will dramatically improve the quality of your live market observations.
Tools and Resources That Help You Read the Market in Real Time

Developing strong market reading habits depends more on observation than technology. However, the right tools can make the learning process significantly easier.
For Chart Reading
When it comes to charting, two platforms stand out for Indian retail traders — TradingView and Trade Tiger. TradingView is widely used for its clean interface, multi-timeframe charting, drawing tools, and watchlist functionality that makes structured observation straightforward. Another one is Trade Tiger, offered by Sharekhan, which is a powerful desktop-based platform built specifically for the Indian market. It provides real-time data feeds, advanced order execution, and detailed charting tools.
For Stock Screening
Identifying the right stocks to observe and trade requires a capable screening tool. Three platforms are worth knowing well. Firstly, GTF Eye, developed specifically for GTF traders, takes a different approach by identifying stocks that are approaching or already within demand and supply zones, as per GTF’s framework.
Second, ScanX is another screener that supports complex multi-condition scans with speed and precision, making it ideal for traders who have specific rule-based criteria. Third, Chartink is also one of the free screeners for Indian traders, allowing you to filter stocks based on technical conditions.
For News and Events
Staying informed is a non-negotiable part of reading the live market accurately. For Indian traders, Moneycontrol and The Economic Times are the two most reliable sources for market news, corporate announcements, policy updates, and macro developments. Make it a habit to scan both before the market opens and during major intraday moves.
For Market Replay and Review
One of the most underused yet highest-value tools in a trader’s live market reading habit kit is market replay. TradingView’s bar replay feature allows you to rewind any chart to a specific date and time and replay price action candle by candle. Equally important for Indian traders is studying options data, specifically open interest (OI) and options volume, which can be accessed through platforms like Sensibull or NSE’s own options chain.
Read More: TradingView vs GTF Eye
The 21-Day Live Market Reading Habit Challenge: A Practical Habit Builder

Building a live market reading habit isn’t about motivation; in fact, it’s about structure. At GTF, this journey begins with the Trading in the Zone Elementary Course, a program specifically designed to give traders the foundational tools they need to read markets with clarity and confidence.
The course runs across 20 live sessions, each one focused on a specific element of market reading, from understanding price action and volume to identifying demand and supply zones, reading market structure, and applying GTF’s rules-based approach to stock selection and trade execution. By the end of the 20 sessions, you won’t just understand the theory; you’ll have a concrete set of rules and a clear methodology to apply every single day.
The real transformation, however, happens in the 90 days that follow. After completing the course, students are strongly encouraged to dedicate the next 90 days entirely to structured practice. The core exercise during this period is daily scanning of stocks within the Nifty 500, strictly as per rules.
This 90-day practice window is where the live market reading habit truly forms. The repetition of scanning the same universe, applying the same rules, and reviewing the same types of setups every day builds the kind of mental database that no course alone can create. By the time the 90 days are complete, you won’t be asking “does this qualify?” for every setup you see; you’ll know.
Mistakes to Avoid When Developing Your Market Reading Skill
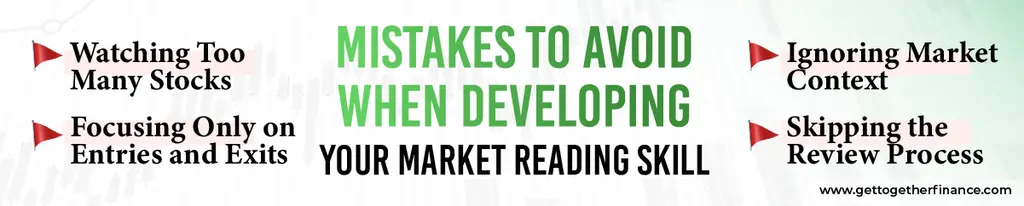
There are a handful of mistakes that stall progress for nearly every trader trying to build trading habits for beginners. Here are a few of them:
Watching Too Many Stocks
Many beginners believe that monitoring more stocks will help them learn faster. In reality, the opposite often happens. When you track too many charts, your attention becomes scattered. Instead, focus on a small group of stocks and observe them consistently. Over time, you will begin noticing recurring behaviour, reactions at key levels, and common price patterns.
Focusing Only on Entries and Exits
Most traders pay attention only when they are planning a trade. As a result, they miss valuable information during the rest of the session. Market reading is about understanding behaviour throughout the day. The more you observe trends, pullbacks, consolidations, and reversals, the better your analysis becomes.
Ignoring Market Context
A stock rarely moves in isolation. Sector performance, index direction, and overall market sentiment often influence individual stocks. Analysing a stock without considering the broader market can lead to incomplete conclusions and poor decisions.
Skipping the Review Process
Observation alone is not enough. Improvement happens when observations are reviewed and analysed. Without reviewing your notes, many important lessons are forgotten. A simple post-market review can help identify recurring patterns and strengthen future decision-making.
Relying Too Much on Indicators
Indicators can support analysis, but they should not replace observation. Traders who depend entirely on indicators often overlook important clues in price action and volume behaviour. Learning to read the market directly creates a stronger foundation for long-term growth.
Expecting Immediate Results
Market reading is a skill that develops gradually. Many traders become frustrated because they expect rapid improvement within a few days.
Final Words
Building the habit of how to read live stock market conditions is one of the highest-leverage investments you can make as a trader. Start with structure, stay consistent, and trust that the skill compounds over time.



