
Descending Tops Pattern: Meaning, How to Identify It and Trade It in the Indian Stock Market
- Updated on :
- 9116 Views
- by Arun Singh Tanwar

 Facebook
 Instagram
 Youtube
 Linkedin

Overview
There’s a good chance you’ve come across the words “descending” or “ascending,” but what do these patterns mean when they appear on a candlestick chart? A descending tops pattern is like a red flag waving in the market because it indicates the price is rotating down. This pattern occurs when every high or peak reached within a price is lower than the previous ones, indicating that the sellers are in charge and driving prices lower.
In this article, we will cover the descending tops pattern thoroughly, together with its drawbacks and how to recognize and interpret it in relation to the direction of price change in the future. So without any delays, let us start.
What Is the Descending Tops Pattern in Technical Analysis?

The Descending Tops pattern in the stock market is a price action pattern where each new high is lower than the previous one. It is also known as a series of lower highs. When the highs of this pattern are connected, they create a downward-sloping trendline.
The pattern indicates that buyers are losing control, and the price may decline. To confirm market direction before making a trading decision, traders use the descending tops pattern alongside other technical analysis tools, such as demand and supply zones. It often appears during a downtrend and helps traders identify continued selling pressure in the market.
How the Descending Tops Pattern Forms on a Chart: 6 Steps
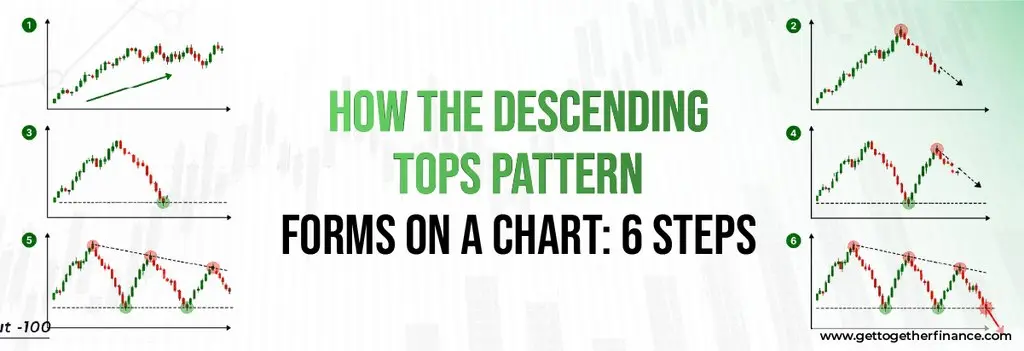
The Descending Tops pattern in the stock market is an important indicator of market weakness, often suggesting that the price may continue to decline. It forms when the price attempts to rise but consistently fails to reach the previous peak. Here’s how this pattern typically develops:
1. Initial Uptrend or Sideways Movement
The pattern often begins after an uptrend or a period of sideways movement, where the market is trying to push higher but starts facing resistance. At the institutional level, big players start booking profits or pulling back their positions.
2. First Top
The price reaches a high point, known as the first peak, but then starts to decline. This hints that the buying momentum is dropping, and sellers have started to take control. At this price level, big investors usually sell some of their shares to earn a profit. This selling makes it difficult for the price to rise further, which creates resistance.
3. Retracement or Pullback
After reaching the first peak, the price falls back as sellers take control. Although buyers try to push the price up again, their efforts are weaker than before. In this phase, big investors keep selling their shares every time the price rises slightly. Because of this constant selling, the price doesn’t get a chance to fully recover.
4. Second Peak
The price rises again, but this time it doesn’t reach the same height as the first high. This lower peak signals that the market is losing momentum.
5. Subsequent Lower Peaks
The price keeps trying to rise but falls short each time, creating a series of lower highs. This pattern shows that the market is struggling, with buyers unable to push prices higher.
6. Confirmation or The Big Drop
The pattern is confirmed when the price drops below a key support level, suggesting the market is likely to continue downward. This breakdown pushes many big investors to sell even more shares, which increases the selling pressure and forces the price further down.
How to Identify Descending Tops on a Chart: 5 Simple Steps
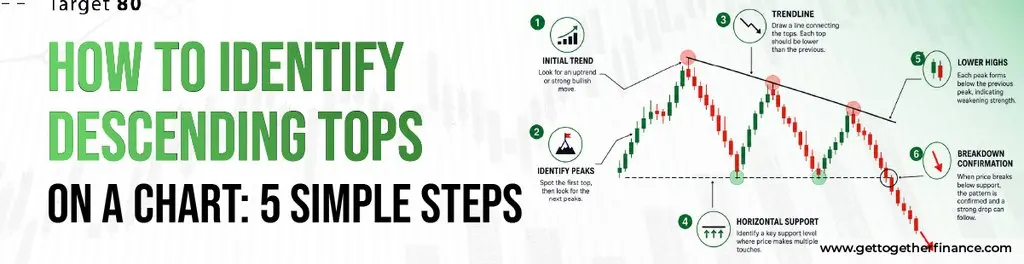
When you know what to look for, it becomes easy to identify the descending tops pattern in the stock market. You’ll see this pattern when each high is lower than the previous one, signaling weakening buying strength. By following these simple steps, you can spot the pattern on a price chart:
1. Draw a Trendline: Connect the swing highs with a trendline. This should form a downward slope, showing that each bounce is losing strength.
2. Check for Lower Highs: Every new high should be lower than the last one. This means buyers are losing power, and sellers are taking control.
3. Look for at Least 2–3 Lower Highs: Two highs are not enough to confirm the pattern. Traders need to wait for 2–3 lower highs before trusting it.
4. Watch the Volume: When each new top forms, volume generally goes down. This means fewer people are buying, and the price isn’t rising as strongly as before.
5. Confirm with a Support Break: When the price breaks below the nearest support level, only then is the pattern confirmed. This signifies that sellers have taken over, and the market could fall further.
Descending Tops vs Descending Triangle Pattern: What Is the Difference?

Both the Descending Tops and Descending Triangle patterns look similar because both show a series of lower highs. That’s why it is important to understand the difference between these two patterns.
| Features | Descending Tops | Descending Triangle |
| Definition | A pattern where the price forms a series of lower highs | A pattern with lower highs and a flat support level |
| Support Level | There is no fixed support level. The price may create different lows | Before breaking out, the price tests the same support level multiple times |
| Reliability | This becomes reliable when used along with support levels, volume, or other technical tools | This is usually more reliable because the support level gives a clearer sign that the breakout is real |
| Shape on Chart | A downward-sloping trendline connecting the highs | A downward-sloping trendline on top with a horizontal support line below, forming a triangle |
| Trading Signal | Descending tops show that buying pressure is getting weaker and indicate the downtrend will continue | The descending triangle pattern signals a bearish breakout, but you should wait for confirmation before trusting it. |
How Volume Confirms or Weakens a Descending Tops Pattern

Volume helps confirm the Descending Tops pattern by showing whether sellers are taking control or buyers remain strong. When you combine volume with price action, it improves reliability.
| Volume Scenario | What It Means | Trading Signal |
| Decreasing volume at each top | Buyer strength is declining, along with weakening demand | This pattern strongly signals a bearish move. |
| High volume on the support breakdown | After the support level breaks, selling pressure increases sharply | When the price breaks down, it gives a clear signal to sell |
| Increasing volume at each top | The pattern may fail if buyers remain active | This pattern is weak, which increases the chances of a bullish reversal |
How to Trade the Descending Tops Pattern: Entry, Stop Loss, and Target Explained
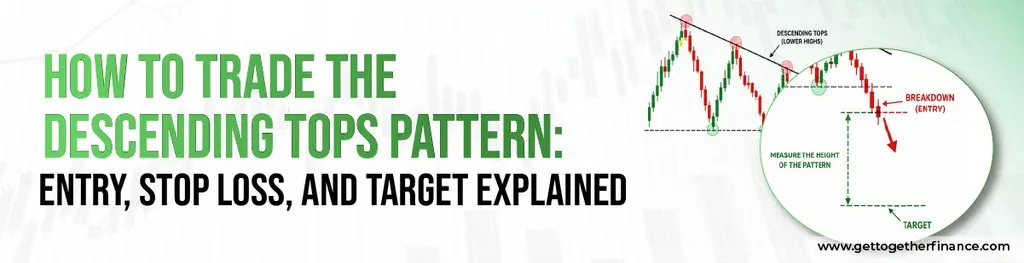
Descending Tops in the stock market are mostly about spotting when the market is losing strength and getting ready for a potential downtrend. Here’s how you can trade with this pattern:
- Spot the Pattern: To begin with, look for:
- A series of price peaks or highs
- A downward-sloping trendline
- Weak buying momentum
- Wait for Confirmation: Don’t jump into a trade just because you see a pattern forming. The price needs to break below a key support level (where it bounced back last time). This confirms that the sellers are taking over.
- Enter the Trade: Once the price goes below the support level, you can enter a short trade. You need to avoid entering before the breakdown is confirmed.
- Set Your Stop Loss: You should always place your stop-loss above the last lower high or the supply zone’s distal line to avoid false breakouts.
- Set Your Target: Always watch the next demand zone or key support level for your target. Don’t take the trade unless you’re getting at least a 2:1 risk-reward ratio.
For example: An NSE stock is forming lower highs and finally breaks below the ₹950 support level on strong volume. You could enter near ₹948, set a stop-loss above ₹980, and target ₹890 for a 2:1 risk-reward ratio.
How to Use Supply Zones With Descending Tops Patterns

In order to improve the accuracy of your trades, combine the Descending Tops pattern with Supply Zones. Every time a lower high forms near a supply zone, it indicates that sellers are pushing back against higher prices. This helps traders spot good short-selling opportunities.
From the following points, you get to know how to use Supply Zones with Descending Tops:
- Identify the supply zone near the latest lower high
- Wait for the price to get rejected at the supply zone and start moving lower
- Take a short position just below the supply zone’s proximal line
- Keep your stop-loss above the distal line for protection
- Set your target at the next demand zone below
Example: If a stock forms a lower high near a supply zone and starts falling. In this case, book profit at the next demand zone, enter a short trade below the proximal line, and set your stop-loss above the distal line.
How to Combine Descending Tops With the Top-Down Approach for Trade Confirmation
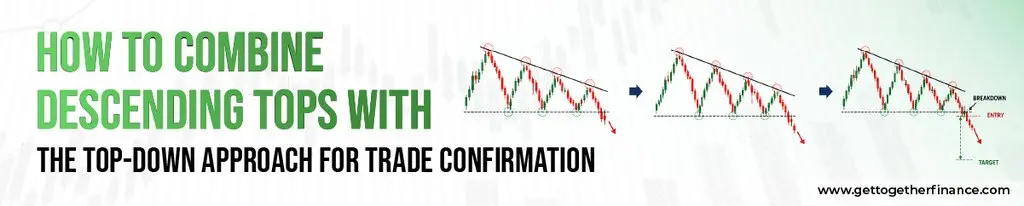
Before entering a trade, the Top-Down Approach helps traders confirm a bearish setup. When you check both the sector and the stock, it increases the chances of discovering a higher-probability trade.
Here are some steps to follow:
1. Check the Sector Chart: First, check the sector index’s weekly chart for a Descending Tops pattern. If you spot one, it indicates that the whole sector is bearish.
2. Find a Stock in That Sector: Now, find a stock within that same sector that’s also forming a Descending Tops pattern.
3. Enter the Trade: If both the sector and the stock are showing bearish patterns, then that strongly indicates entering a short trade after confirmation. Such alignment significantly improves your chances of success.
Limitations of the Descending Tops Pattern: When Not to Trade It

Descending Tops is useful but not always accurate. It has some limitations, and understanding all of these helps traders make better trading decisions. The pattern can work differently in different market conditions, and knowing its limitations can help traders avoid weak trades and make better decisions.
1. Signal Quality Issues
The pattern sometimes gives false signals, where the price breaks below support, then quickly reverses. Also, it doesn’t show how strong the move is, because it ignores trading volume. To fix this issue, always wait for a support breakdown with strong volume, and confirm the trade using GTF’s Demand and Supply Zones.
2. Interpretation Issues
Every trader has their own way of identifying the Descending Tops pattern, which can lead to different trading decisions. To increase your accuracy, always spot 2–3 clear lower highs and confirm with Demand and Supply Zones and volume before trading.
3. Market Condition Issues
The Descending Tops pattern works best in bearish markets and generally leads to short-term price moves. Before taking a trade, always check the overall market trend and confirm the setup using Demand and Supply Zones and volume analysis.
Risk Management When Trading Descending Tops: Position Sizing, Stop Loss and Targets

When trading the Descending Tops pattern, risk management is crucial. By combining demand and supply zones with proper position sizing, you can protect your trading capital and minimise risks. Here are some key risk management tips that help you trade the Descending Tops pattern more effectively.
1. Mark Supply Zones
First, spot the nearest supply zone where the latest lower high formed. This zone commonly acts as resistance, which helps guide your trade planning. Always look for an area where strong selling pressure pushed the price down, which can indicate a possible supply zone.
2. Spot the Demand Zone
Now, locate and mark demand zones below the current price level, where buyers have previously supported the price. This area can act as support, leading to price bounces over and over before the price takes a big drop.
3. Place Your Stop-Loss
Always keep your stop-loss above the distal line of the Supply Zone. This gives you flexibility in trading while keeping you protected from sudden reversals.
4. Calculate Your Position Size
Before entering a trade, calculate your position size by using this formula:
Position Size = Risk per Trade ÷ (Entry Price − Stop-Loss Price)
If you’re just starting your trading journey, it is recommended to risk only 1% of your trading capital on a single trade.
Example: If your trading capital is ₹1,00,000, your maximum risk should be ₹1,000. If you enter at ₹950 and set your stop-loss at ₹970, your risk per share is ₹20. Your position size will be:
₹1,000 ÷ ₹20 = 50 shares
5. Monitor Your Trade
It’s important to keep an eye on the market to track your trade. If the price keeps falling and you’re in profit, you should keep adjusting your stop-loss to lock in some gains as the trade progresses.
When traders combine the Descending Tops pattern with Demand and Supply Zones, sound position sizing, and disciplined risk management, they can make smarter trading decisions.
Descending Tops Across Different Timeframes: Intraday, Swing and Positional Trading in India

You can spot the Descending Tops pattern in the stock market on any timeframe. However, higher timeframes offer more reliability because they filter out short-term noise and give you more trustworthy signals.
- Intraday Trading (5-Minute & 15-Minute Charts): In this, the Descending Tops pattern usually forms within a few hours. It is generally used by F&O day traders to take advantage of short-term price fluctuations. With smaller price moves, traders typically target 0.5% to 1% profits.
- Swing Trading (Daily Chart): On the daily chart, the Descending Tops pattern forms over a few days or weeks. Swing traders frequently use this pattern to catch medium-term moves, and when it’s confirmed, they usually look for 3% to 5% profit.
- Positional Trading (Weekly Chart): On the weekly chart, the Descending Tops pattern forms over a few weeks or months. It works well for long-term trades and helps you spot the bigger bearish trends.
Descending Tops in Nifty 50 and Indian Stocks: Real Chart Examples

Real market examples make the Descending Tops pattern easier to understand. The examples below show how this pattern appeared in the Nifty 50 and Indian stocks. This helps you understand how to identify the Descending Tops pattern on real charts.
Example 1: Nifty 50 During a Market Correction
Let’s take the example of using a historical Nifty 50 chart from a past market correction. Mark the lower highs to show Descending Tops and highlight the Supply Zone at each one. When the price breaks below support, place the stop-loss above the Supply Zone, and set your target at the next Demand Zone.
Example 2: HDFC Bank (or Infosys) During a Bearish Phase
Let’s take the example of HDFC Bank (or Infosys) during one of its past bearish phases. Now, see how the stock kept forming lower highs, which shows a decline in buying pressure. Then, mark the Supply Zone at each lower high and wait for the price to break below the support level before entering the trade. At last, put your stop-loss just above the Supply Zone, and keep your target set at the next Demand Zone.
Learn to Trade Bearish Patterns with GTF’s Trading in the Zone Course

In order to understand the chart patterns, you need to be familiar with Demand and Supply Zones, sector analysis, and risk management. The GTF Trading in the Zone (TIZ) course teaches you to combine all these concepts and trade bearish setups confidently.
Here’s what you’ll learn:
- Module 2: In this module, you’ll learn to spot weak or bearish sectors before selecting stocks.
Module 3: Here, you will learn to trade against the trend using bearish patterns like Descending Tops and Demand-Supply Zones. - GTF EYE: This tool helps you spot stocks nearing key Supply Zones in real time, making it easier to spot bearish setups.
- GTF Indicator: It automatically marks Demand and Supply Zones on your chart, which help traders identify target levels, better entries, and stop-losses.
In a Nutshell: What to Remember About Descending Tops

All these key points will help you understand and trade the Descending Tops pattern in the stock market more effectively:
Avoid Weak Setups: If the market is strongly bullish or the breakdown lacks volume support, then avoid trading.
Understand the Pattern: A series of lower highs signals sellers gaining strength over buyers.
Wait for Confirmation: Always wait for the price to break below support with solid volume behind it before you enter the trade.
Use Demand and Supply Zones: Set your stop-loss at the Supply Zone, and your target at the Demand Zone.
Check Volume: During the breakdown, high volume makes the pattern more trustworthy.
Manage Your Risk: Set your stop-loss above the Supply Zone, and take risk on only a small portion of your trading capital.
FAQs

What’s the most common mistake traders make with Descending Tops?
Jumping into a trade too early before the pattern confirms is one of the major setbacks traders often fall for.
Do Descending Tops work better with certain time frames?
They can work on any time frame, but they’re often more reliable on longer time frames like daily or weekly charts. Remember – the longer the time frame, the longer the trend refrain.
Can I use Descending Tops to short a stock?
Definitely. If the pattern confirms, it’s a good signal that the price may drop, which is ideal for shorting.
How does volume affect the Descending Tops pattern?
Higher volume during the formation of descending tops strengthens the signal that sellers are gaining control.
What is the difference between descending tops and lower highs?
They are the same concept. Descending tops is the pattern name, while lower highs describe the price action.
How many tops are needed to confirm the pattern?
At least 2 lower highs are needed, but 3 provide stronger confirmation.
Is the descending tops pattern reliable for Nifty 50 trading?
Yes. It can be particularly useful on daily and weekly charts during bearish phases.



