Triangle Chart Pattern
- Updated on : March 27, 2026
- 7350 Views
- by Arun Singh Tanwar

 Facebook
 Instagram
 Youtube
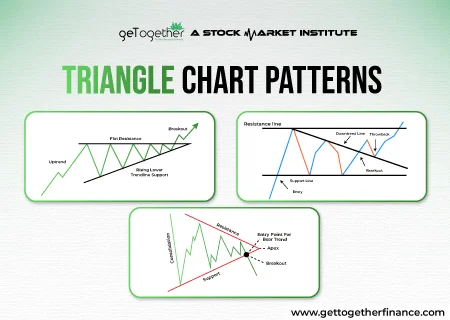
Triangle chart patterns such as ascending triangle pattern, descending triangle pattern and symmetrical triangle pattern are some essential tools that are used by traders to determine the prices of assets while predicting the behavior of buyers and sellers. The triangle chart patterns are conventional patterns and have been used by investors or traders since decades. The triangle chart patterns are helpful in identifying the bullish or bearish chart pattern in the security. The price of a security follows a particular trend to form chart patterns which are helpful in determining the future price action.
What Is a Triangle Pattern in Trading?

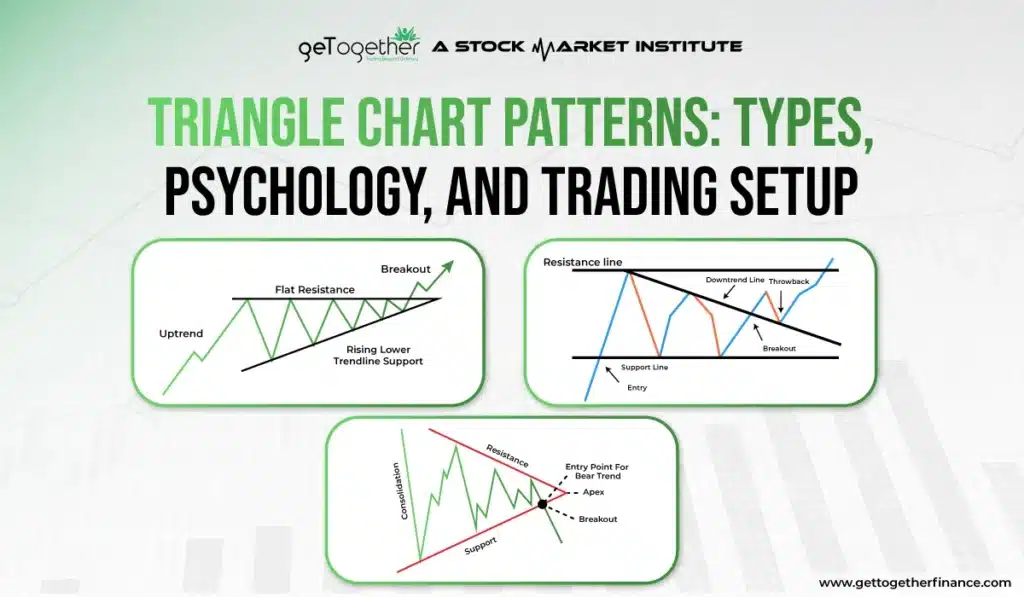
When it comes to trading, triangle patterns are one of the most common and reliable chart patterns used by traders to predict potential price breakouts. Understanding the types of triangle patterns can help in making smarter stock entry and exit decisions.
However, triangle pattern is formed by two trendlines (one resistance, one support) that are moving closer together. This shows that the market is consolidating, or building energy, before a sudden breakout. Moreover, ascending, descending and symmetrical are three types of triangle chart patterns.
Understanding the Structure of a Triangle Pattern
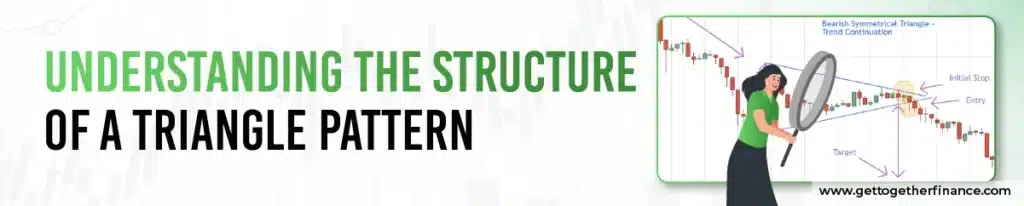
A triangle pattern is a common consolidation setup where a stock’s price temporarily tightens into a smaller range. This forms a triangle shape defined by two converging trendlines drawn along the swing highs and swing lows.
These trendlines act as temporary support and resistance. As the price moves closer to the triangle’s point (apex), volatility decreases, indicating market indecision. This period of tightening price action is essentially the market coiling before a significant move.
The pattern completes with a breakout: the stock price decisively closes either above the resistance or below the support. This breakout signals a high-probability start to a new, often powerful, directional trend.
What Triangle Shape Tells Us About Market Psychology?

The triangle chart pattern is a visual battle between buyers and sellers. It is a primary informational tool that shows indecision in the market.
The Psychology It Creates
- Tension Builds: As the price bounces between the converging lines, the trading range gets smaller. This shrinking space means market tension is building—the market is “holding its breath.”
- Traders Wait: Low volume during the pattern confirms that most traders are waiting. They are anxious to see which side wins.
- The Pressure Release: The moment the price breaks out (the triangle pattern in trading completes), the tension is released. The move is sudden because the losing side (e.g., sellers in a bullish breakout) are forced to give up, and the winning side rushes in. This creates the sharp, strong price action that follows the triangle pattern in stocks.
Ascending Triangle Pattern
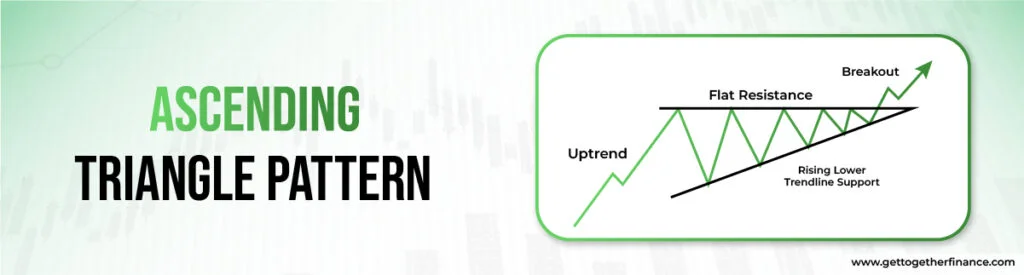
Ascending triangle patterns describe a bullish pattern as the price follows a continuous uptrend. The ascending triangle pattern is formed when there is a consistent buying pressure in the security. The price continuously moves in an upward direction indicating an upward trend and looking at this trend on the chart, analysts are able to identify an ascending triangle by joining the trend lines. The ascending triangle pattern is bullish in nature which confirms buying of the security for retail investors. Let’s identify the different components of the ascending triangle pattern that result in a bullish move.
Also Read : share market chart patterns
Features of an ascending triangle pattern
Uptrend: The existence of an ascending triangle pattern is identified by an existing uptrend in the market. The highs of this uptrend are higher than previous ones while its lows are also higher than previous lows.
Top Horizontal Line: After the uptrend, high reactions almost equal the top horizontal line. The horizontal line that connects the highs represents the resistance level for the breakout of the pattern.
Lower Ascending Trend Line: The ascending line is formed to give the structure to the pattern which connects the higher lows to the lower lows, hence making an upward move. This is an important trend line that helps to examine the pattern correctly.
*Considering the lows; if the second low is lower than the previous low reaction then the pattern is not valid.
Breakout: The support line turns into the resistance to give breakout to the pattern. When the ascending trend line breaks the horizontal line or the support line in ascending triangle chart patterns represent an upward move with a bullish market trend.
Enter and Exit Point: Long position is considered in this pattern, wherein traders make an entry after the breakout and exit the security after gaining certain profits.
Learning how to correctly identify entry and exit points, especially in patterns like the ascending triangle, is a skill refined through practice and structured learning. Many of the best stock market courses cover these setups in-depth, helping traders make more informed and confident decisions.
Behind the move
The uptrend before the ascending triangle pattern determines a strong buying pressure. The support line is the representation of overhead selling of the stock that prevents the price to move past a certain level. This determines a large selling pressure which is not able to execute because of higher lows or continued buying. The higher lows takes the price to a higher level which breaks the resistance level, therefore marking a bullish trend.
Also Read: Piercing Pattern
Descending Triangle Pattern
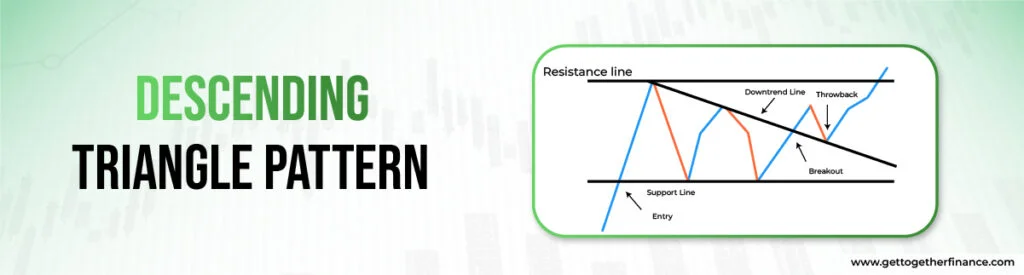
The descending chart pattern is helpful in determining price action trading that follows a continuous downward trend. The pattern implements a bearish trend where traders can make their decision about entry or exit in the market. It is identified as “flat bottoms and falling tops”. A descending triangle pattern forms a downward trendline connecting the lower highs. The descending triangle pattern is bearish in nature and hence helps retail investors to exit the security timely without making losses. Some major characteristics to identify the descending triangle pattern are:
Important Characteristics
Existing Downward Trend: To follow the trend, an existing downward trend line is required which determines the pattern of descending triangle.
Horizontal Line: This is the lower trend line or the support line in the descending triangle pattern connecting the lows of the price.
Descending Upper Trend Line: The descending upper trend line connects the two highs where the recent high is lower than the previous high depicting increased selling pressure of the security.
Breakout Point: When the selling pressure is able to breach the support line or resistance level then the traders are active and execute their trades to gain profits. The breakout determines the bearish trend depicting that the price will move downwards.
How does the descending triangle pattern form?
A descending triangle pattern implies the behavior of sellers. The pattern describes that sellers are more aggressive than buyers with a fall in prices and make continuous lower highs. This trend depicts that the demand for security is weakening but the horizontal line prevents the price from going down further. The price continues to decline for some time but does not cross the support line. When the price reaches the breakout point, it starts going down representing a start to the bearish trend in the security. The lower highs are responsible for a bearish trend indicating an increased selling pressure of the security.
Read More : Symmetrical Triangles vs Pennant Patterns
Symmetrical Triangle Pattern
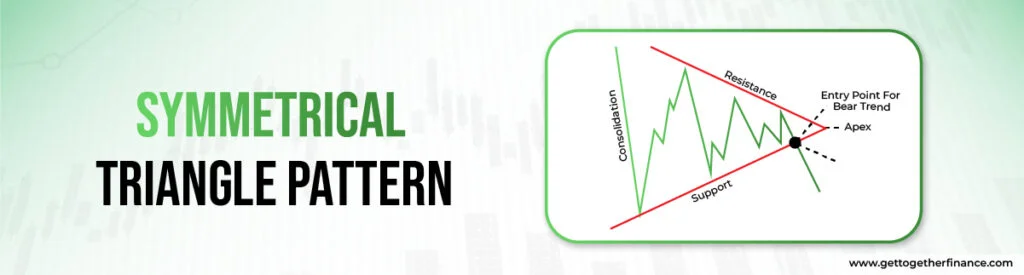
The principle of price consolidation directs the symmetrical triangle pattern where the two converging lines move together based on the direction of the market. It is unidentified that the pattern will make a bullish or bearish trend. The symmetrical triangle can be seen as these two converging lines get narrower, coming closer to the breakout point. The symmetrical triangle pattern is ‘neutral’. In a symmetrical triangle pattern, confirmation of the trend is required by an investor to make a decision as it can form a bullish or bearish pattern.
How to identify symmetrical triangle patterns?
Follow the steps to mark the symmetrical triangle pattern:
1. Find the Trend: Firstly, find the trend i.e. upward or downward trend in the price chart. A trend must always exist in order to define a chart pattern.
2. Trend Lines: Draw the trend lines on the chart that connect the highs and the lows, making converging lines that meet at the breakout point to form a market trend.
3. Apex: Apex is the intersection of the two trend lines which represent that breakout is about to happen and the traders must make a decision.
4. Breakout Point: The breakout point of a symmetrical triangle pattern is undefined and the traders must wait as it can give a bullish or bearish trend.
Since the breakout direction in a symmetrical triangle is uncertain, traders often prepare for both scenarios. This dual outlook is a core part of strategic planning in an option trading course, where managing risk around such patterns is a key focus.
5. Entry or Exit: If the pattern breaks out in an upward trend then the market is bullish and traders prefer to enter the market to gain profits. Else, in a downward breakout or bearish trend, they must consider a short position for entry or exit.
Main reason behind symmetrical triangle pattern
Symmetrical chart pattern describes a consolidation phase in the market due to indecision. When the market is uncertain, it takes a form of symmetrical triangle pattern where the buying and selling continues. The higher lows represent the increase of potential buyers while lower highs indicate selling pressure. This pattern enlightens the decreasing volatility where the price range contracts within the triangle. The potential breakout point is the main deciding point for traders which guide them about entry or exit.
Summing it up
| Ascending Pattern | Descending Pattern | Symmetrical Pattern |
| Bullish Trend | Bearish Trend | Neutral |
| Upward Trend Lines | Downward Trend Lines | Converging Trend Lines |
| Long Position | Short Position | Long or Short |
Limitations of Triangle chart patterns

Triangle chart patterns are mainly used by conventional traders and investors. Sometimes, these patterns do not prove to be effective because they are widely used by traders and hence most people already know the move which eventually decreases the accuracy of the price action. Considering this, there is a requirement of clubbing it with more in depth technical analysis methods like demand and supply theory. Demand and supply theory helps in increasing the probability of these patterns if used in the right way.
Conclusion
It is an undeniable fact that these chart patterns also fail sometimes as you cannot predict market volatility and other conditions. This is why Demand and Supply Theory is more reliable which helps to analyze the price action. Investors can easily manage their risks by setting their stop losses with the help of demand and apply theory. This is one intellectual method of trading where traders can enjoy huge returns while minimizing their risks simultaneously.


