What is Volatility Index (VIX)?
- Updated on : May 23, 2026
- 4275 Views
- by Arun Singh Tanwar

 Facebook
 Instagram
 Youtube
Volatility is the heart of options traders. It helps them decode market sentiment and anticipate its rhythmic dance moves.
But did you know that experts found a way to gauge the expected volatility of the stock market. Not only this, they have an index, created based on the market’s expectations of 30-day volatility.
We are discussing none other but VIX, also known as Volatility Index, one of the most valuable and recognized indicators of expected market volatility.
Let’s get into the in-depth details of this Volatility Index (VIX) and how it can help in keeping you sane in their roller-coaster ride of the stock market.
What is Volatility?
Famous among traders or investors as a valuable term, volatility works like the main key to unlock stock market secrets. The term volatility means the characteristic of changing unpredictably and more often. Hence, the concept focuses on measuring the rate of fluctuation of price.
Volatility is calculated based on standard deviation of a yearly return over a specific duration. Most often traders confuse the concept with a magical crystal ball of potential market movement. However, this is super important to understand that volatility only helps understand the demand/supply, variance in volume, and anticipated price fluctuations in either direction.
What is the Volatility Index (VIX)?
The Volatility Index, also referred to by its acronym sign, VIX, is a real-time market index. The concept helps decode the market expectation on how much the price of S&P 500 stocks will change in the short term. In India, VIX is calculated as per Nifty 50 index, a benchmark stock market index that tracks performance of the 50 largest companies listed on. The National Stock exchange (NSE) of the country.
The VIX calculates the anticipated volatility of Nifty 50 index may experience over next 30 days. Market experts also call it ‘implied volatility’ since it studies options markets where speculations based on future performance of the market are made.
For instance, if the stock market is weather, then the Volatility Index (VIX) is a weather forecast on how bumpy the ride might be. VIX doesn’t tell you what will actually happen, but shows the prediction made by expert investors based on their expectation. In general, it shows the response of traders in the market and sentiments of active buyers or sellers (calm and panic).
What is the India VIX Index?
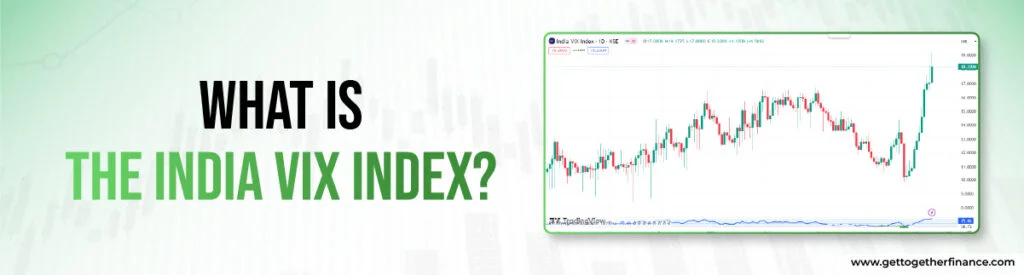
Akin to the S & P 500 VIX index, the India VIX Index, is also known as the fear gauge or fear index. It is a real-time market volatility indicator specific to the Indian stock market. It reflects investor sentiment about the expected volatility of the Nifty 50 index over the next 30 days.
Although it doesn’t predict future market movement, it rather measures investor expectations of how much the Nifty 50 prices might fluctuate in the next 30 days. A higher India VIX suggests investors anticipate more significant price swings (up or down) in the Nifty 50, indicating a potentially volatile market. A lower India VIX suggests investors anticipate a calmer market with less dramatic price movements in the Nifty 50.
Also Read: Volume Profile Indicator
How VIX Works?
Think of VIX as the annualised implied volatility of a hypothetical Nifty 50 stock options with 30 days to expiration. Well, the price of this hypothetical Nifty 50 index is based on the option chain of Nifty 50. Now as per the rule of implied volatility, the more dramatic the price swings, higher the market volatility and contrary.
India has its own version of the VIX index: the India VIX. This index has become a popular benchmark for gauging volatility in the Indian stock market, earning the nickname “fear gauge” or “fear index” just like its US counterpart. The India VIX and the Nifty 50 tend to move in opposite directions. When the India VIX rises, it indicates that investors anticipate more significant price swings in the Nifty 50, potentially leading to a dip in the index itself.
If the VIX price is rising, it shows more active traders and demand of options in the market, making them an expensive choice. On the other hand, if the VIX takes a ‘U’ turn from uptrend, it impinges on the options price, showing a dominating number of active sellers or supply.
Remember: Volatility never predicts market movement ahead of time. Hence, this is important to in tandem VIX index with preferable technical and fundamental analysis tools.
Calculating VIX Values
To understand a concept thoroughly, learn its maths. Here is how you can calculate the VIX:
- Begin by selecting your favourite option. Make sure the options include a range of put and call strikes in two consecutive experts dates with a margin of 30-day target.
- Next, measure the contribution by adding up variance of the first and second expiration to get the total.
- Now, sum the 30-day variance by combining two variance as per the expiration time of each.
- Figure out the standard deviation by taking the square root figure. In the next step, simply multiply the result by 100.
The outcome is the value of the VIX index.
How to Use the VIX?
The VIX transformed volatility from one element to an index, a traceable asset. The first VIX-based futures contracts were exchanged in March 2004 by CBOE. In February 2006, the list of first VIX-based options was launched.
Though trading in VIX is an out-of-sight option, investors can optimise VIX to measure volatility. The key is the inverse relationship between the VIX and the Nifty 50. When the VIX rises, indicating anticipation of higher volatility, the Nifty 50 might experience a decline. Conversely, a falling VIX suggests lower volatility and a potentially calmer market, which could coincide with a rise in the Nifty 50.
How to Use VIX with Your Trading Strategy:
- Hedging During Volatility: During periods of high VIX, you can use options contracts to hedge your existing stock portfolio. Options offer downside protection if the market falls as anticipated by the rising VIX.
- Volatility Trading for Experienced Investors: Some experienced traders use options to capitalise on the volatility itself. When the VIX is low, options contracts are cheaper. If the VIX rises as expected, the value of those options contracts will increase, offering potential profits. However, this strategy requires a strong understanding of options and carries significant risk.
It’s A Wrap
Volatility Index helps find what experts believe about market behavior by overviewing Nifty 50. However, it is crucial to remember that in investing, there is no specific way to forecast certain price movement and future stock market performance. VIX acts merely like a suggestion and history entails the evidence of wrong prediction too. This is the reason investors tandem in strong technicalities or prefer more diversified, low-cost index funds on a regular basis. The whole idea will help traders smooth out major price swings that occurred in the long-term.
FAQs
What factors can influence the VIX index?
There are several influencing factors that affect the VIX index. These factors include geopolitical events, market uncertainty, global news, economic reports, etc. VIX index rates often rise during the situation of market stress or panic among active traders. On the other side, VIX Index average falls during the calmer market conditions.
What is a normal VIX value?
According to experts, the long-run average of VIX has been around 21. However, when the VIX level reaches and surpasses 30, traders consider it a highly volatile market. In this situation, more active traders enter the market, creating a situation of ‘panic’ or ‘fear’.
What does the VIX tell us?
The level of stress or calm/panic in the market. Nifty 50 VIX uses the price fluctuations of the Nifty 50 index to predict the potential market moves. On the other hand, the CBOE Volatility Index (VIX) uses the price fluctuations of the S & P 500 index to anticipate market movement.
Also known as the ‘fear index’, if the VIX level rises above 30, the market is considered highly volatile with a higher rate of market stress or panic. This means more number of active buyers or sellers in the market, causing dramatic swings in the price.
Is it a good sign when the VIX drops?
The VIX works exactly inverse to the Nifty 50 market direction. That means if the VIX is up, there is more panic among active traders toward buying or selling sentiment. On the contrary, when the VIX rate drops, it shows more stability in the market and calm among traders.
It depends on the trader’s personal style and trading style, whether the market looks for his approach or not.


